I want to talk Minsky and the Levy/Kalecki Profit Equation
This may sound a bit heady, but don’t worry. We’re going to break it all down Barney style and then walk you through how you can use the frameworks for understanding the current environment in order to better assess the probabilities of potential outcomes (ie, gauge the general conditions).
I still had much to learn but I knew what to do. No more floundering, no more half-right methods. Tape reading was an important part of the game; so was beginning at the right time; so was sticking to your position. But my greatest discovery was that a man must study general conditions, to size them so as to be able to anticipate probabilities. ~ Jesse Livermore
Let’s kick things off with the Levy/Kalecki Profit Equation.
The Profit Equation is just a macroeconomic accounting identity for how the global economy actually operates. Specifically, it answers the question as to where “Profits” come from and thus, growth.
If you’ve ever heard of The Jerome Levy Forecasting Center where a number of talented economists work. Well, that’s the same Levy. The center performs analysis using the Profits Equation framework developed by Jerome Levy in 1908 (side note: Kalecki was a renowned economist who developed the same framework as Levy years later and received credit initially for it because Levy was a relatively unknown name).
Now, you can read the full white paper on the equation here, which I highly suggest you do so. We’re just going to cover the gist of it today, because it’s relevant to potential macro risks and constraints we’ll be facing in the coming year(s).
The actual accounting identity looks like this:
Profits before tax = + Investment – Nonbusiness saving + Dividends + Corporate profits taxes
This accounting identity, which like any identity holds true under any circumstance, is just saying that corporate profits are the direct result of net investment minus nonbusiness (Households + Government + rest of world) saving before dividends and corporate taxes are paid out.
Confused? Don’t worry. I’ll break it down even more.
We all know where profits come from at the individual level, right? A company earns more in revenue than its costs and the excess is profit.
Well, if you pull back and look at the global economy as a whole, it’s a closed system. Its closed in the sense that profits aren’t magically appearing from anywhere outside of the global economy. But profits obviously aren’t a zero sum game. If one company earns profits it doesn’t necessarily mean that another company somewhere has to be operating at a loss. There wouldn’t be any growth if that was the case. So, where do profits come from then?
The answer is in net investment, which is a positive sum game. If we divide the economy into our four aggregate entities (1) US Corporations (2) Households (3) All levels of US Government and (4) the Rest of the World (RoW) and look at them as a whole, there needs to be net positive investment as a whole for their to be profits.
This means that an economy’s ability to produce profits comes down to the net expansion of the aggregate balance sheet in the macro accounting identity. For instance, if the US Government is running a budget surplus (shrinking its balance sheet), like it did in the late 90’s. Then either the Household, Corporate, or the RoW needs to take up the slack and expand their balance sheets to make up for the fall in demand. Or else demand will fall and profits will contract.
In the late 90’s, US Corporates made up for the government’s demand deficit by expanding their balance sheet. In the 2000s it was Households and the RoW (led by China) who borrowed money and invested — US Households in homes and China in building entire cities.
Understanding that profits are essentially the residual of the net balance sheet expansion/contraction of the entire global economy is helpful because (1) we can look at the trends in the balance sheets of our four macro aggregates to see if net demand (profit) is being created and (2) we know that their are natural limits to how much balance sheets can expand and therefore whether the global economy may be headed for a contraction in profits.
This is essentially a more nuanced framework for understanding how the debt cycle (as put forth by Bridgewater) works. Profits are essentially the result of expanding balance sheets (increases in debt). The more balance sheets expand the lower interest rates need to drop in order to decrease debt servicing costs and keep the cost of capital down for marginally profitable firms — essentially keep the economy from going into free fall.
Enough with the theory… How does this apply to the present day?
Well, think about what’s been the source of profits in the US economy the last couple of years.
The Household sector has been deleveraging since the Great Financial Crisis (GFC). They’ve been contracting their balance sheets and thus have been a negative source of profits/demand in the economy. The demand then has come from both the Federal Government and the Private Sector, both of which have been rapidly expanding their debt.
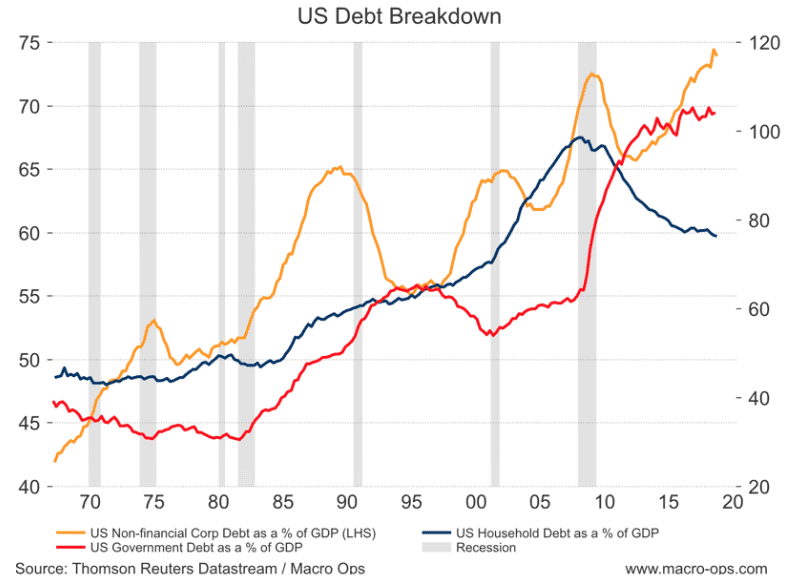
The RoW, primarily the Eurozone and China being the two economies large enough to matter, have been either a wash or net drag on global demand over the last few years.
China has pretty much maxed out its balance sheet limits where it now takes extraordinary injections of credit from the government to produce a relatively modest and short-lived economic impulse — the whole “pushing on a string” thing. And European consumers and corporates are fairly weighed down by debt and haven’t been helped much at all by their governments, who unlike the US decided to go with German imposed austerity following the GFC (though this may be starting to change, which we’ll discuss soon).
And this brings us to a growing concern of mine. Where is net demand going to come from in the future?
The fiscal impulse from the US tax cuts and increased budget deficit is starting to wear off. And on the corporate side, with corporate debt to GDP at all-time highs, how much more credit driven demand can we expect?
Things actually look worse when you disaggregate the corporate data. Taking a look under the hood we find that debt is actually much higher and there are a number of “zombie” firms that aren’t profitable even in such a low cost financing environment which means its going to take just a small tightening of financial conditions to cause these firms to go belly up, potentially kick starting a chain reaction of defaults.
Check out the following notes from Financial & Insurance Firm, Euler Hermes (emphasis by me):
- Between 2009 and Q3 18 the US total debt has declined from a peak representing 350% of GDP in Q1 09 to 311.5% in Q3 18. While the US as a whole has been deleveraging, the business sector (corporate and non-corporate) has re-leveraged, standing at 72.6% of GDP or USD 15tn today. This represents a 2pp deviation to trend. Past recessions in the US have coincided with positive deviations ranging from 2-8pp of GDP.
- According to our calculations, the true level of non financial corporate debt in the US may be 30% or USD 3.9tn higher than officially reported, primarily because of leveraged loans bought by non-banks. We estimate that the debt-to-EBITDA ratio would thus be close to 4.6 instead of 3.9. As a consequence, the BAA-Treasuries’ spread (to AAA) should be about 120bps higher than currently observed (~ 230bps today) if hidden debt were factored in.
- The Trump Administration’s fiscal stimulus has boosted demand in the US over the past couple of years. According to our model, a correction of this excess demand, back to potential output growth, could trigger an increase of the corporate delinquency rate from 1% in Q3 18 to 2.32% (highest level since Q2 11). This adjustment could follow strong disagreement about fiscal policy as we enter 2019-20 budget discussions. Corporate spreads will thus continue to hover around 230-250bps as seen today, still underestimating hidden debt, but aware of looming risks in the corporate sector. In a stress scenario (likelihood to switch estimated at 35%), which could correspond to a series of defaults for instance, the delinquency rate would jump to 3% and credit spreads would very quickly increase by 70bps higher than today.
- The bottom line is that be it from scoping (hidden debt) or for cyclical reasons, we believe that corporate spreads are underestimated today, and that unfortunate events (rapid downturn, market defaults) could end up pushing up spread by 70-190bps, by sheer realization by market actors of intrinsic risks in that segment.
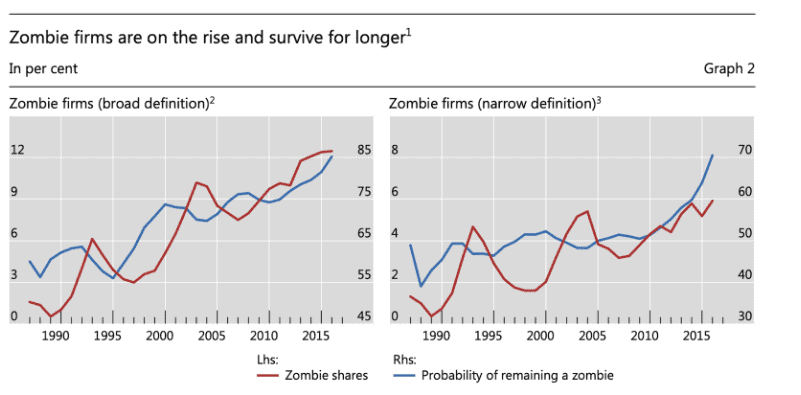
The Bank for International Settlements (BIS) put out a research paper last Fall, titled “The rise of zombie firms: causes and consequences”, where they discuss the pervasive rot in the developed market corporate sector, especially here in the US.
Here’s a few of the notable highlights from the paper.
- 12% of all companies globally are now “zombie firms,” meaning that they can barely pay the interest on their debts. The number is 16% in the US, which is an eight-fold increase since the 90s.
- These zombie firms have been kept alive by low interest rates along with investor demand for “leveraged loans”.
- The leveraged loan market is now in the trillions (the exact number is unknown) and consists of low-quality corporate debt that’s at risk of being downgraded — which would cause forced liquidation — should interest rates rise too much.
It seems we’re on a clear course of transition from what Minsky would call the “speculative financing” stage to the “Ponzi Financing” stage of the financial cycle.
For those of you not familiar with Hyman Minsky, here’s a brief summary of one of his more popular theories, which applies to our discussion today.
Minsky came up with the “financial-instability hypothesis” which stated that long stretches of prosperity sow the seeds for an eventual crisis. Economic stability breeds instability.
Minsky understood that recency bias drives myopia in the human decision making process. Economic actors end up extrapolating low volatility into the future which leads to more risk taking in the present through the use of leverage (credit).
The theory was established by defining what investment is, and its role in an economy. Which, put simply, investment is the exchange of money today for money in the future. That money (investment) can come from one of two sources: the economic actors’ (consumer, company, government) own cash flows, or from the cash flows of others (lenders). And it’s the balance between these two sources of investment that comprises the stability of the financial system.
According to Minsky, the financial cycle typically follows three stages of financing; these are:
- Hedge financing
- Speculative financing
- Ponzi financing
Hedge financing is the most stable of the three. It’s when the economic actor relies on its own stable cash flows to repay any borrowings. It’s when the actor’s earnings far outweigh its limited borrowings.
Speculative financing is when the actor uses its own cash flow to pay the interest on its debt, but must assume more debt to repay the principal; thus rolling its debt over. This stage of financing is less stable than hedge financing.
And lastly, there’s Ponzi financing, which is the most unstable of the three stages of financing. Ponzi financing is where the actor’s cash flows do not cover either the principal or interest payments on its debts. The actor is completely reliant on the appreciation of the underlying asset in the hopes that it’ll be enough to cover its liabilities.
Minsky argued that financial cycles naturally progress from each stage of financing to the latter; driven by human greed and carelessness. When economies enter the Ponzi stage, they become increasingly unstable and eventually experience a “Minsky Moment” which is a sudden collapse in asset values, leaving both lenders and borrowers exposed. This is the deleveraging phase of the debt cycle as put forth by Bridgewater.

So we have a diminishing US fiscal impulse, a nearly tapped out corporate sector riddled with zombie firms in an economy transitioning from speculative to ponzi finance, all which sits atop a leveraged loan market that measures in the trillions. Great…
The Game Masters (Policy Makers) are well aware of this threat. Former Fed chair Janet Yellen remarked in an interview with the FT last Fall that “I am worried about the systemic risks associated with these loans. There has been a huge deterioration in standards; covenants have been loosened in leveraged lending… There are a lot of holds. We should not feel the financial stability glass is full.”
I believe it was the market’s concern (rightfully so) that drove the large selloff at the end of last year. With the Fed acting as if they were on rate hiking autopilot, a painful recession and zombie killing field was all but assured if they had not changed course. But, they did, and here we are. The game is still going and may very likely go on for a while longer.
This is all rather big picture stuff. It may or may not be actionable in the near future. But it’s certainly something we need to be aware of because it will eventually matter and be actionable.
I’m still bullish the market but I do think the longer-term risk/reward is less positively skewed than it was just a few months ago.
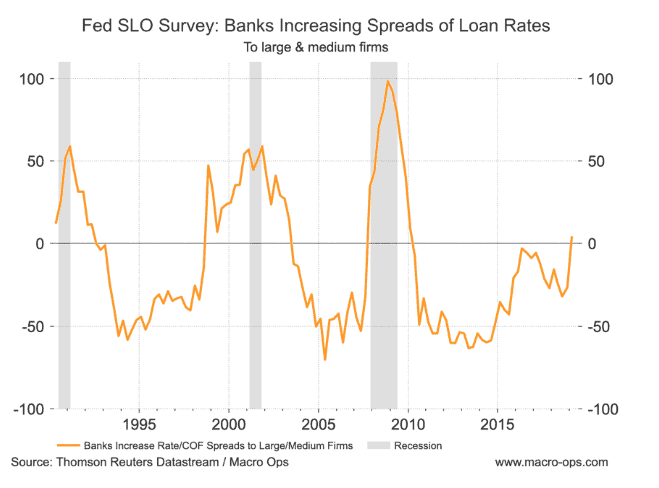
There’s some deteriorating data that’s linked to the leveraged loan market as well as our zombie firms that will eventually cause a domino effect of economic pain should the data not reverse following the Fed’s easier stance. The two charts below are evidence front and center for this. We have the Fed Senior Lending Officer (SLO) survey showing banks are increasing the spreads on loan rates to large and medium firms (a reading above zero means lending conditions are tightening).
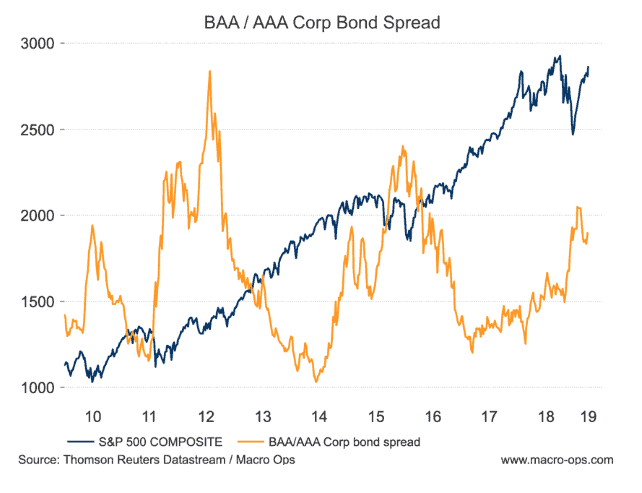
And the BAA/AA corporate bond spread has failed to reverse with our other indicators of financial/liquidity conditions. This tells me the market is finally starting to sniff out the brewing trouble we just discussed.
Thanks for reading! I’ll have additional updates as the data unfolds.