If you want to trade macro, you need to understand liquidity.
PTJ, Druck, Soros, Dalio — all these legends have expressed this fact multiple times.
Liquidity is what moves markets.
This is even more true now than in the macro heydays of the 70s and 80s.
With the rise of “blind investing” in the form of passively buying and holding ETFs, the majority of investors don’t care about valuation or merit. They just auto-shuttle their excess funds to the nearest robo advisor without a second thought.
This amount of “excess funds” is largely dependent on liquidity conditions.
When liquidity is loose, it’s cheap to get levered. People have extra cash and plow it into risk assets. Prices rise.
When liquidity is tight, people have less cash to spend. They may even sell stuff to service their existing debt. Prices fall.
There are a myriad of ways to measure and monitor liquidity conditions.
No single method is best, but one of our favorites is using the Chicago Fed’s National Financial Conditions Index (NFCI).
This index combines over 105 different indicators of financial activity to form one easy-to-read liquidity measurement. Money markets, debt markets, equity markets, traditional banking systems, “shadow” banking systems — they’re all included.

The zero line represents average liquidity conditions. Positive values indicate tighter-than-average conditions and negative values indicate looser-than-average conditions.
The Chicago Fed also publishes the Adjusted National Financial Conditions Index (ANFCI).
Since financial liquidity conditions are highly correlated to economic conditions, this index isolates the uncorrelated component. It tells us what liquidity conditions are like relative to economic conditions.
Positive values indicate liquidity conditions are tighter than would be suggested by current economic conditions, while negative values indicate the opposite.
You can see the difference between the standard and adjusted index in the graph below.
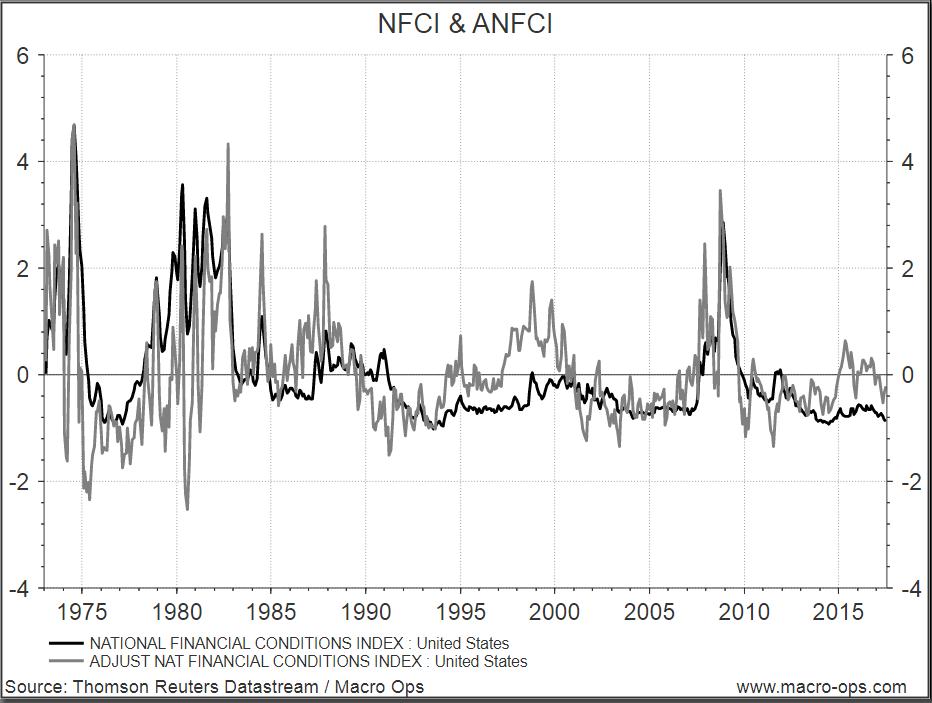
We prefer the ANFCI because it isolates liquidity conditions better than the NFCI.
The NFCI doesn’t always tell you when liquidity is deteriorating. In the late 90’s and 2014/2015, liquidity conditions were worsening but the strong stock market and strong economy kept the NFCI below 0, signaling liquidity was loose.
In contrast, the ANFCI was above 0 during the same period, signaling conditions were actually tightening.
The ANFCI is a little noisy to look at, but if you smooth the data with a 12-month MA, you get a nice picture of liquidity conditions in the U.S.
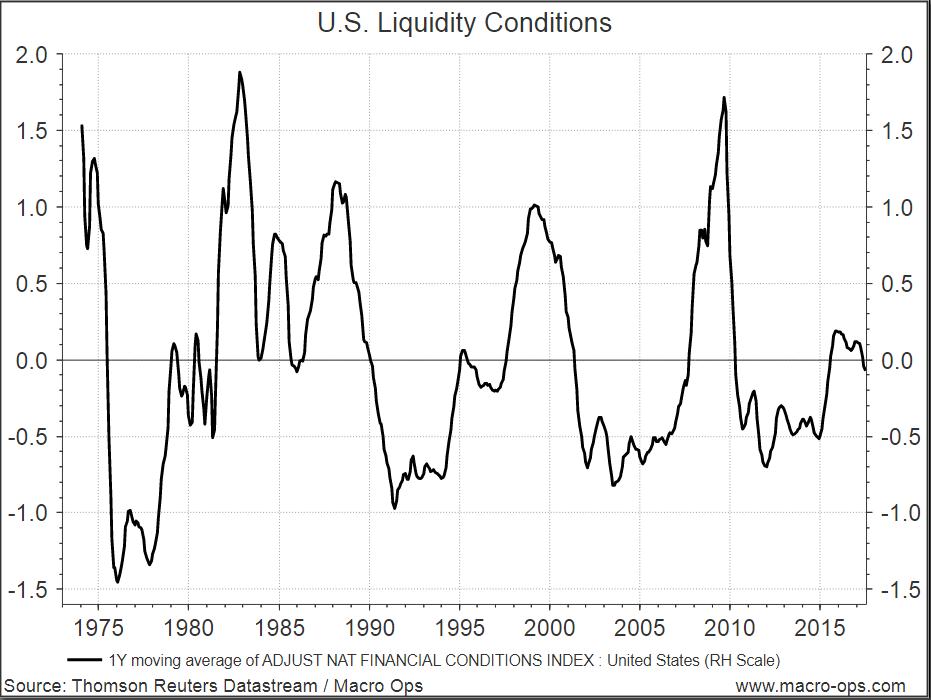
The cyclical nature of our economy becomes clear and it’s easy to see how liquidity predicts business cycles. You can use this tool to help you trade on the right side of the market.
When liquidity is tightening, take bearish trades. When liquidity is loosening, take bullish trades.
This index is also broken down further into 3 sub indices — risk, credit, and leverage.
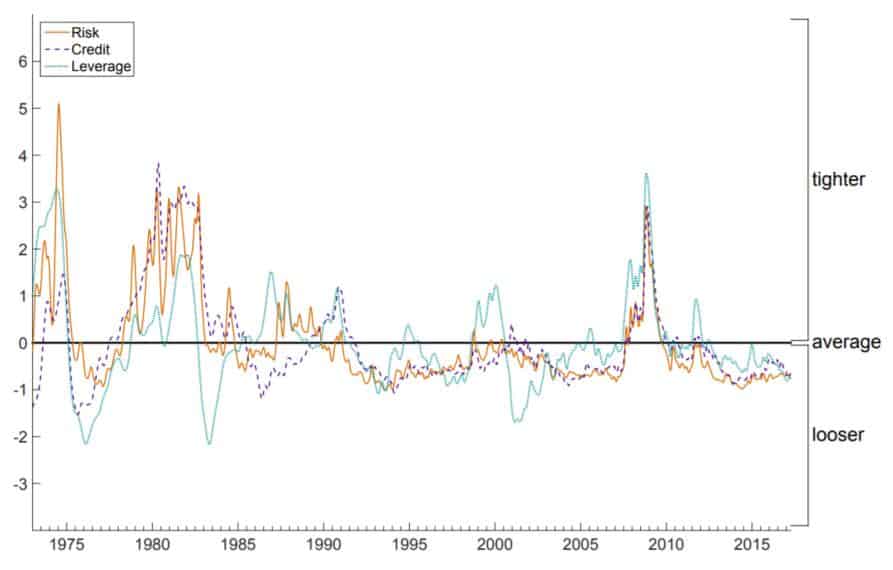
Risk is a coincident indicator, credit is a lagging indicator, and leverage is a leading indicator of financial stress.
For trading purposes, the leverage part of the equation matters the most to see where the stock market is headed.
Above average leverage sows the seeds for a recession and a falling stock market. Below average leverage precedes economic booms and stock market rallies.
Ray Dalio discovered this logic long before the Chicago Fed and has made billions trading off it.
The leverage index can be broken down yet again to only include nonfinancial leverage.
Nonfinancial leverage is one of the most powerful leading indicators of stock market performance.
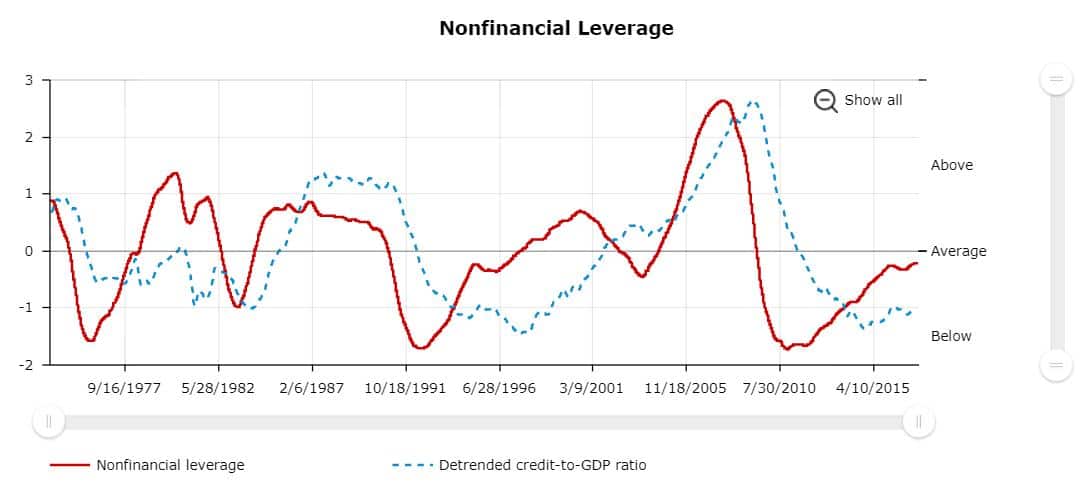
This graph might look familiar to you because it’s basically the short-term debt cycle, which can help you time markets.
For example, debt was at obscene levels before 2008 and signaled a shorting opportunity. And by 2010 debt was back below average and signaled a buying opportunity.
People are always the most levered at a market top and the least levered at a bottom.
A skilled macro trader wants to do the opposite. Paying attention to nonfinancial leverage will help you do that.
Lever up when others are unlevered and delever when others are highly levered.
Despite all the financial doom and gloom we’re drowned with nowadays, nonfinancial leverage readings tell a different story.
Current levels are only average.
Before making your next trade, take a look at these indicators.
How’s liquidity? Where are we at in the debt cycle?
Knowing these answers will make you a lot more confident in your trading. It’s hard to get blind sided by a big crash or miss out on a huge rally when you have a handle on liquidity.
Summary
- Liquidity is a key variable in determining the macro landscape
- We can monitor liquidity using the ANFCI
- If the ANFCI is trending higher, liquidity is tightening and we want to lean bearish
- If the ANFCI is trending lower, liquidity is loosening and we want to lean bullish
- The nonfinancial leverage component of the NFCI tells us where we are in the debt cycle
- We want to buy risk assets at the bottom of the debt cycle (below average leverage) and sell risk assets at the top of the debt cycle (above average leverage)