In today’s volatile market environment, the ability to identify, capitalize on, and properly exit trends remains one of the most powerful edges available to global macro investors. While markets may change, the fundamental principles that drive trend formation and momentum rarely do.
You asked for it, so I’m going to go deeper into the lifecycle of trend following, from identification to position sizing to the eventual exit.
Identifying Trends: Beyond the Obvious
True trends are more than just price movements in a particular direction. They represent structural shifts backed by fundamental catalysts:
- Multi-timeframe confirmation: A genuine trend appears across multiple timeframes—daily, weekly, and monthly charts all telling the same story
- Volume validation: Look for increasing volume on trend-continuation moves and decreasing volume on counter-trend retracements
- Relative strength metrics: Compare asset performance to relevant benchmarks; true trends outperform their peers consistently
- Breadth indicators: Market-wide participation supports sustainable trends; narrow leadership often signals caution
The most profitable trends often begin quietly, with subtle institutional accumulation before retail participation. By the time financial media identifies a trend, smart money is typically already positioned.
Advanced Trend Identification Techniques
Looking beyond price-based signals, sophisticated trend followers incorporate these advanced identifiers:
- Rate-of-change divergence: When momentum indicators begin diverging from price, it often signals the early stages of trend formation
- Intermarket analysis: Correlations between related asset classes can provide early confirmation of nascent trends
- Sector rotation patterns: In equity markets, sector leadership rotation often precedes broader market trends
- Cross-asset confirmation: Currency moves often anticipate commodity trends; bond yields frequently lead equity sector rotation
The intersection of these signals creates a powerful filter that helps distinguish between fleeting price movements and sustainable trends with true profit potential.
When Trends Transform into Momentum
Trends evolve into momentum when market psychology shifts from skepticism to acceptance. Key transition signals include:
- Acceleration in the slope of moving averages (medium term (50 period) and longer term (200 period) for example)
- Breakouts from consolidation patterns on above-average volume
- Fundamental narrative adoption by mainstream financial media
- Decreased correlation with broader market indices
This transition phase offers the optimal risk/reward entry point—after confirmation but before widespread recognition drives valuations to unsustainable levels.
The Psychology of Momentum
Understanding the psychological phases of trend development can provide critical context:
- Stealth Phase: “Smart money” accumulates positions while the majority remains unaware or skeptical
- Early Adoption: Technical breakouts attract systematic traders and trend followers
- Public Participation: Mainstream recognition brings retail investors and increased media coverage
- Euphoria: Valuation disconnects, excessive leverage, and FOMO behavior signal approaching exhaustion
Monitoring these phases helps you gauge where a trend stands in its lifecycle and adjust positioning accordingly. The most profitable entry point typically occurs during the transition from early adoption to public participation—when the trend has been validated but before excessive enthusiasm drives unsustainable valuations.
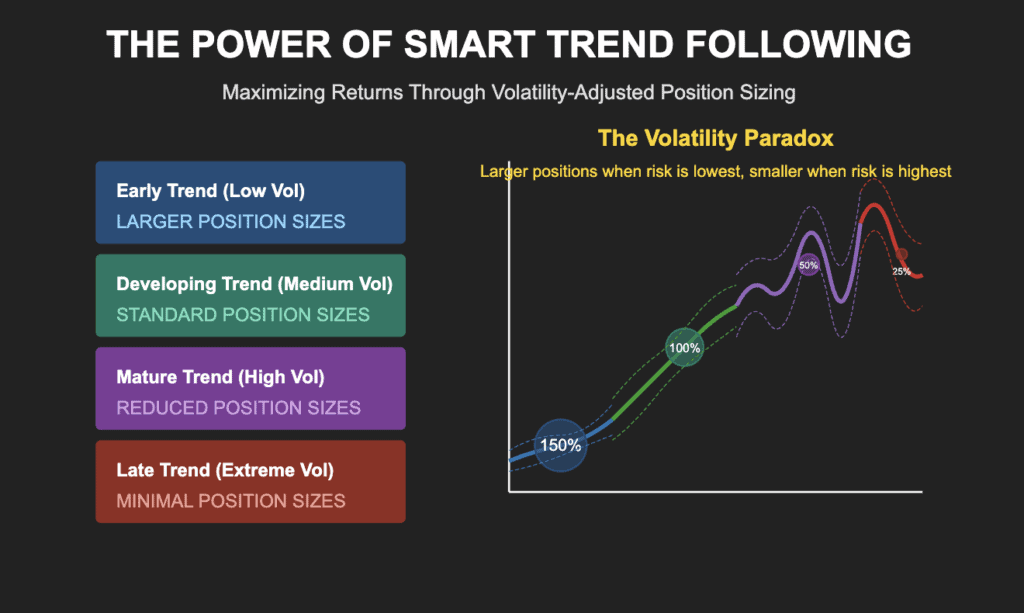
Position Sizing: The Volatility Paradox

Perhaps the most overlooked aspect of successful trend following is dynamic position sizing based on volatility regimes. This approach runs counter to conventional thinking but produces superior risk-adjusted returns.
And this is where the real opportunity lies.
Larger Positions in Lower Volatility (Early Trend)
Early in trend formation, when an asset breaks out of a consolidation pattern or begins a new directional move, volatility is typically subdued. This presents a strategic advantage for several reasons:
- Tighter stop-loss levels: Lower volatility allows for more precise risk definition
- Higher reward-to-risk ratios: Smaller stop distances relative to profit potential
- Reduced whipsaw probability: Noise-to-signal ratio decreases in low-volatility environments
- Greater capital efficiency: Permits larger position sizing while maintaining identical dollar risk
Implementation strategy: Consider allocating up to 1.5-2x your standard risk amount when Average True Range (ATR) measures are in the bottom quartile of their 6-month range and technical confirmation signals are present.
Reducing Size as Volatility Expands (Late Trend)
As trends mature and gain public recognition, several volatility-expanding phenomena typically occur:
- Price movement accelerates, with larger daily ranges
- Overnight gaps become more frequent
- Intraday reversals increase in magnitude
- News sensitivity heightens dramatically
Implementation strategy: When ATR expands to the upper half of its 6-month range, consider these step-down criteria:
- Reduce to 75% of standard position size when ATR reaches the 50th percentile
- Reduce to 50% of standard position size when ATR reaches the 75th percentile
- Reduce to 25% of standard position size when ATR reaches the 90th percentile
This counterintuitive approach—building larger early and reducing exposure as momentum appears strongest—serves two critical purposes:
- It maximizes capital deployed during the highest probability phase of the trend
- It automatically reduces exposure as market conditions become increasingly unstable
Volatility-Based Position Sizing
As volatility increases throughout a trend’s lifecycle, position size decreases exponentially while maintaining consistent risk exposure.
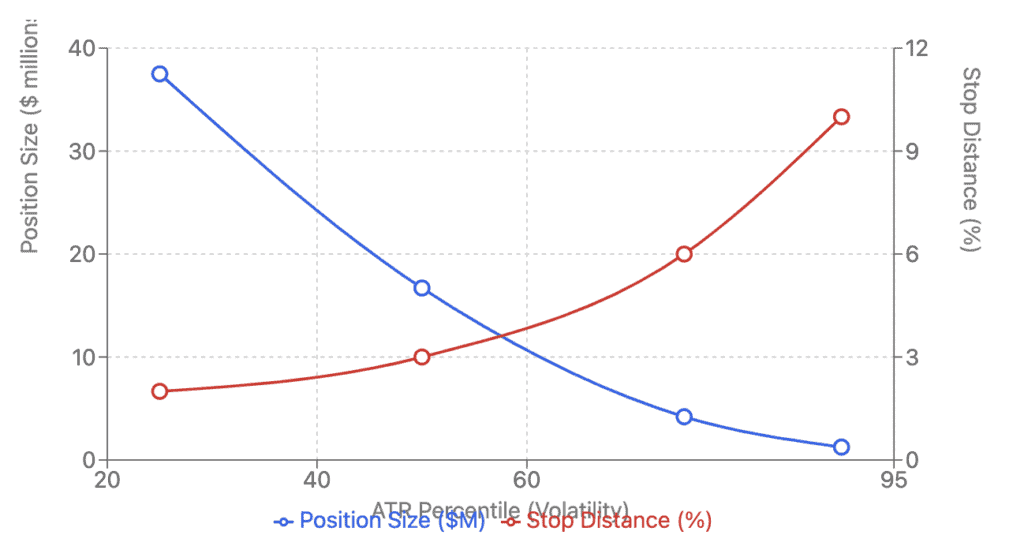
Key Insights:
- Inverse relationship: As volatility (ATR percentile) increases, position size decreases exponentially while stop distance widens proportionally.
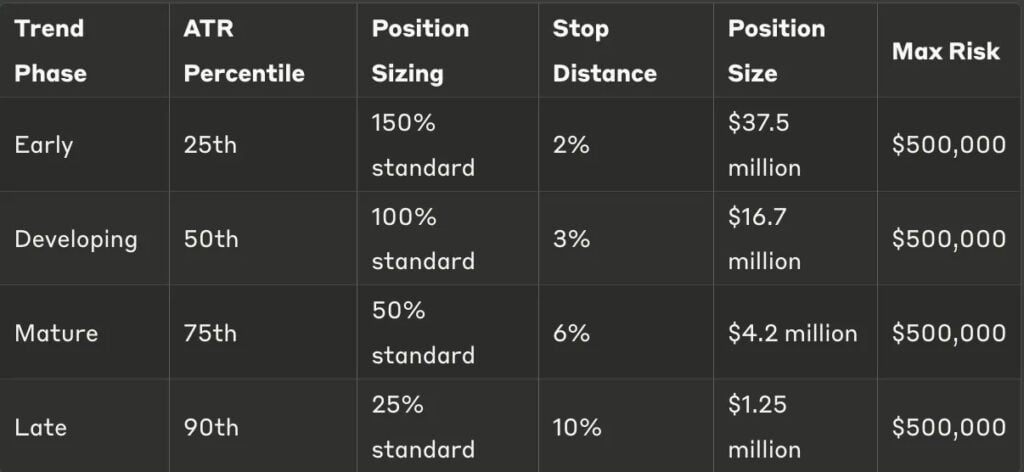
- Consistent risk exposure: Despite the dramatic reduction in position size (from $37.5M to $1.25M), the maximum risk remains constant at $500,000.
- Capital efficiency: This approach allows for deploying significantly more capital during the early, lower-volatility phases of a trend when risk/reward is most favorable.
- Risk management: As trends mature and become more volatile, exposure is automatically reduced, protecting gains and limiting drawdowns.
This approach maintains consistent dollar risk while adapting to changing market conditions. Note how position size decreases dramatically as volatility increases, allowing you to stay with the trend while prudently managing risk.
This table shows a breakdown.
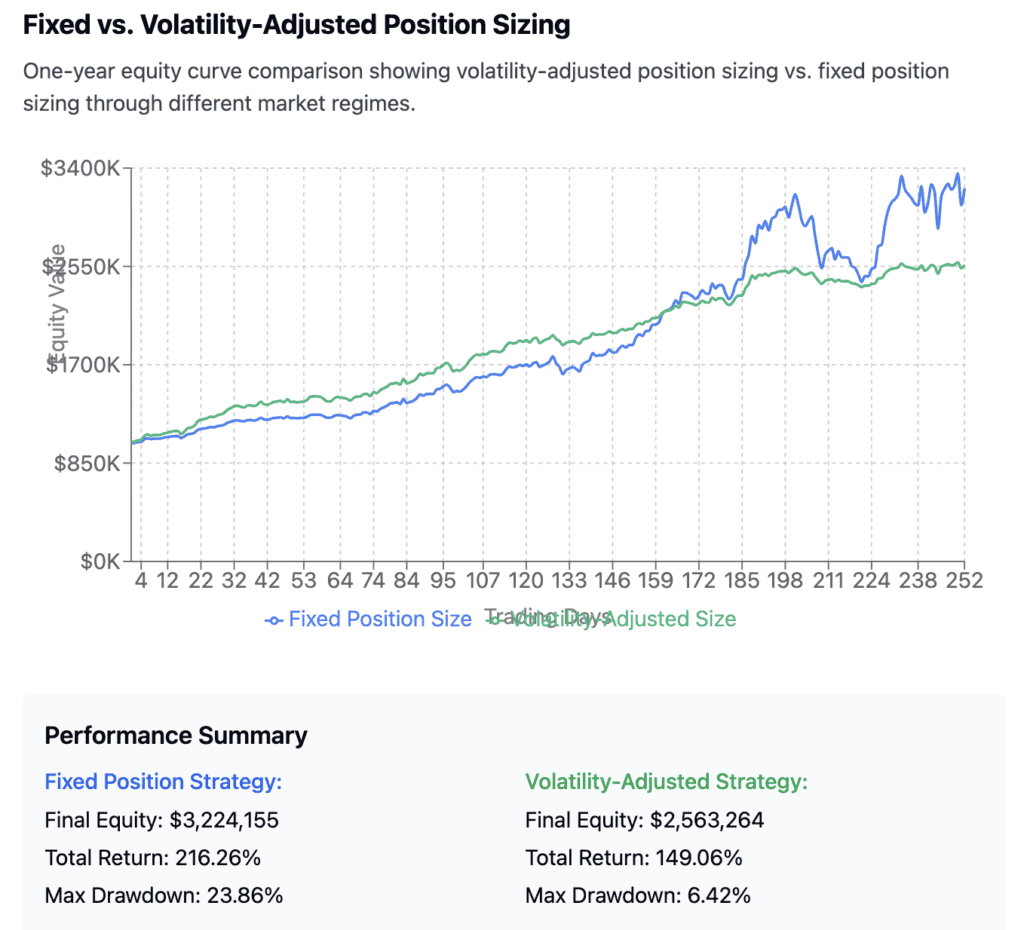
The returns for fixed size are larger, but that comes at a cost of nearly 4X the volatility.
Advanced Volatility Analysis for Position Management
Beyond simple ATR measurements, these sophisticated volatility metrics can further refine your position sizing:
- Implied vs. realized volatility spreads: When implied volatility (options pricing) significantly exceeds realized volatility, markets are often pricing in exaggerated risks
- Volatility term structure: The relationship between short and long-term volatility can signal regime changes before they appear in price
- Volatility of volatility (VVIX): Second-order volatility measurements often precede major trend inflections
- Cross-asset volatility contagion: Volatility spikes that begin in one asset class often spread to others with a lag
Monitoring these relationships provides early warning signals when market conditions are changing in ways that might impact trend persistence.
Extending Your Stay: Holding Through Volatility
The difference between good and exceptional returns often comes down to position management after entry:
- Scale your exit strategy: Rather than binary in/out decisions, plan partial exits at predetermined technical levels
- Implement trailing stops based on ATR: This accommodates increasing volatility without being shaken out prematurely
- Focus on structural rather than cyclical reversals: Distinguish between normal pullbacks and genuine trend exhaustion
- Manage positions based on correlation: Reduce size when correlation across your trend-following portfolio increases
Remember, the most significant portion of trend profits typically comes in the final third of the move—precisely when maintaining conviction becomes most difficult.
The Mathematics of Staying Power
Consider the statistical profile of trend-following returns across various holding periods:
Trend Following Returns by Holding Period
Win rate decreases with longer holding periods, but expected returns increase due to larger average wins
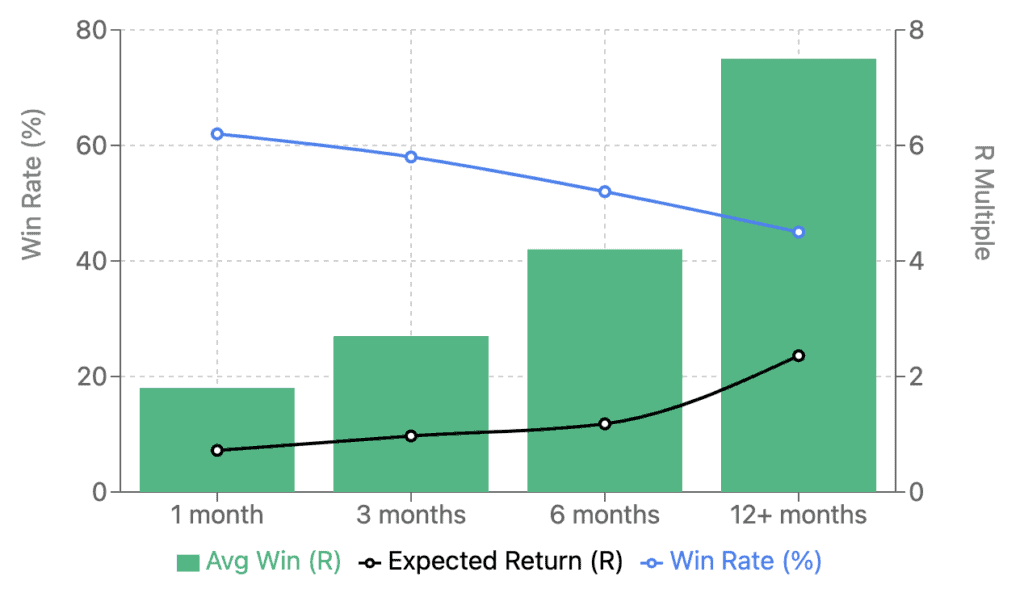
Key Insight: The Holding Period Paradox
While win rates decline with longer holding periods (62% → 45%), the expected return increases significantly (0.72R → 2.36R). This occurs because:
- Average winning trades grow substantially larger with time (1.8R → 7.5R)
- Average losing trades remain constant at -1R across all time frames
- The asymmetric payoff profile becomes more pronounced with longer holding periods
- This data supports the trading wisdom: “Cut losses short and let winners run”
When to Avoid Trend Following
Even the most disciplined trend followers recognize environments where this strategy underperforms:
- Range-bound markets with clearly defined resistance/support: These produce whipsaws that erode capital
- Extremely low volatility environments: Insufficient price movement to generate meaningful returns
- When positioning becomes one-sided: COT reports and sentiment indicators flashing extreme readings
- During major liquidity events: When correlations approach 1.0 and normal market mechanics break down
In these environments, consider rotating capital to mean-reversion strategies or reducing overall exposure until more favorable conditions emerge.
Recognizing Unfavorable Trend Environments
Several macroeconomic and market structure indicators can help identify periods when trend following is likely to underperform:
- Central bank policy shifts: Particularly transitions from easing to tightening cycles
- Compressed risk premia across asset classes: When everything becomes expensive simultaneously
- Declining market breadth: When fewer and fewer securities participate in market advances
- Flattening yield curves: Often precedes periods of market choppiness and reduced directionality
- Breakdown in historical correlations: When established intermarket relationships temporarily malfunction
During these periods, consider these alternative approaches:
- Shift from directional trend following to relative value trades
- Reduce leverage and position sizing by 30-50%
- Increase hedging component of the portfolio
- Focus on shorter-term mean reversion opportunities
- Emphasize fundamental value over momentum characteristics
Trend Following Across Different Asset Classes
The trend following principles apply universally, but implementation varies significantly across markets.
Here’s some of my own insights when trading the different asset classes:
Currencies
- Mean Reversion Strategies work well
- Focus on interest rate differentials and central bank policy divergence
- Monitor positioning data from COT reports
- Beware of intervention risk from central banks and treasuries
- Pay special attention to commodity currency relationships
Fixed Income
- Trends tend to be longer-lasting but less dramatic than other asset classes
- Focus on yield curve shape rather than absolute yield levels
- Monitor inflation expectations as a leading indicator
- Pay attention to auction demand metrics as institutional sentiment indicators
Commodities
- Supply-driven trends tend to last longer than demand-driven trends
- Seasonal patterns provide additional confirmation signals
- Inventory levels often provide early trend reversal warnings
- Backwardation/contango shifts often precede trend changes
Equities
- Sector rotation often provides early warning of broader market trends
- Earnings momentum tends to lead price momentum
- Factor exposures (value, quality, growth) rotate in predictable sequences
- Single stock trends are less reliable than industry or sector trends
Adapting your trend approach to the specific characteristics of each asset class significantly improves performance consistency.
Putting It All Together: The Integrated Framework
The most successful global macro investors integrate trend following within a broader framework that includes fundamental analysis, risk management, and position sizing. Rather than viewing trend following as a standalone strategy, consider it a lens through which to view potential opportunities.
A comprehensive trend-following system includes:
- Identification: Multi-timeframe technical confirmation combined with fundamental catalysts
- Entry execution: Scaling into positions at optimal volatility regimes
- Position sizing: Dynamic allocation based on volatility metrics
- Risk management: Trailing stops that expand and contract with volatility
- Exit criteria: Predetermined technical and fundamental conditions that signal trend exhaustion
By systematizing each component, you eliminate the emotional biases that typically undermine performance.
In the Sunday Setup you’ll see how I use this framework with current macroeconomic conditions targeting emerging trends across indices, rates, commodity markets and specific currency pairs that may offer exceptional asymmetric opportunities.
If you are interested in the strategies that I use.
Swing Beast Momentum System
Curvy Mean Reversion System
Crypto Momentum System
And you can work with me on building out your trading business in the Trading Thunderdome
Until then, stay disciplined.