“Recently, I was at a money manager roundtable dinner where everyone was talking about “my stock this” and “my stock that”. Their attitude was that it doesn’t matter what is going to happen in the world because their favorite stock is generating free cash flow, buying back shares, and doing XYZ. People always forget that 50% of a stock’s move is the overall market, 30% is the industry group, and then maybe 20% is the extra alpha from stock picking. And stock picking is full of macro bets. When an equity guy is playing airlines, he’s making an embedded macro call on oil.” ~ Scott Bessent
Good morning!
In this week’s Dirty Dozen [CHART PACK] we look at major chart pattern failures, another rare breadth signal, relative sector outlook, the latest energy survey news, a turn in the macrocycle, and some great material plays, plus more…
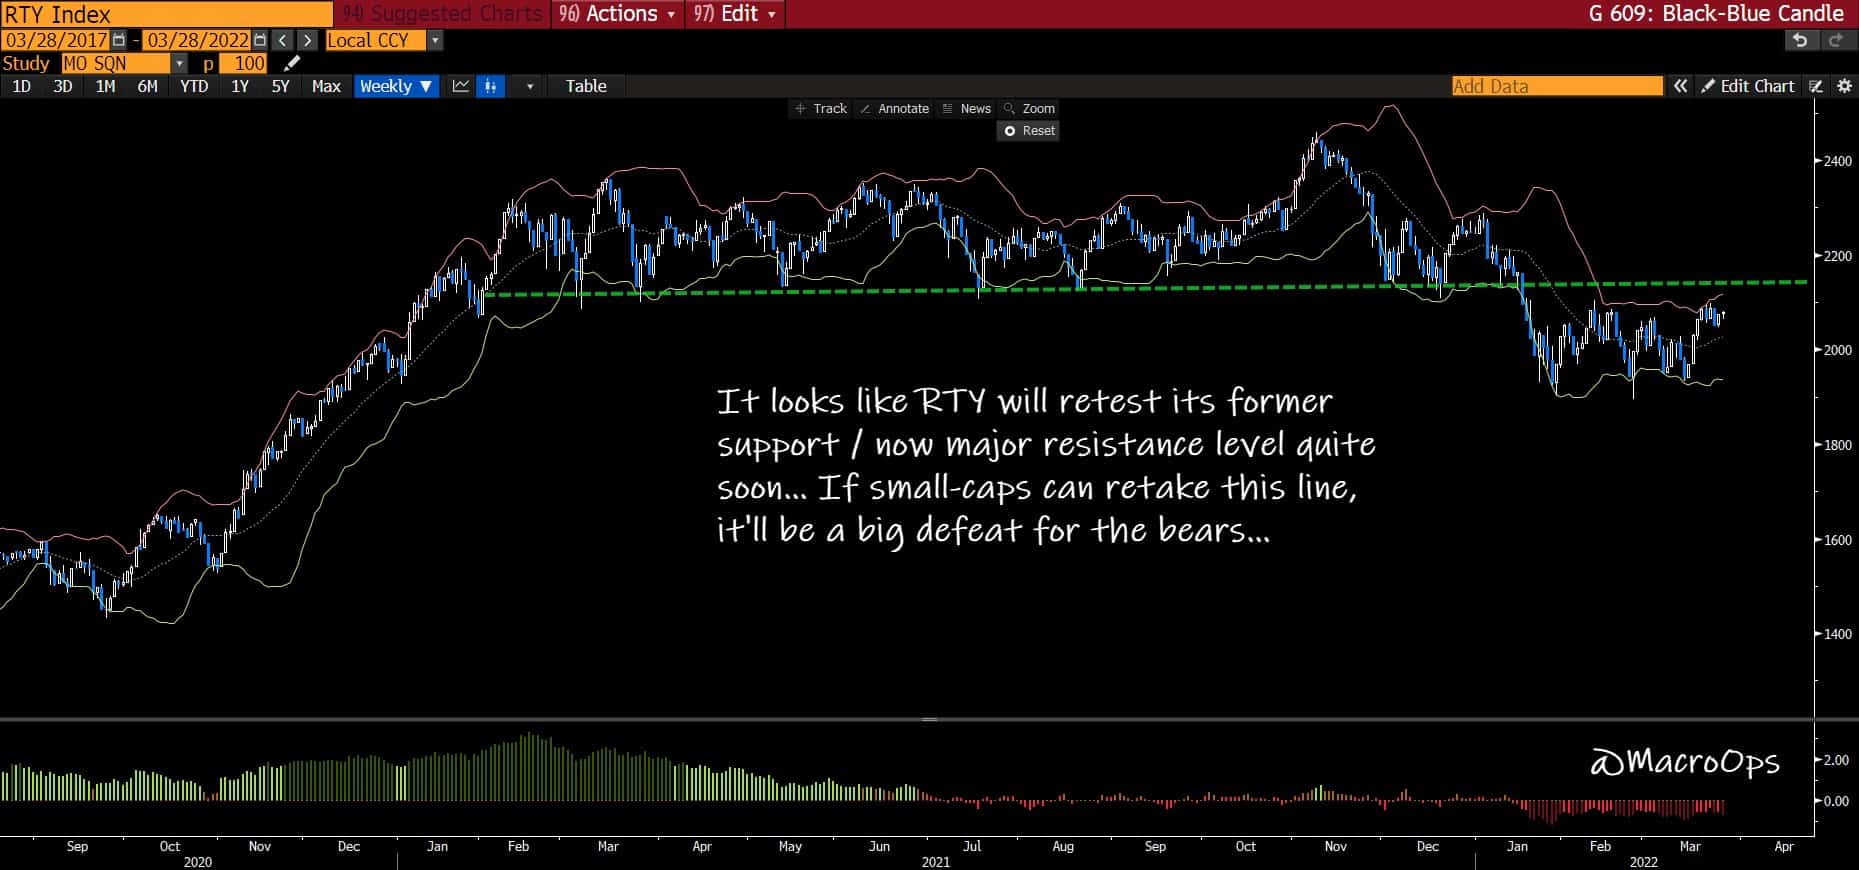
- The SPX put in a big weekly H&S Top failure recently and now small-caps look like they’ll retake their former bearish breakdown level soon. Chart pattern failure is a valuable signal in and of itself. Also, with just four days left in March and large lower wicks on the major indices’ monthly charts, the bears need to put in some work this week, or else this round goes clearly to the bulls….
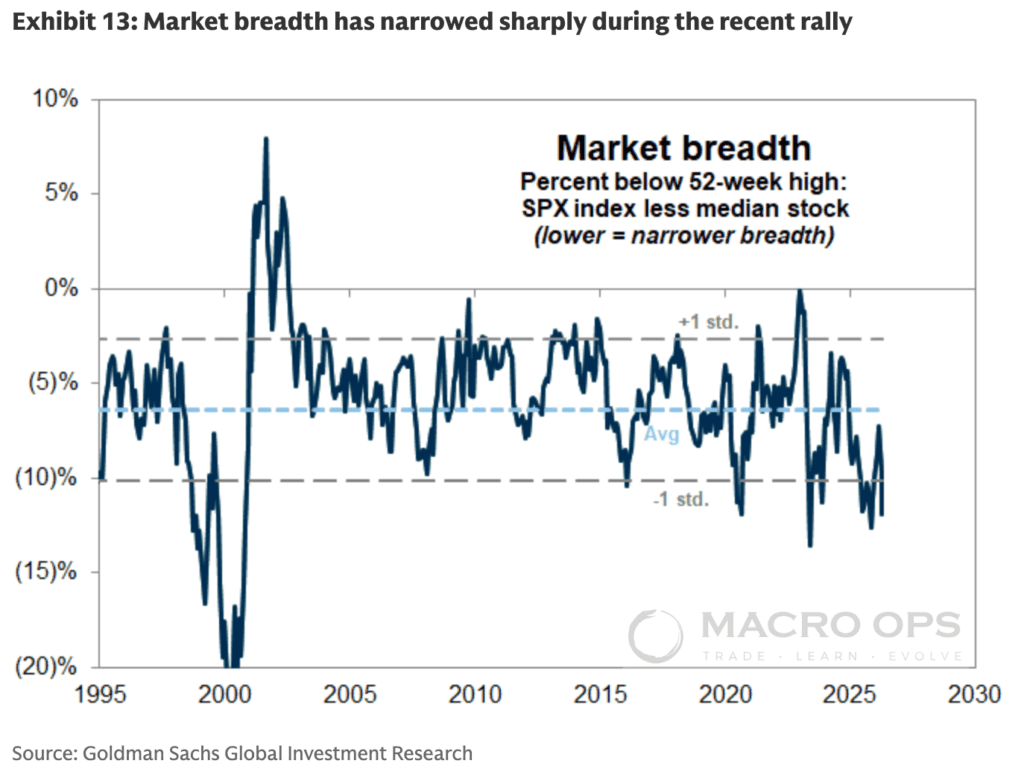
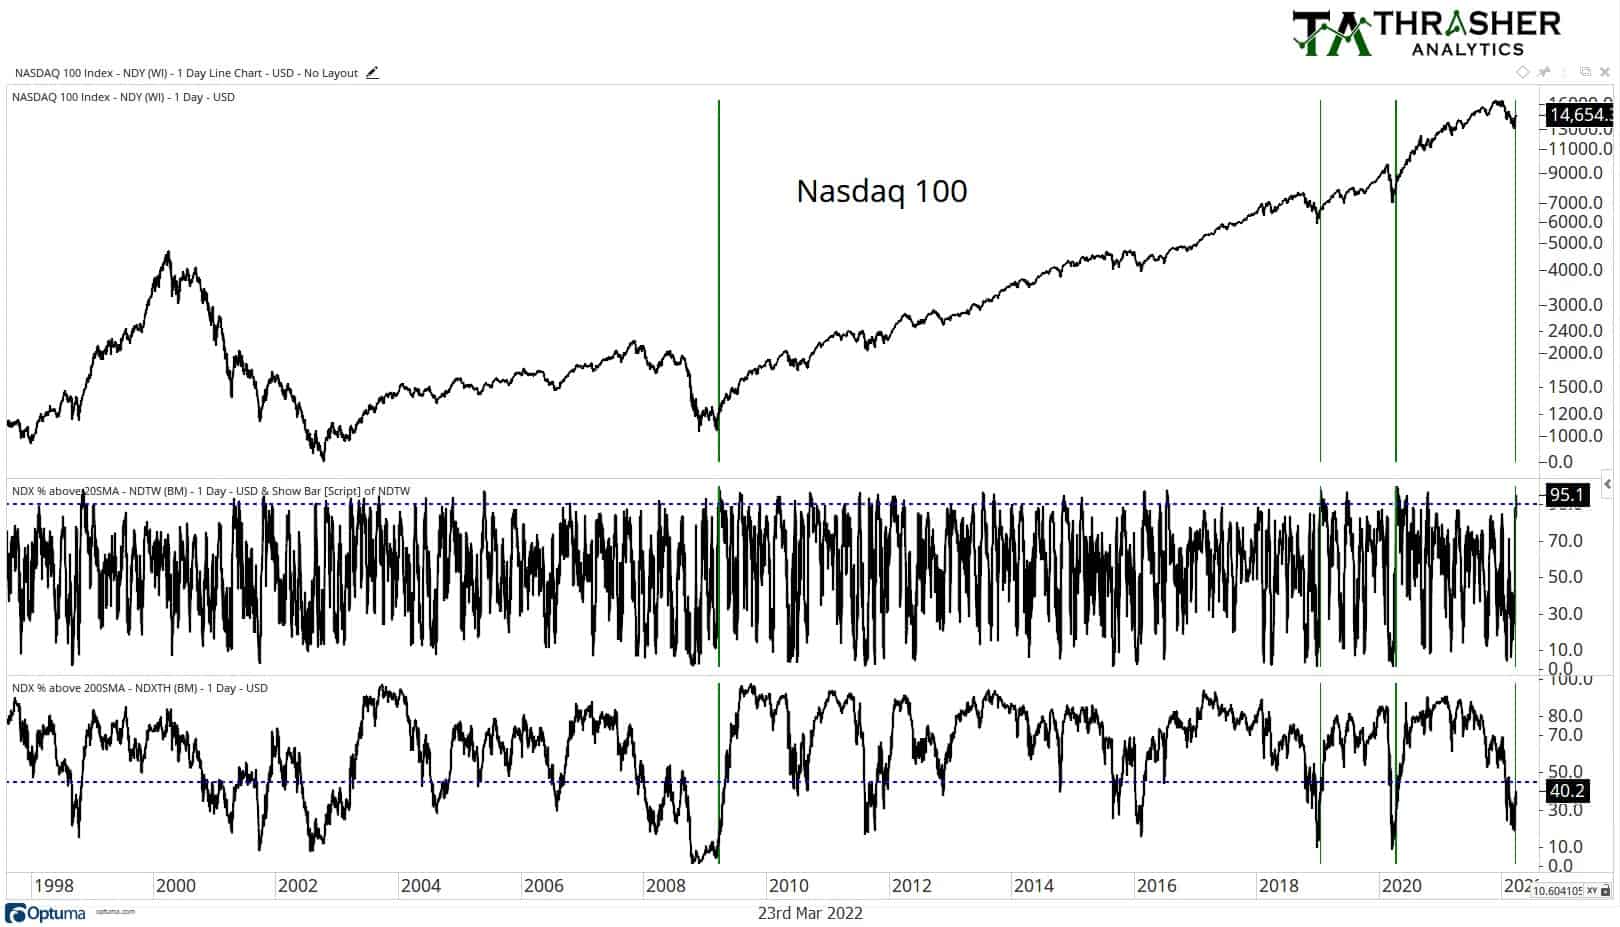
- @AndrewThrasher, who’s a good follow on the twitters, shared this interesting chart and data point last week:
More than 95% of Nasdaq 100 stocks have regained their 20-day moving average with less than 45% of stocks above the 200-day MA.
This is just the 4th time short-term breadth has been this strong while long-term breadth has been this weak.
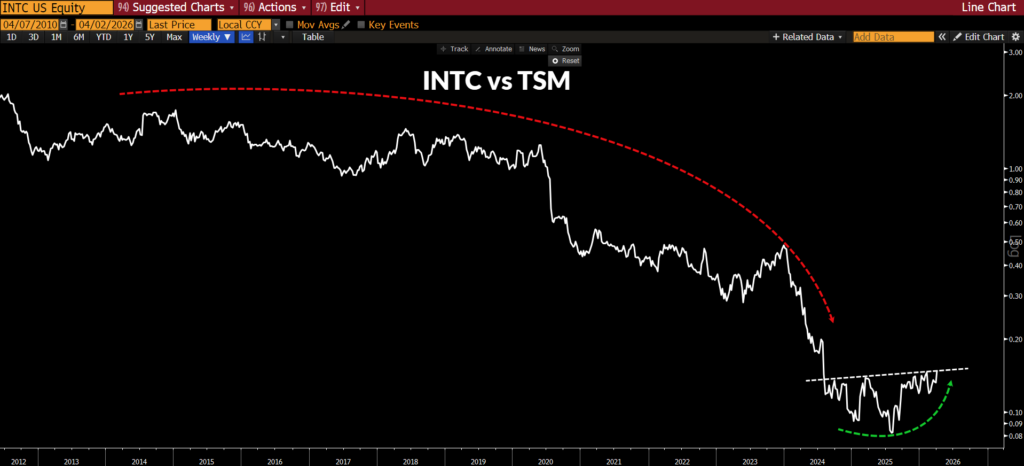
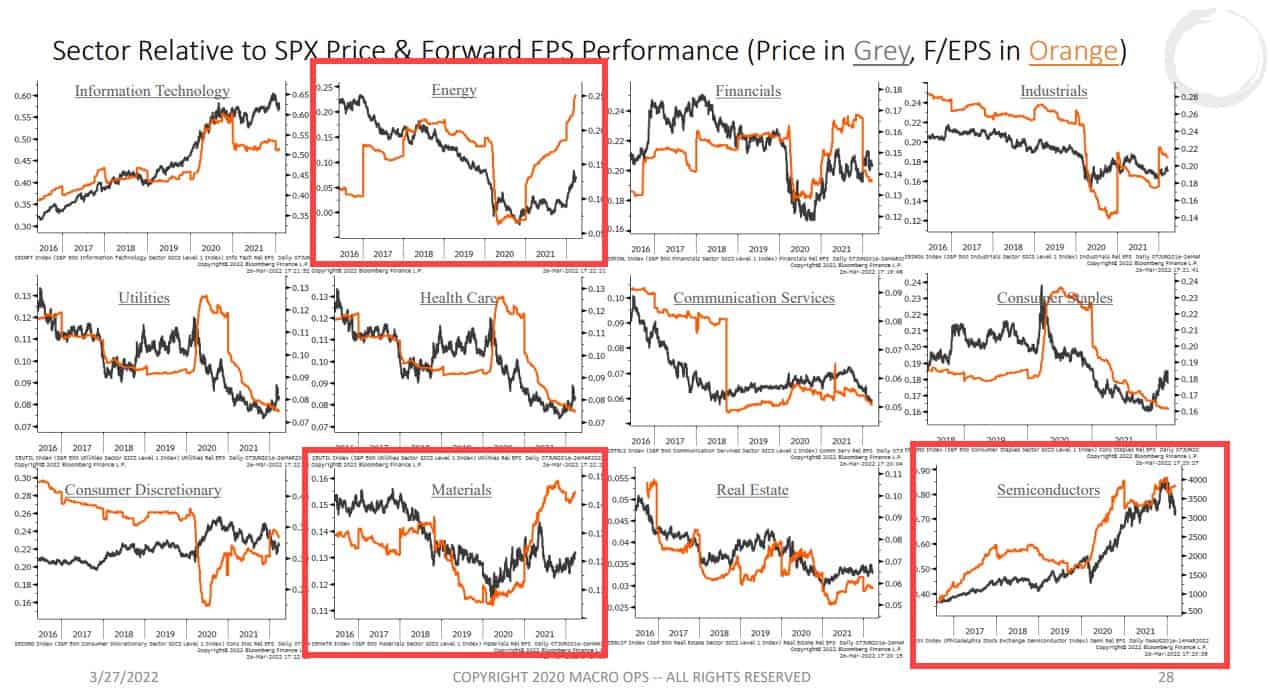
- Here’s the sector vs SPX relative price and Forward EPS trends. Energy and materials continue to show the most promise, while semis are still pointing higher.
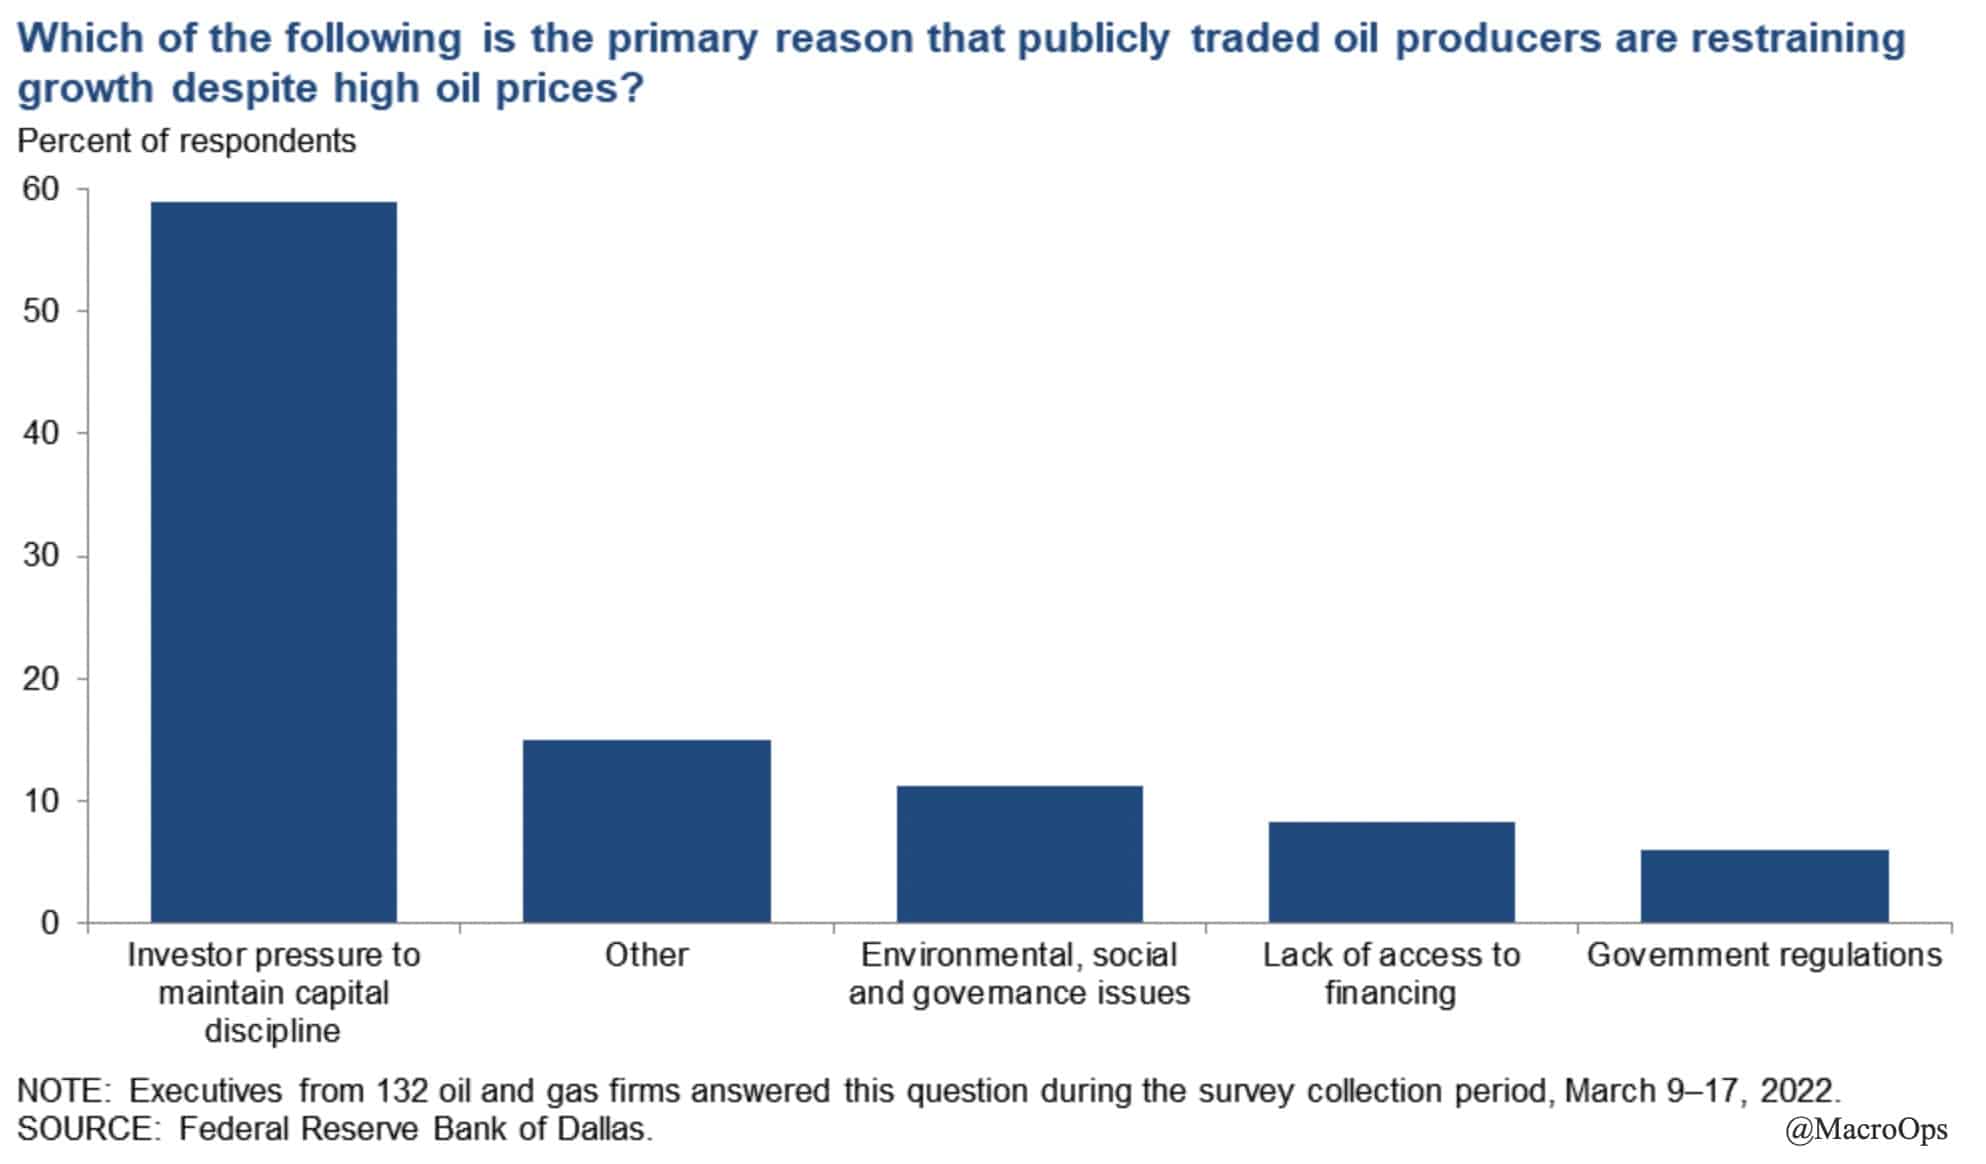
- The Federal Reserve Bank of Dallas published their Energy Survey last week, which included some interesting charts (link here). I’m no fan of the virtue-signaling-for-fee-generation ESG movement, but it receives too much of the blame for low US production. The truth is that shale set fire to nearly half-a-trillion dollars of capital last cycle and now investors understandably don’t want to fund a round two.
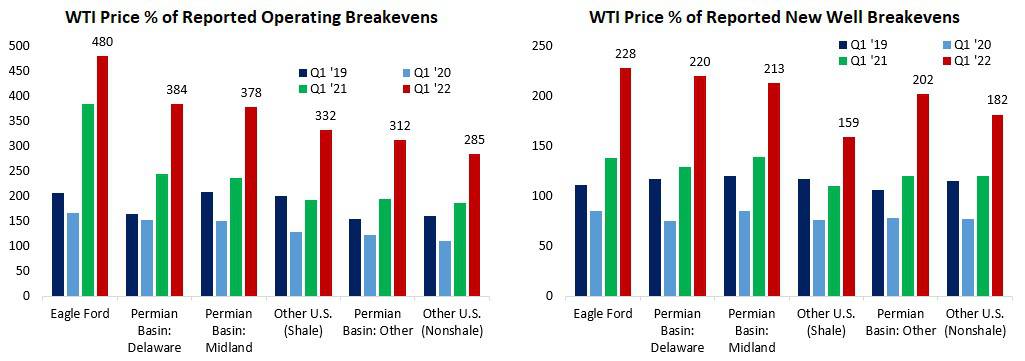
- Greater capital discipline is a standard part of the Capital Cycle. This is helping to keep supply low and prices high, which means massive FCF generation for shale producers at the moment. Check out the price percent above current breakeven rates.
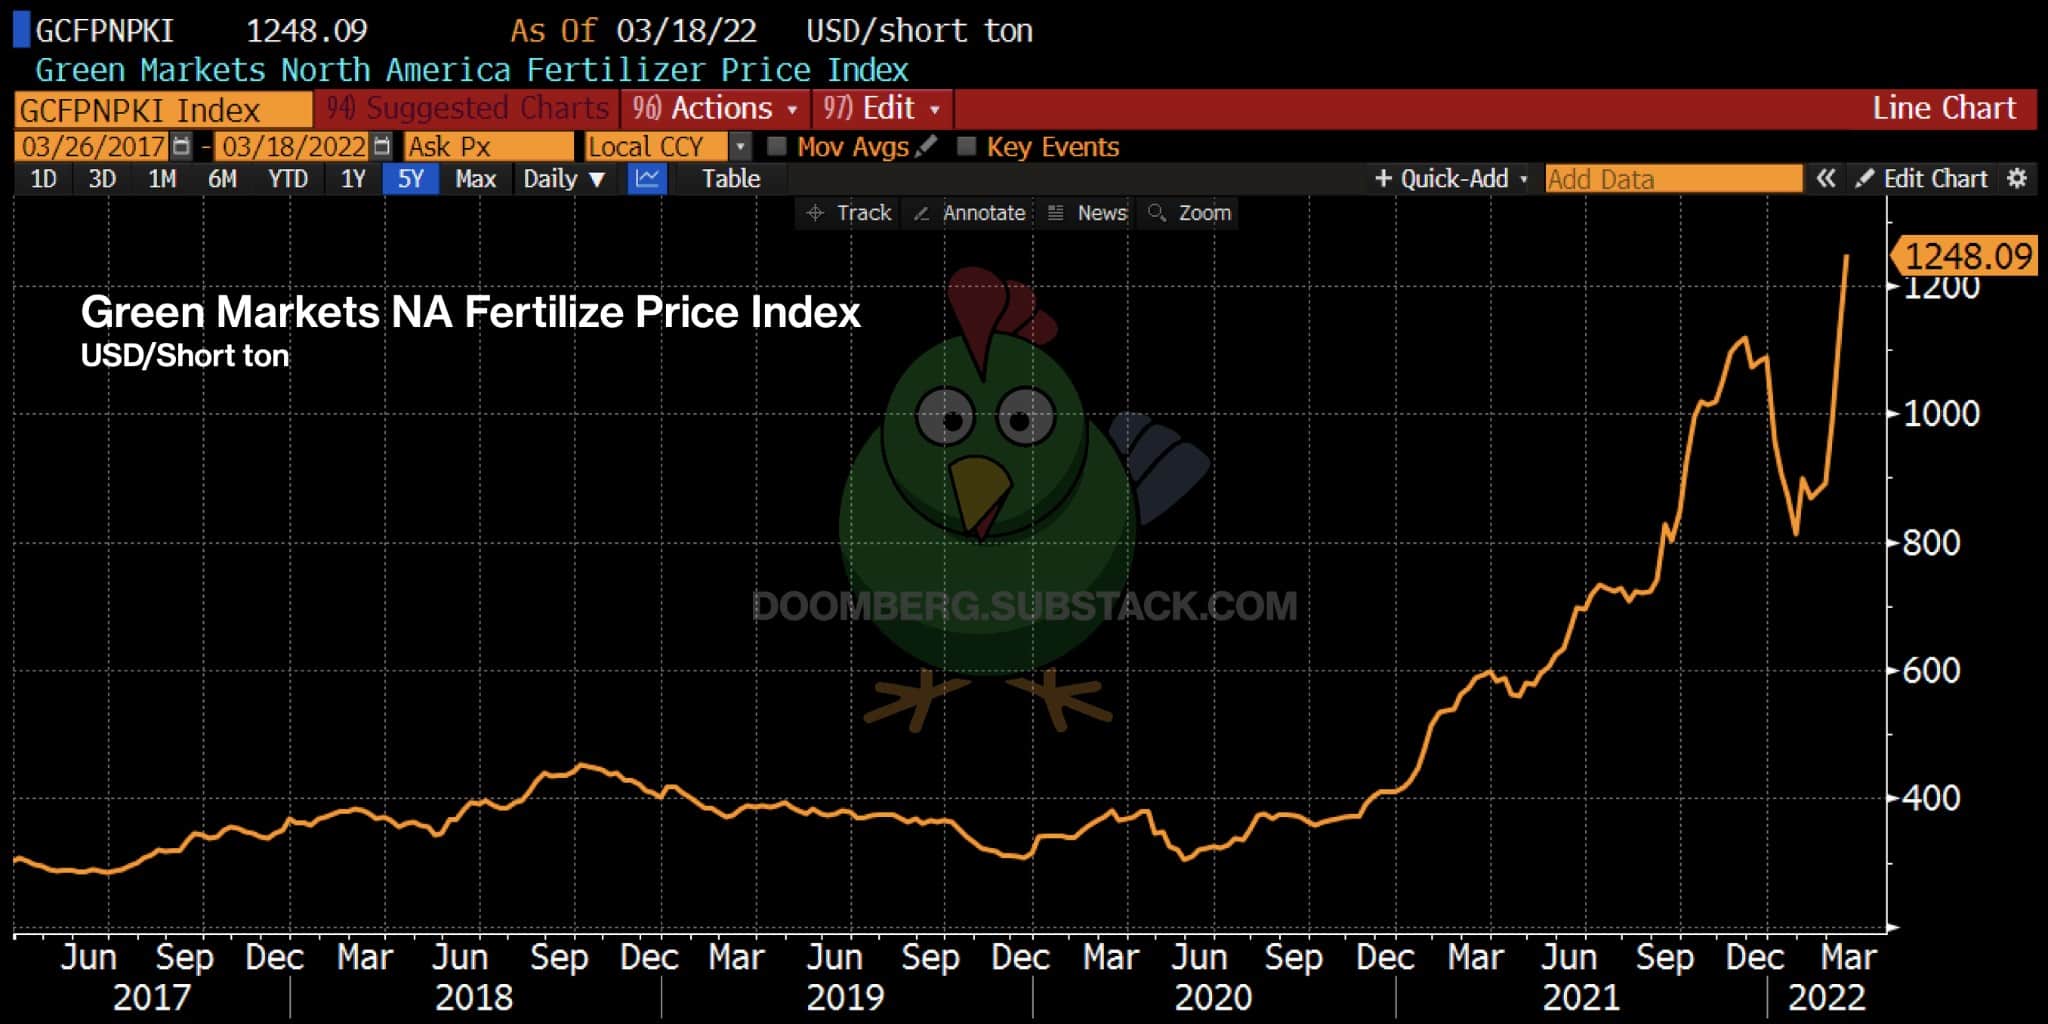
- We’ve been very active in Ags as they continue to be a great trading market. The green chicken Doomberg published a good post detailing why the current trends in Ags may soon go parabolic. It’s definitely worth your time (link here).
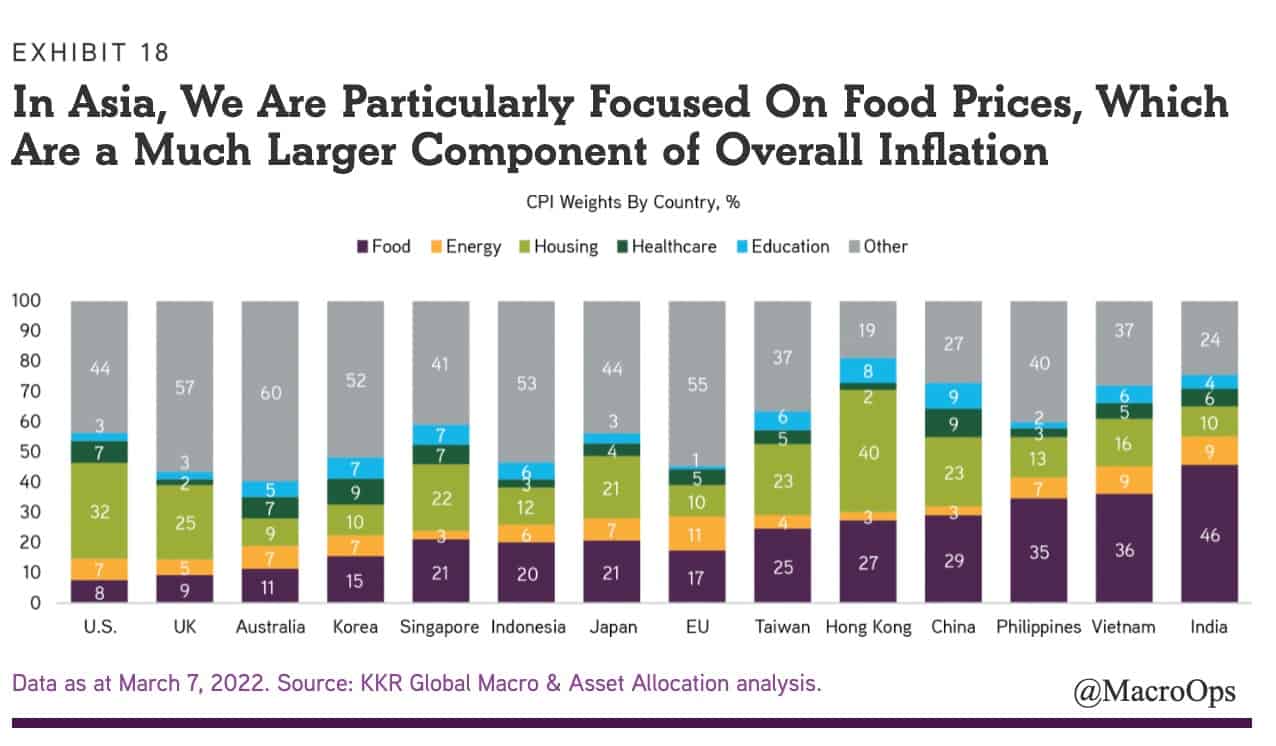
- Long producers, short the importers is a good macro mantra right now whether you’re looking at FX, equities, or EM bonds… If food prices continue to rise, a number of import-dependent countries are going to get squeezed. This chart from KKR shows those most exposed to food inflation are in Asia.
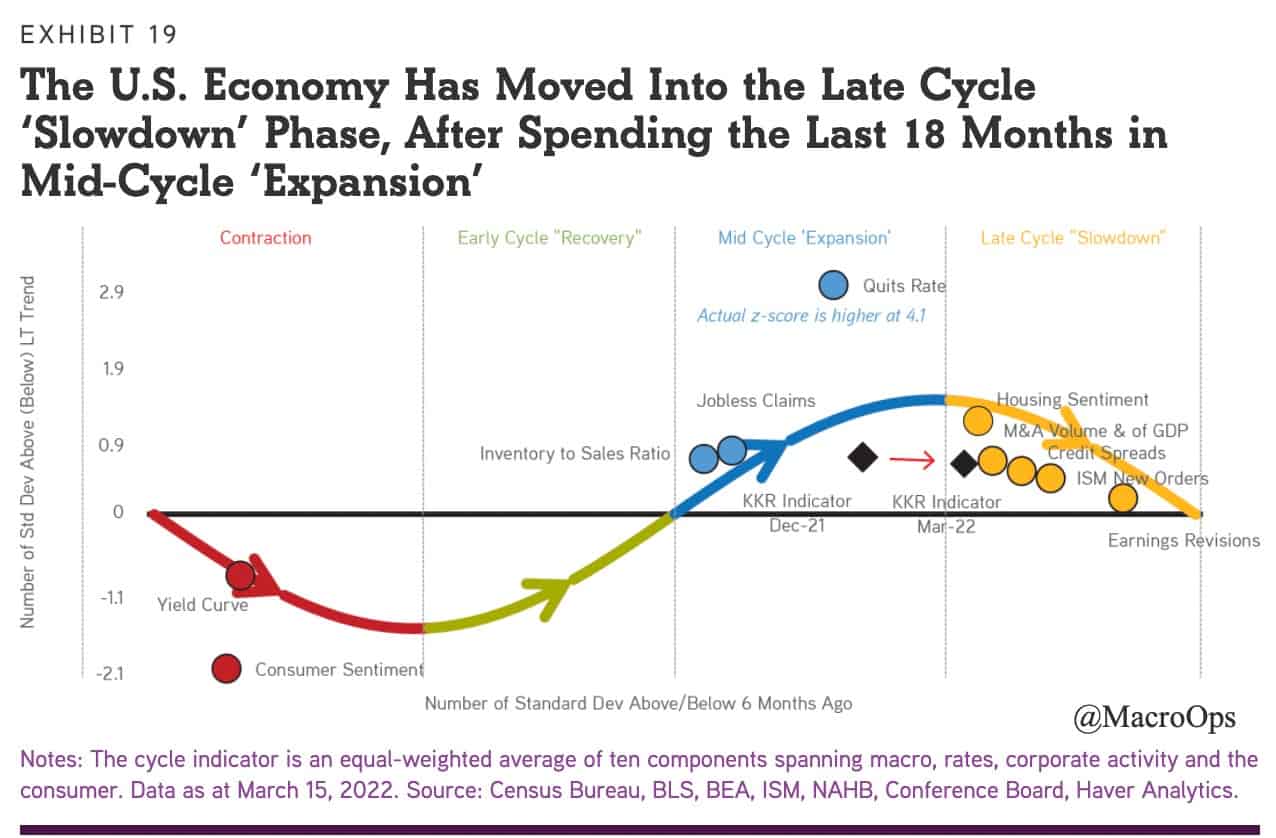
- In that same report from KKR (link here) they share an update of their Macro Cycle model, which indicates the US economy recently shifted into a Late Cycle slowdown. This jives with our Growth Composite model and isn’t a great look for equities as they average just 1.3% annually in this regime.
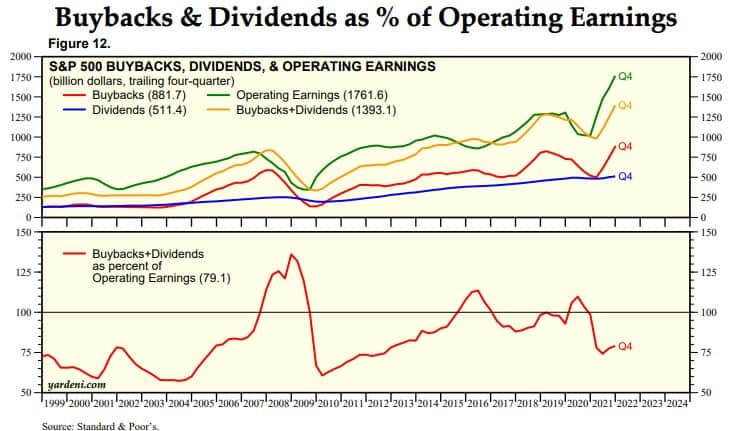
- The counterpoint to that is US companies remain flush with cash and margins have so far held up, which means there’s plenty of room for them to keep buying back shares, helping to put a bid under the market.
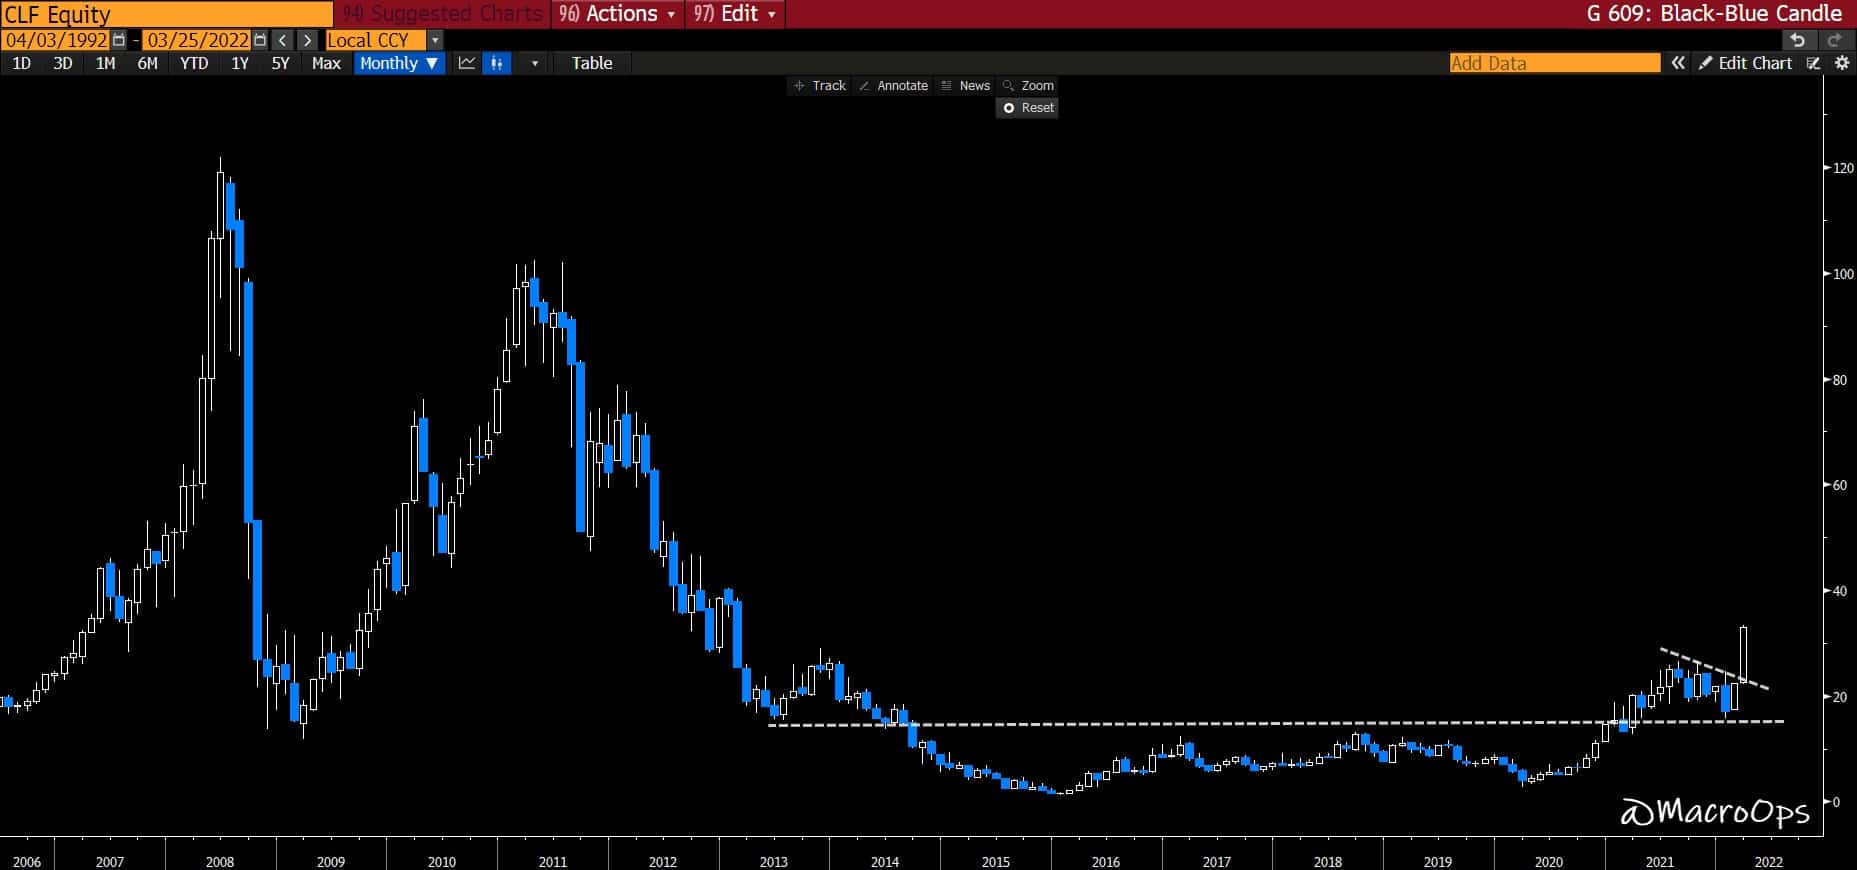
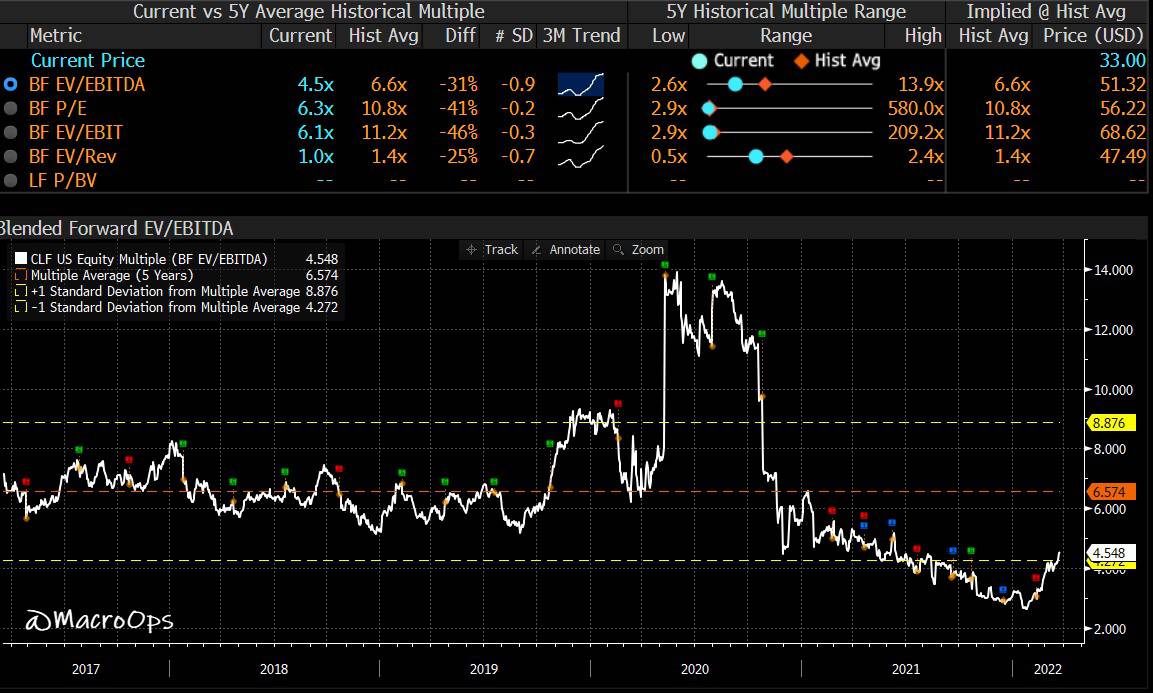
- US steel producer Cleveland-Cliff Resources, Inc (CLF) just broke out to 9-year highs. Planned CAPEX in the US is at decade highs, which is obviously good for materials. And despite a strong rise in its stock price, CLF still trades near 5-year Foward EV/EBITDA multiple lows.
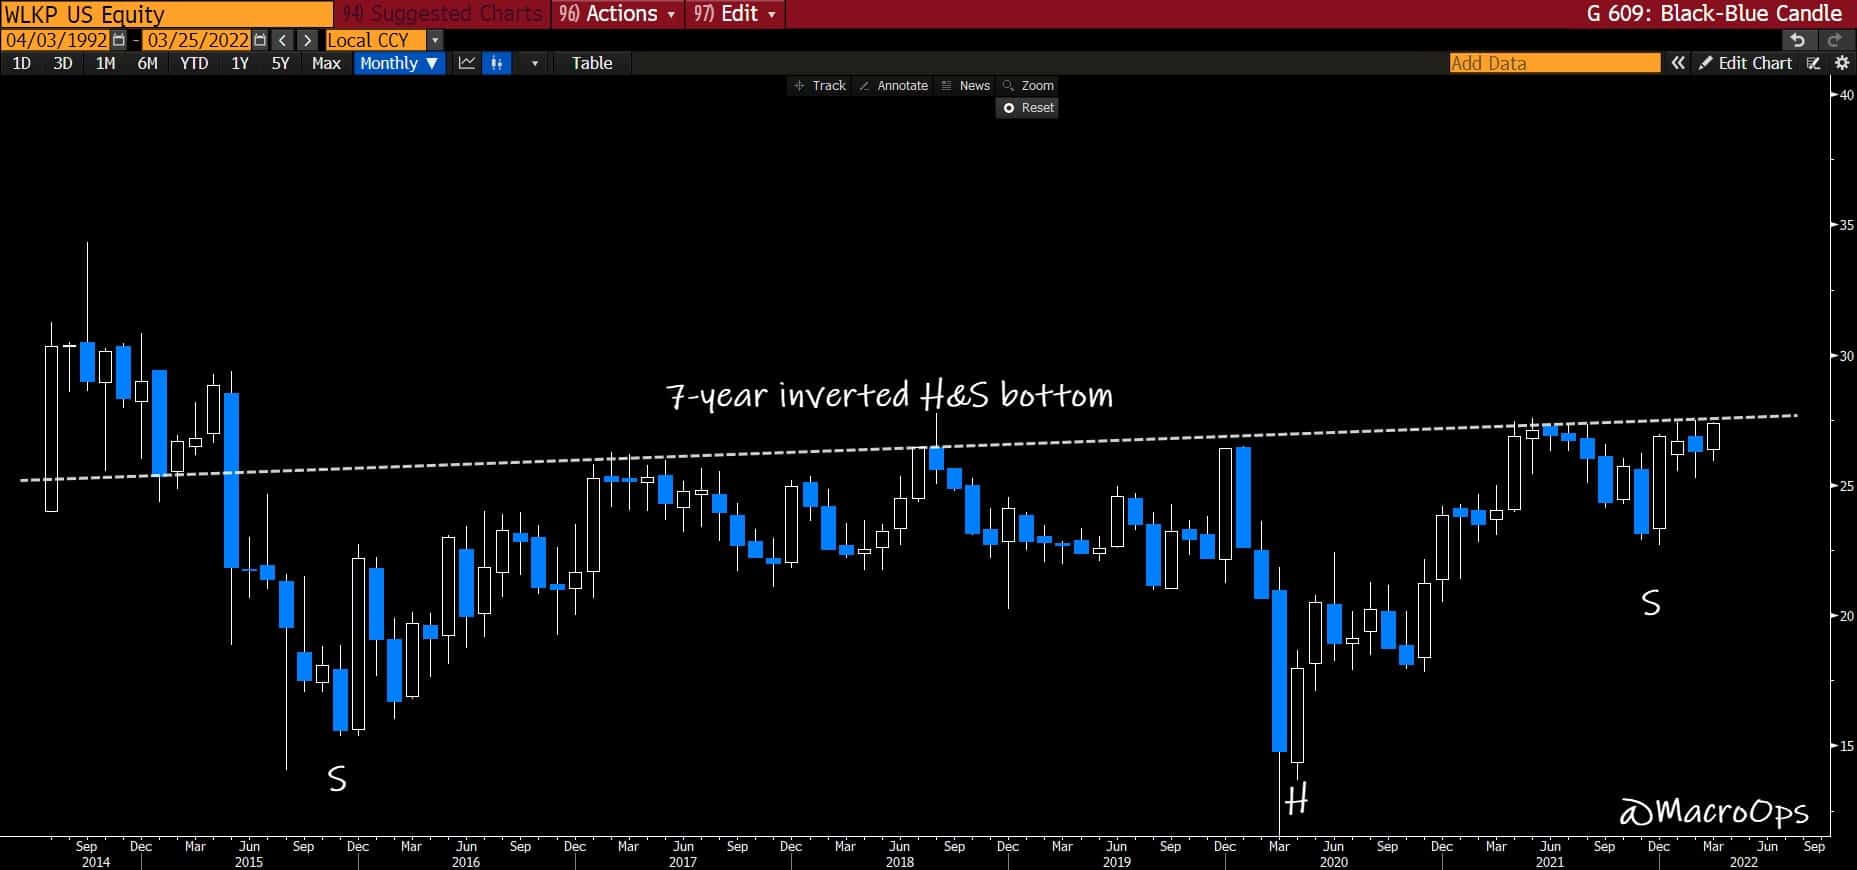
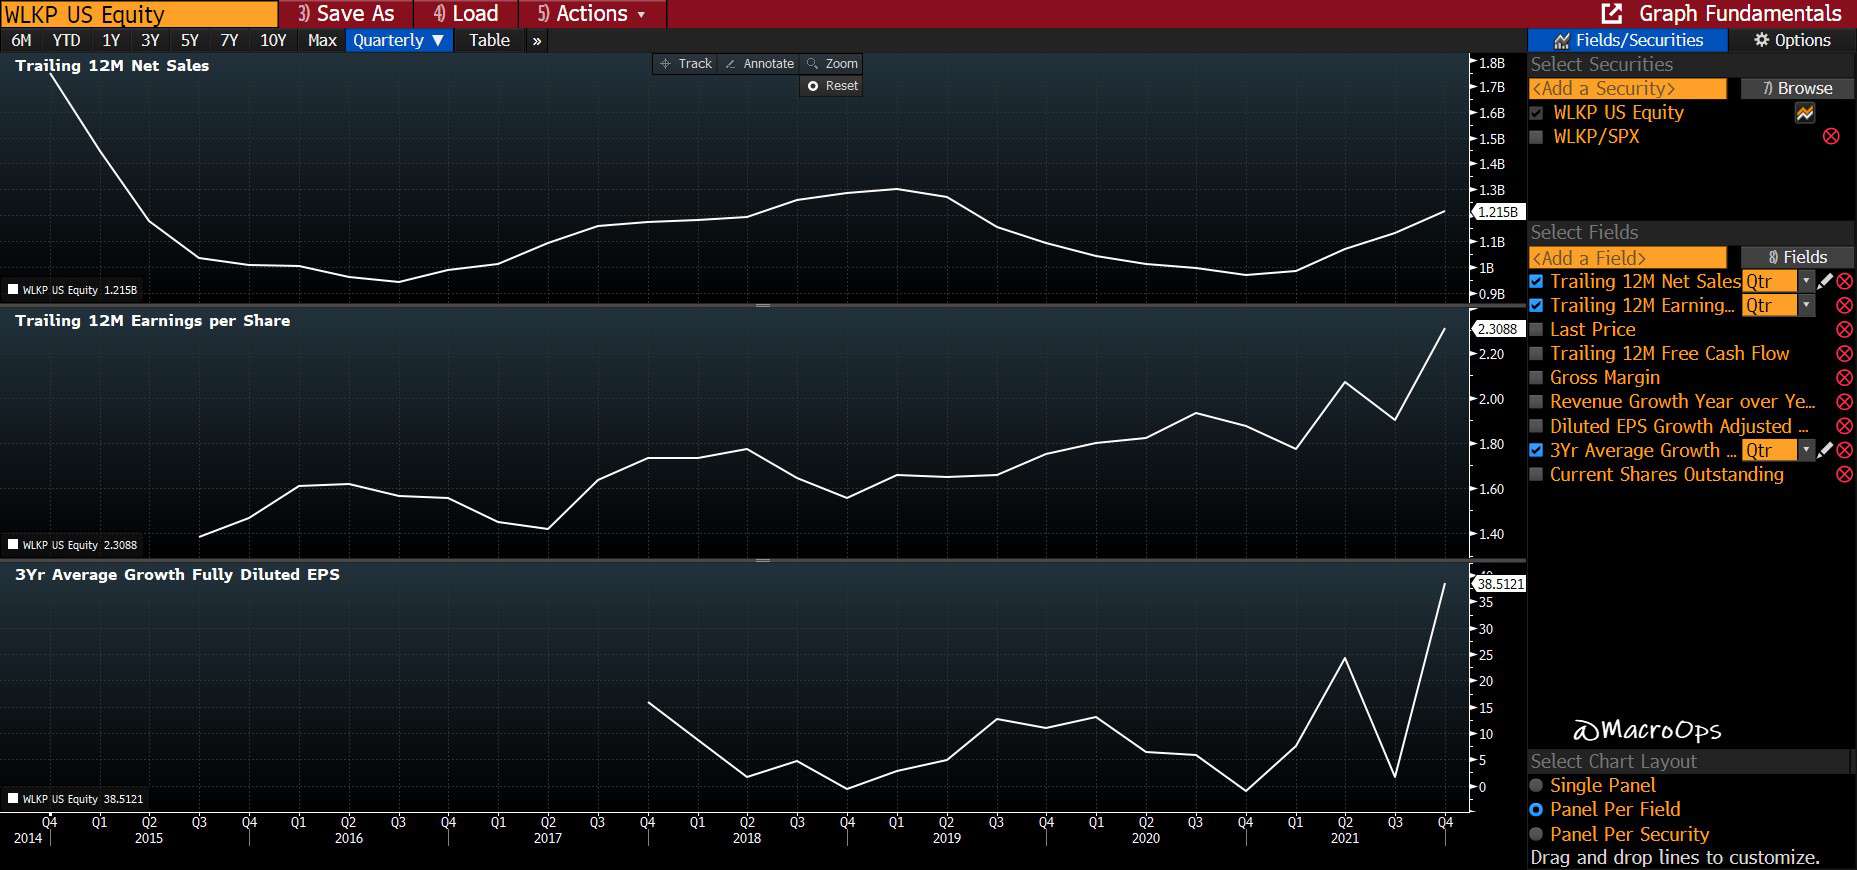
- Here’s another material play with a great chart, Westlake Chemical Partners (WLKP). WLKP operates ethylene production facilities and related assets in the United States. Ethylene is a critical input in just about everything. WLKP trades at 3.6x FCF and its fundies are all moving up and to the right (second chart).
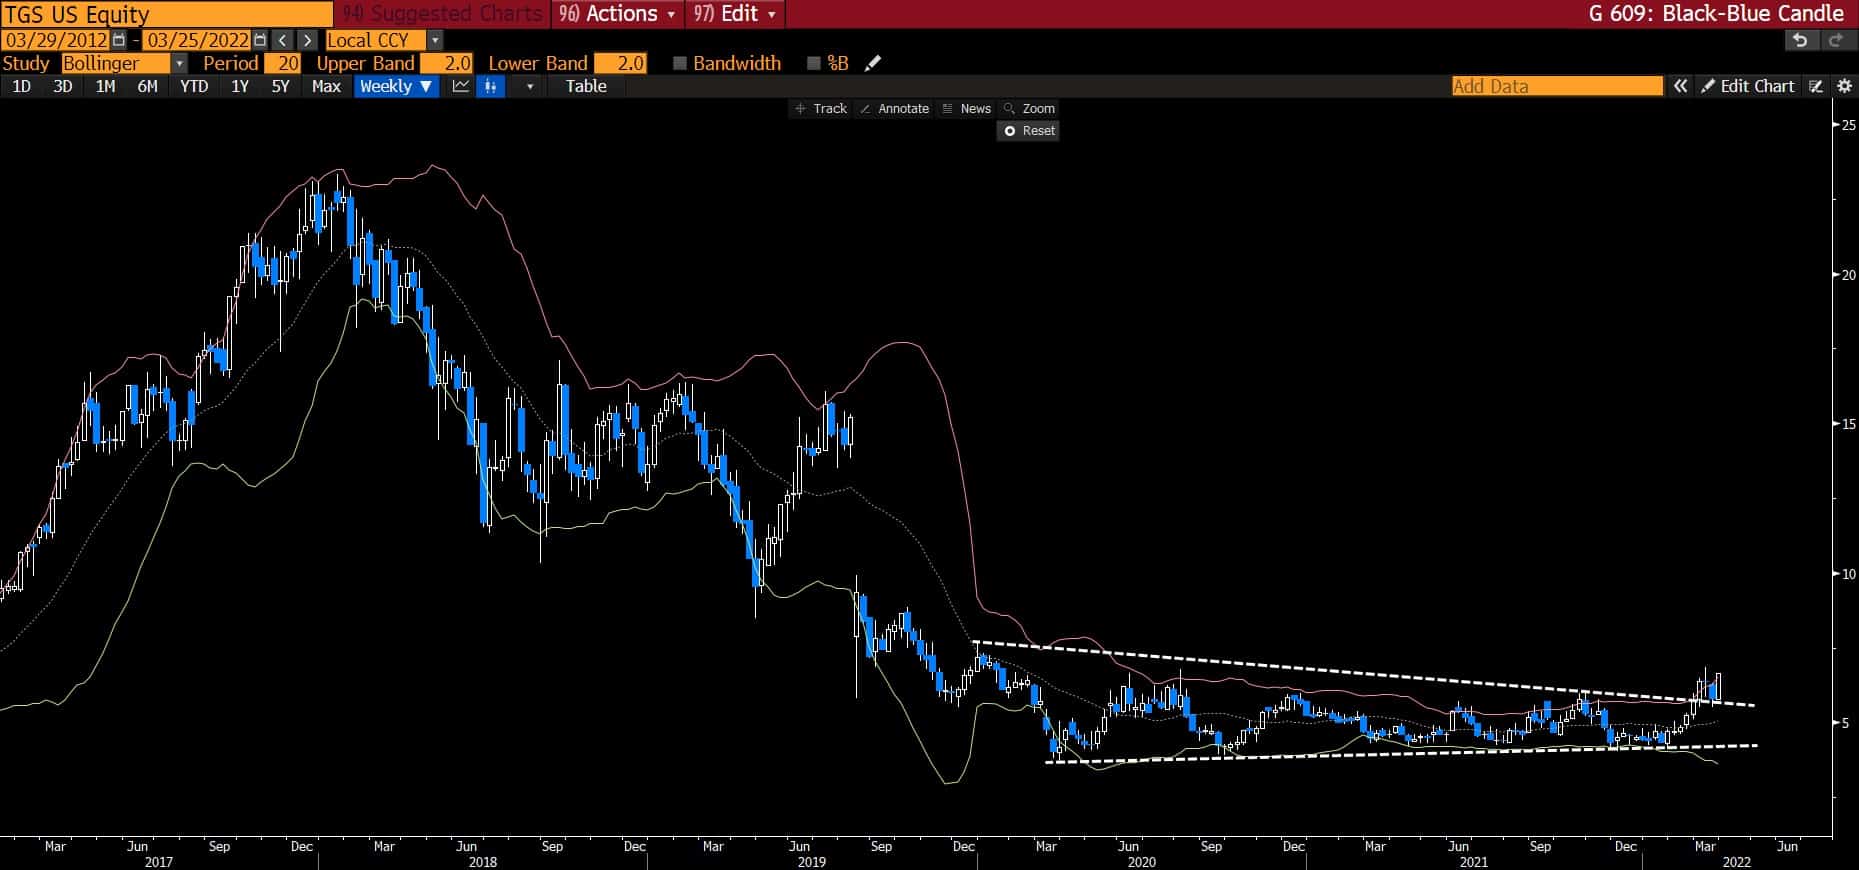
- Transportadora de Gas del Sur S.A. (TGS) provides natural gas transportation and distribution services in Argentina. Honestly, I haven’t looked at this company yet. It’s in Argentina so it’s probably a perennial loser. But… the long-term chart is *chef’s kiss* so I just had to share it.
Thanks for reading.
Stay frosty and keep your head on a swivel.