The self is the friend of a man who masters himself through the self, but for a man without self-mastery, the self is like an enemy at war. ~ The Bhagavad Gita
In this week’s return of the Dirty Dozen [CHART PACK] we look at the SPX in breakout mode, discuss the positive attributes of this particular breakout, and check out the midcaps which has one of the better charts for playing this move to the long side. We then cover fast-rising wages, bears buying stocks, USDJPY making moves, and breakouts in both a semi and tech name, plus more…
***click charts to enlarge***
- The S&P formed an outside bar for the month of October. This completes an i-o-o pattern, which means the SPX is in breakout mode and we should see higher prices this month.

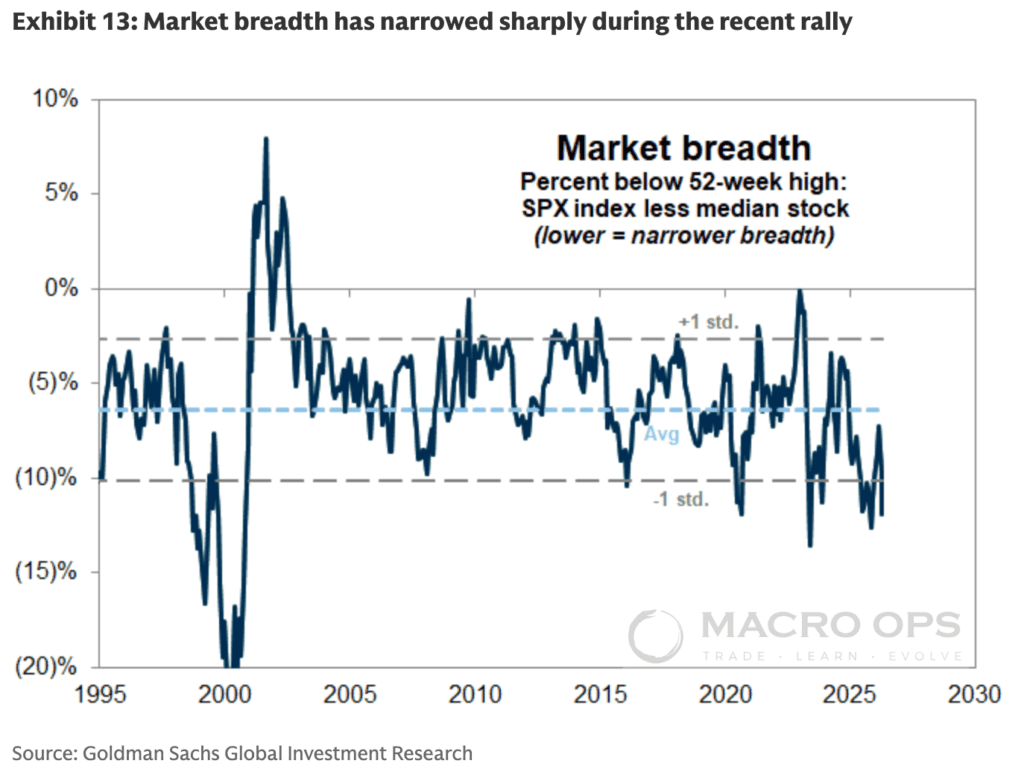
- SentimenTrader points out that this breakout coincides with a new high in the cumulative A/D Line, meaning strong breadth is behind this move.

- They share why this matters, writing “we can see that since 1928, the S&P 500 was three times more likely to suffer a 10% decline at some point within the next three months if the S&P’s Advance/Decline Line was not at a multi-year high. When it did break out to a new high, as it did on Friday, there was only a 4.6% probability of a 10% or greater decline within the next few months and less than a 2% chance of a 20% decline.”

- The midcaps have one of the better-looking charts of the bunch. They’ve broken out to the upside of their 8-month range. A string of consecutive bull bars and sell setup failure at the midline shows that the bulls are clearly in control. This is classic Bull Quiet regime trading action so buy breakouts and pullback reversals…

- The recent NAAIM survey is interesting in that it shows that even those who are most skeptical (bearish) on the market are throwing in the towel and buying stocks. The bears are now 65% invested in stocks compared to their average positioning of net 77% short over the last 15-years.

- I think the big concern for this market is the Fed surprising with a more hawkish turn. The impetus for this would be inflationary pressures turning out to be less transitory than first hoped. The chart below shows wages climbing at their fastest pace on record…

- This chart from @MrBlonde_Macro shows the historical relationship between wages and the Fed Funds Rate.

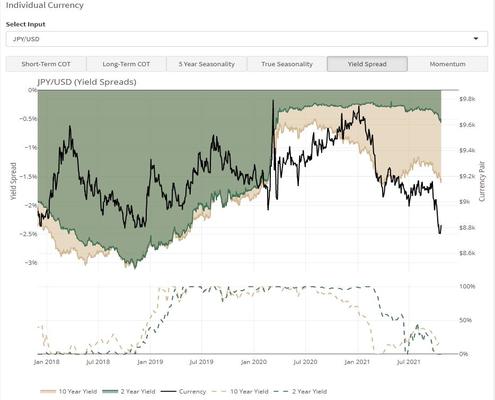
- USDJPY has always been one of the best classical charting markets. Its weekly chart shows the pair has clearly broken out from its 7-year triangle/wedge pattern and most recently a 6-month consolidation range.

- The pair is trading in a BullQ regime and is worth playing to the long side on breakouts and pullback reversals to the midline.

- USDJPY is being driven by rate differentials which are moving in favor of a stronger USD.

- Teradyne (TER), the maker of semi test equipment, has broken out to the upside from its year-to-date trading range and remains in a strong uptrend (chart below is a weekly).

- This week I’m revisiting Spotify (SPOT). I dug into the company not long after they first hit the market. I was, and still am, impressed with Daniel Ek’s vision and direction for the company. He’s one of the best founders/CEOs in the game right now, in my opinion.
There remains a number of significant hurdles they need to successfully clear in order for them to generate a significant amount of cash. But it looks to me like they’re making the right moves to get there. Anyways, I still need to do more research. But the long-term chart makes the revisit look worth the effort…

Thanks for reading.
Stay safe out there and keep your head on a swivel.