Over the last few months I’ve written about how we expect growth and inflation to pick up and surprise to the upside in the coming quarters.
This belief is built on positive pressures we’re seeing within the economy as we move into the ‘overheat phase’ and the world benefits from the wealth S-curve tipping point. And with the market holding consensus expectations for continued low inflation, we find this contrarian hypothesis an interesting and potentially lucrative one should it unfold.
But we never wed ourselves to a trade hypothesis because it’s just that, a hypothesis.
Cognitively we’re wired to latch onto single or binary outcomes when thinking and planning for the future. Reality is much messier than that. “Man Plans and God laughs” as the saying goes, which is why we prize mental flexibility above all else.
A favorite trading quote of mine that I often refer to comes from Bruce Kovner. He explains how one should think about markets:
One of the jobs of a good trader is to imagine alternative scenarios. I try to form many different mental pictures of what the world should be like and wait for one of them to be confirmed. You keep trying them on one at a time. Inevitably, most of these pictures will turn out to be wrong — that is, only a few elements of the picture may prove correct. But then, all of a sudden, you will find that in one picture, nine out of ten elements click. That scenario then becomes your image of the world reality.
The overheat phase is just one alternative scenario that we’re “trying on”. But there are many potential catalysts, such as a China crackdown on leverage or a large illiquidity impact from Treasury cash balance normalization, which could derail this narrative.
This is why we have to routinely turn to the data to see where we are and to get a better idea of where we may be headed.
So let’s take a look at the Marcus “Trifecta” of Macro, Sentiment, and Technicals of the market to get a sense of where the risks and opportunities lie over multiple timeframes.
Macro: Global reflation picking up steam
Global GDP is hockey sticking higher and the world economy is now growing at 4.3%; the highest level in 7 years.

This growth is matched by global trade which is also growing at its fastest pace since 2011.

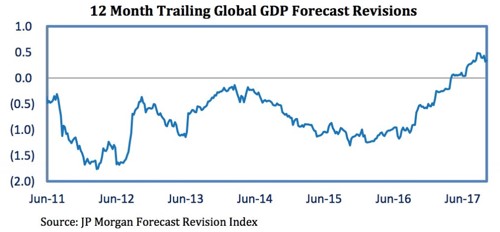
The pickup in global growth is routinely beating estimates and trailing twelve month global GDP forecast revisions are at their highest levels in over 7 years and trending higher.
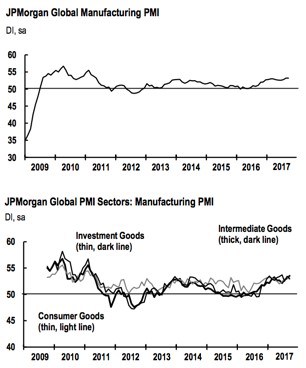
The global manufacturing PMI is trending upwards and hitting new cycle time highs. And the latest Markit PMI report suggests growth and inflationary pressures are building. Here’s a few highlights from the report:
National PMI indices signalled expansion in almost all of the nations covered by the survey… Manufacturing production rose at the quickest pace in six months, underpinned by further increases in both total new orders and international trade volumes.
The continued upturn in new order inflows exerted further pressure on capacity, leading to one of the steepest increases in backlogs of work over the past three-and-a-half years. This in turn encouraged manufacturers to raise employment to the greatest extent since May 2011.
Staffing levels were increased in almost all of the nations covered by the survey… Price pressures intensified in September. Input cost inflation rose sharply to a seven-month high, a key factor underlying the steepest increase in selling prices since May 2011. Companies linked higher purchasing costs to rising commodity prices and increased supply-chain pressures (reflected in a steep lengthening of average vendor lead times).
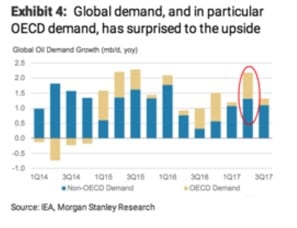
Global oil demand is routinely beating estimates. We’ve noted over the last few months that demand forecasts were overly pessimistic and low balling likely demand growth. This still remains the case.
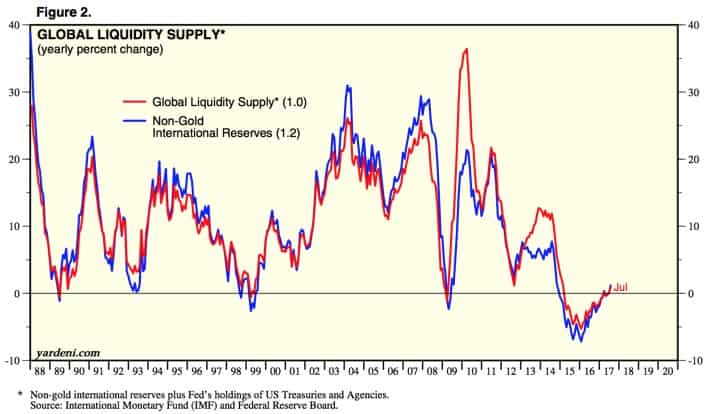
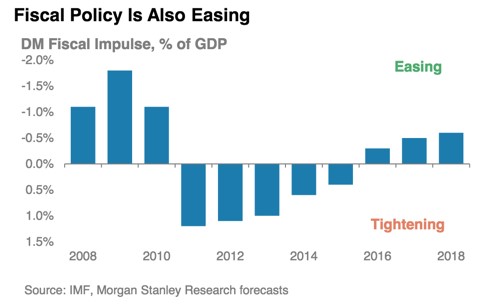
Global liquidity is extremely loose and the trend is still towards more easing though this trend should begin to slow at the start of next year.
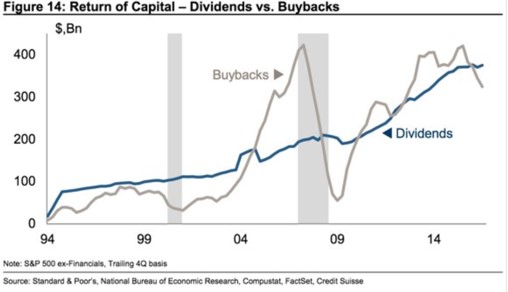
The data isn’t all great though. In the US corporate buybacks have rolled over. This is typical late cycle behavior. Companies are diverting money from buying back their stocks and using it to invest in new capacity to meet rising demand and increasing competition.
While this sounds good for the economy it’s not good for the market. This acts as a liquidity suck as demand for stocks is pulled and that money goes into CAPEX which will lead to increased capacity and hence lower margins 1-2 years out.
In the US, the ISM is at its highest level since 1987.
This means the economy is running hot but it also suggest things might be a bit overextended in the short to intermediate term. The chart below marks every time over the last 35 years that the ISM has crossed 60 (vertical yellow lines). Each time has coincided with a short-term market top.

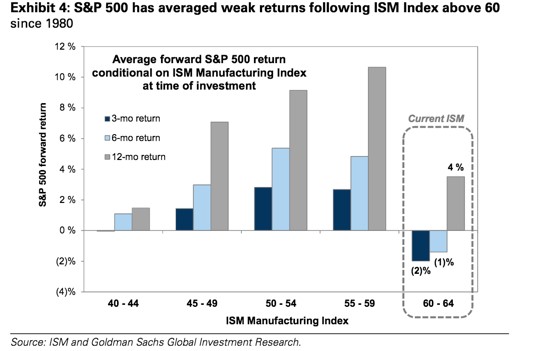
According to Goldman Sachs, the average return for the S&P 500 following over a 3 and 6 month period after the ISM has crossed 60, have tended to be weak.
The sample size for this is small. But something to keep in mind.
Sum up: Overall, the data is constructive for the global economy on a cyclic timeframe. Increasing global growth should continue to push economies up against capacity constraints bringing greater cost pressures and leading to rising inflation.
The macro environment remains supportive of risk assets.
Sentiment: A tale of two tales
This market has been a tough read sentiment wise.
There’s definitely pockets of wild speculation, such as in the cryptocurrency market. And equity prices are becoming somewhat richly valued even though there’s still plenty of room for appreciation on an equity risk premium basis.
Depending on what sentiment gauge you look at, market sentiment reads as either extremely frothy or mildly complacent.
I think the case here is that the psychological scars from the GFC run deep and these are just now starting to be overcome.
This market has acted as bad news teflon to everything from dumpster fire politics to the threat of all out nuclear war. And market participants are beginning to read this as an all-clear to up their risk exposure while many perma-bears who’ve missed out on the rally continue to gripe from the sidelines and look for a top that refuses to appear.
Here is the more interesting sentiment and positioning data that I’m tracking at the moment.
According to the latest BofA fund manager survey, the dominant market narrative has shifted from that of “secular stagnation” to “goldilocks” where participants expect continued above trend growth and below trend inflation.

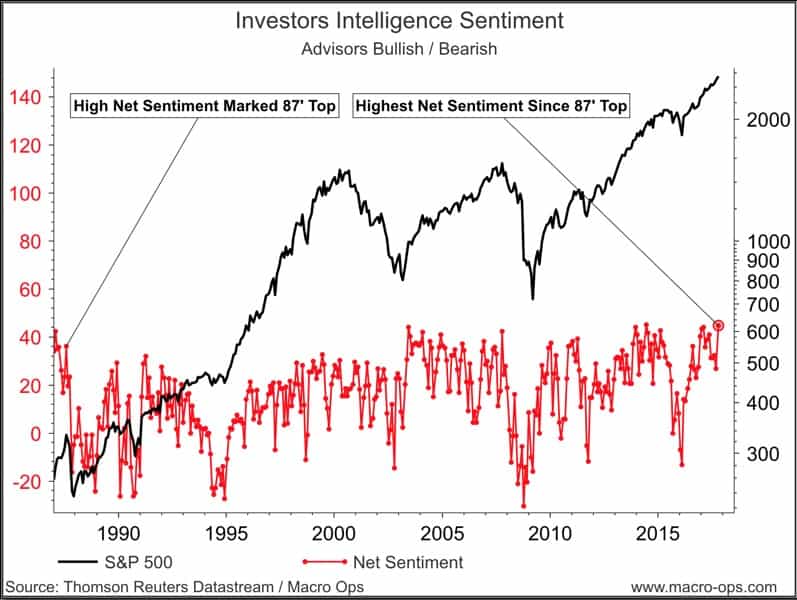
The latest Investors Intelligence sentiment survey has net sentiment (bull – bear) at the survey’s highest level since 1987’.
Fund managers have been upping their exposure to equities.
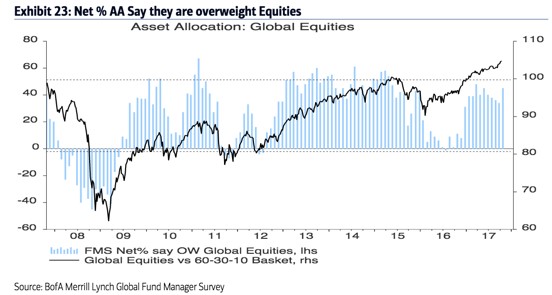
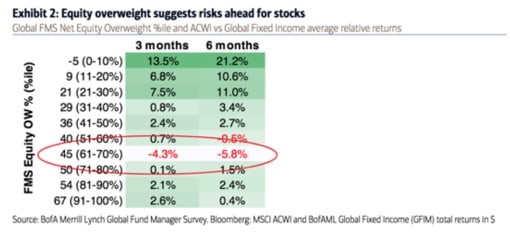
The global equity net overweight reading is now 45%. The 40-45% zone has historically coincided with equity underperformance versus bonds and cash over the following 3-6 months.
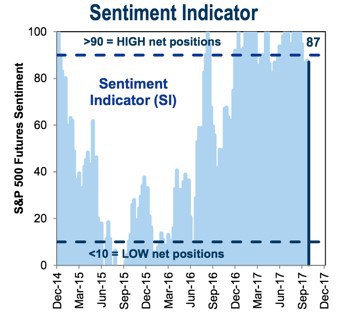
S&P 500 futures sentiment is extended and near a level that typically coincides with reversal points.
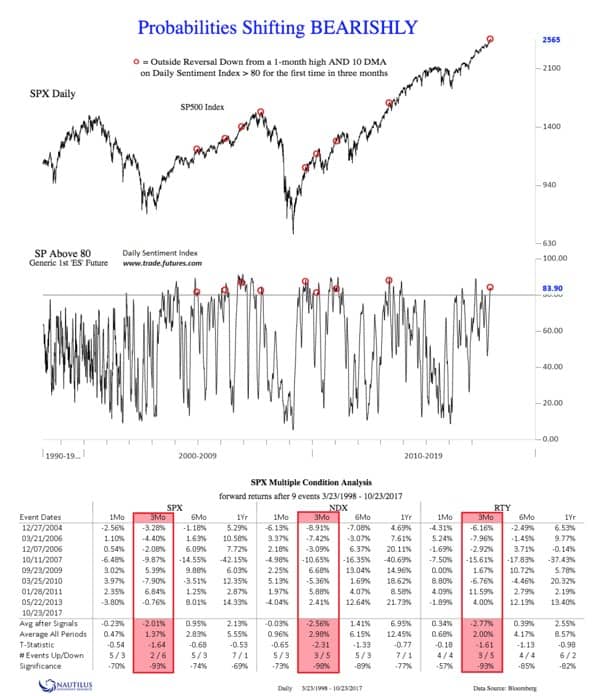
And the SPX multiple conditional analysis chart below via Nautilus shows that the probabilities over the 1-3 month timeframe have shifted bearish.
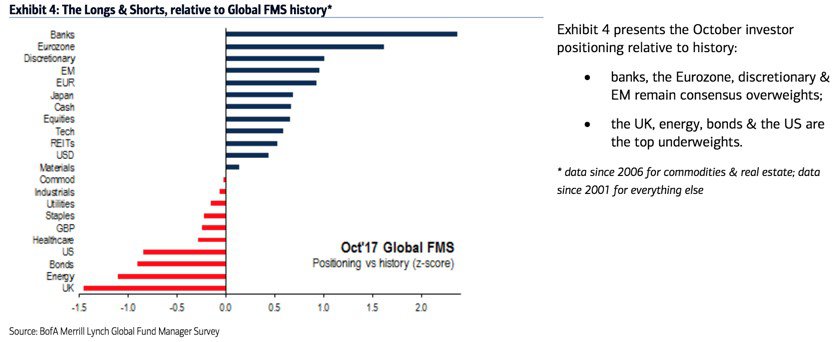
Under this backdrop, positioning appears to be the most crowded in financials and the eurozone. While bonds, energy, and the US are some of the more underweighted assets, according to the BofA survey.
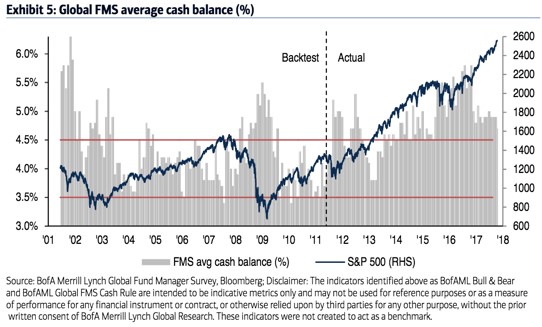
But despite these signs of frothy sentiment and increasing exposure to risk assets, fund managers cash balances remain fairly high and nowhere near the levels that typically mark a cyclical top.
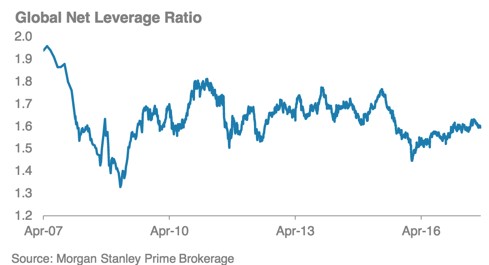
Morgan Stanley’s net leverage ratio paints the same picture. Investor leverage remains muted and stands in stark contrast to the picture of exuberance that the other sentiment/positioning indicators paint.
Sum up: Sentiment and positioning are telling two different stories. It seems that over the short to intermediate term, sentiment and positioning are excessive and will act as a headwind for stocks.
This seems to be particularly true for financials and the eurozone where positioning and expectations appear to be stretched on a short-term basis.
But on a bigger picture basis, I’m not seeing signs of the leverage and low cash balances that indicate investors are overextended and which typically marks a market top.
So over the short-term, sentiment and positioning puts odds on a market pullback. This would reset crowded positioning in long financials and European equities.
Technicals: All Signs Point Up
The market remains technically strong. The trend is up, breadth is good, and credit is bid.
The only negative factor on a technical basis is that the short-term trend is overextended. But this is not a condition for a selloff by itself. Trend persistence is powerful and overextended moves have a tendency to become more overextended.
One thing to watch out for is the current breakdown in bonds. If yields rise significantly over a short period of time then that will likely lead to equity volatility.
Bonds and stocks compete for capital flows. When yields move higher it makes richly valued stocks less attractive to hold. So one indicator we like to track is the 26 week percentage change in Moody’s Baa bond yields.
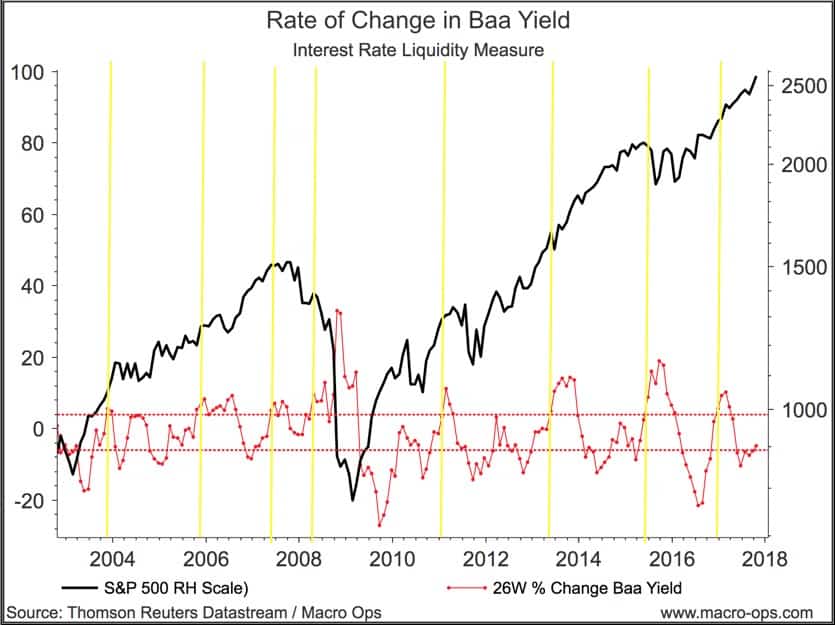
When yields rise fast over a short period of time and cross the top red dotted line, a market selloff tends to follow shortly after. The change in yields currently remain well below that mark.
Trifecta Conclusion:
- The macro data points to a continued strengthening cyclical global recovery but with some potential short-term headwinds.
- Most signs point to increasing growth and inflation in the months ahead.
- Sentiment and positioning tell two different tales. Sentiment and equity positioning is currently excessive and will act as a headwind for stocks and increase the likelihood of a market pullback. But in the bigger picture, cash balances are not excessively low and leverage is not at levels that are indicative of a top.
- Technically the market is in a strong uptrend. Over the short-term the market is overextended but trends can remain overextended for a long time.
Looked at holistically, I’d say that the odds are increasing for a nearterm market selloff in the 3-10% range. But bigger picture, we remain in a strong bull market that’s unlikely to end anytime soon. A selloff should be viewed as an opportunity to add to positions, but not something to over react to.
One of the most common errors investors make is to fret too much over the potential for a correction and then chase the trend higher from a position of weakness. This leads to buying and selling at inopportune times.
Instead, we’ll sit long and add positions as opportunities present themselves.
If you’d like to dive deeper into the positions we’re targeting and how we’re playing them, then check out the Macro intelligence Report (MIR).
The MIR is our monthly report that cuts through the noise to alert you of the largest macro trends and how you can profit from them.
In November’s report (which we will release next week) we’re covering all the latest large macro events and how they’ll affect the markets and economy, including:
- The conclusion of China’s November Congress
- Shinzo Abe’s win in Japan
- The new Fed chair
- And more
If you want to know what these macro shifts mean for you and your investments, then subscribe to the MIR by clicking the link below and scrolling to the bottom of the page:
Click Here To Learn More About The MIR!
Our November issue will also have a special in-depth look at the mania that is Bitcoin. At this point I’m sure you’ve even heard your Uber driver talk about it…
Is it all hype? Should you buy in? Or is a spectacular crash coming?
We’ll give you an Operator look at exactly what’s going in the cryptocurrency markets.
And of course, as always, we’ll show you a few of the stocks we’re targeting that are close to rocketing higher.
You won’t want to miss out on these plays… especially with the new option strategy we have to play them!
Remember, there’s no risk to try the MIR. Your subscription comes with a 60-day money-back guarantee. If it’s not right for you, we’ll return your money immediately.
Click Here To Learn More About The MIR!