
“Grave dancing is an art that has many potential benefits. But one must be careful while prancing around not to fall into the open pit and join the cadaver. There is often a thin line between the dancer and the danced upon.” ~ Sam Zell
In this week’s Dirty Dozen [CHART PACK] we walk through some monthly charts, look at the headwinds from fast rising yields, cover bearish HF positioning, a bottoming China, and a loonie about to launch, plus more…
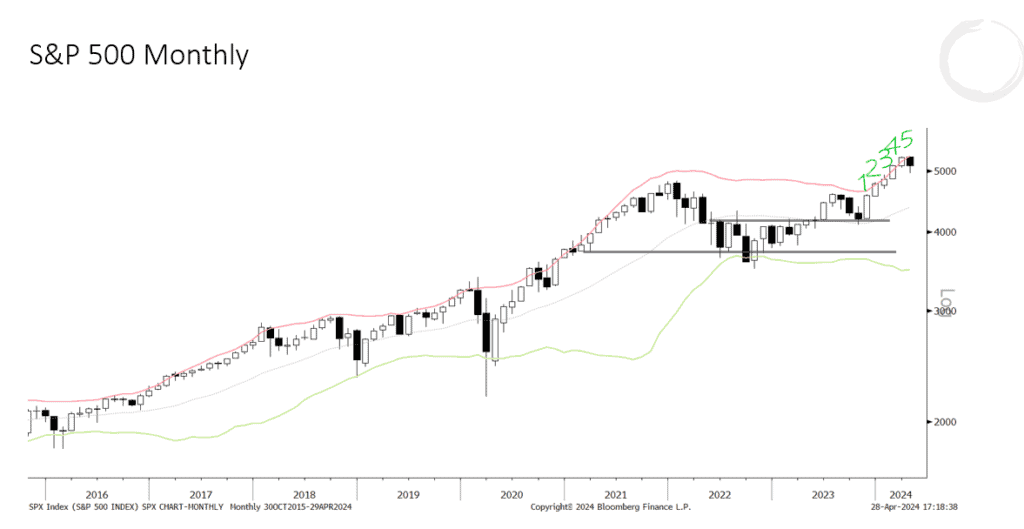
1. Only two days left before a new monthly bar is printed. The monthly SPX chart below shows that April will be the first down month following 5 consecutive bull bars. The first correction following that type of persistent buying is typically short and shallow, and nearly always leads to new highs.
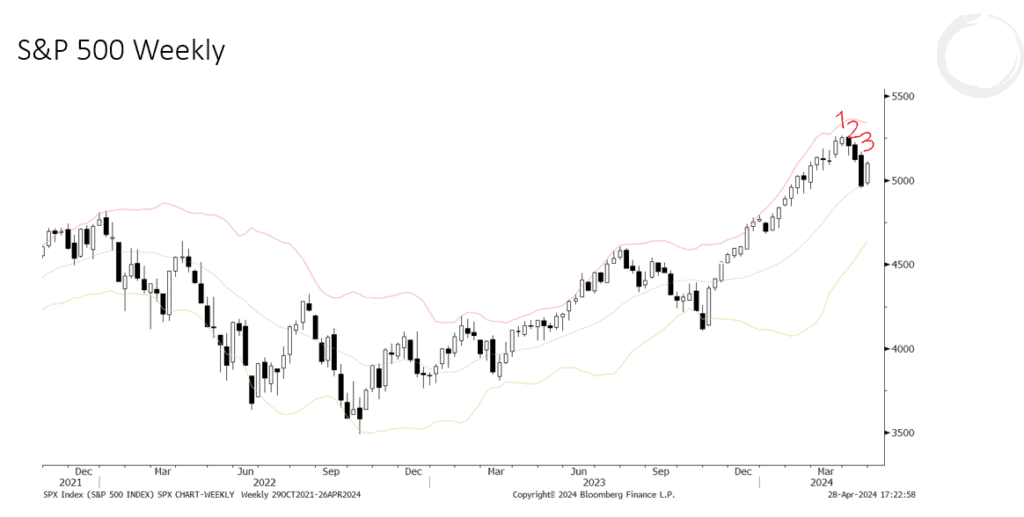
2. We can see that last week was the first bull bar following three large consecutive weekly bear bars. Typically we’ll see at least a double bottom or one more leg slightly lower following this type of action. So maybe we see one or two more weeks up followed by a retest of last week’s low (which would also be in line with seasonality trends) before the next bull leg kicks off.
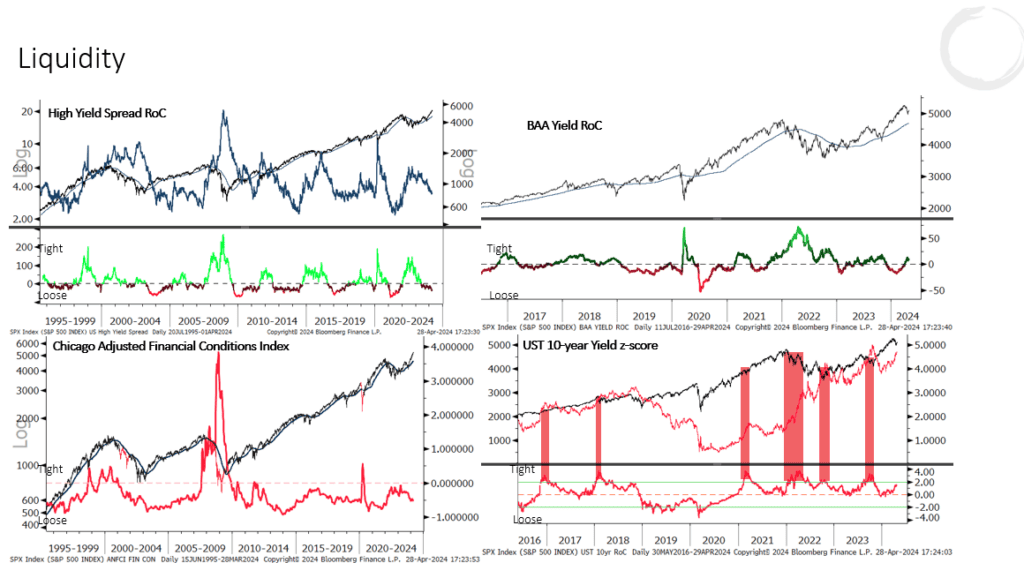
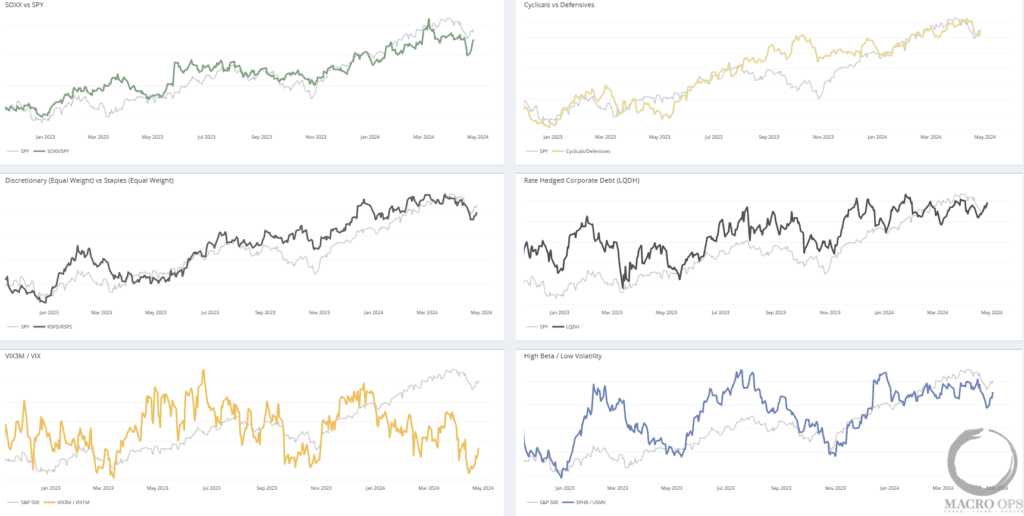
3. Overall financial conditions remain very supportive of risk assets. But… the rate-of-change in 10-year yields (bottom right chart) is approaching the 2std extension level (red shading), which typically leads to chop and vol in equities until bonds catch a bid and yields steady out.
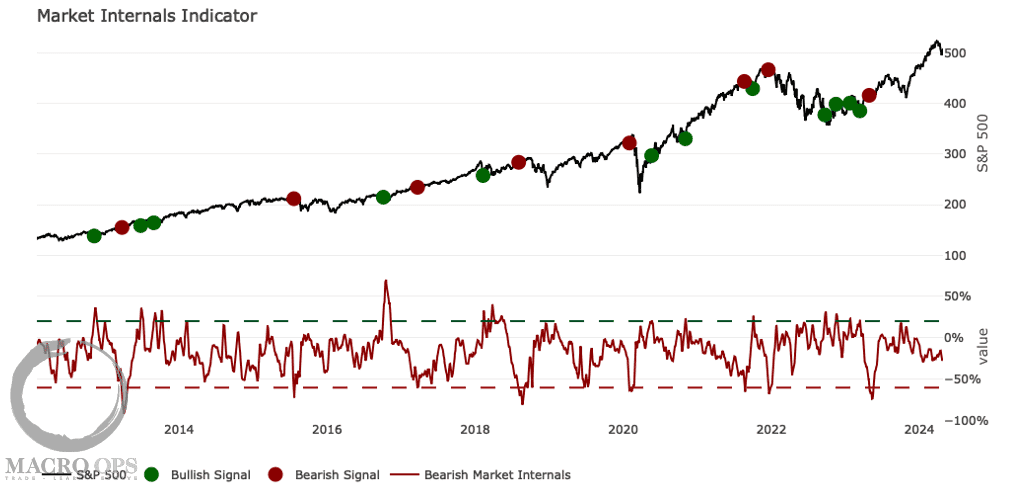
4. Market internals remain in neutral territory and still well above levels that typically precede major selloffs.
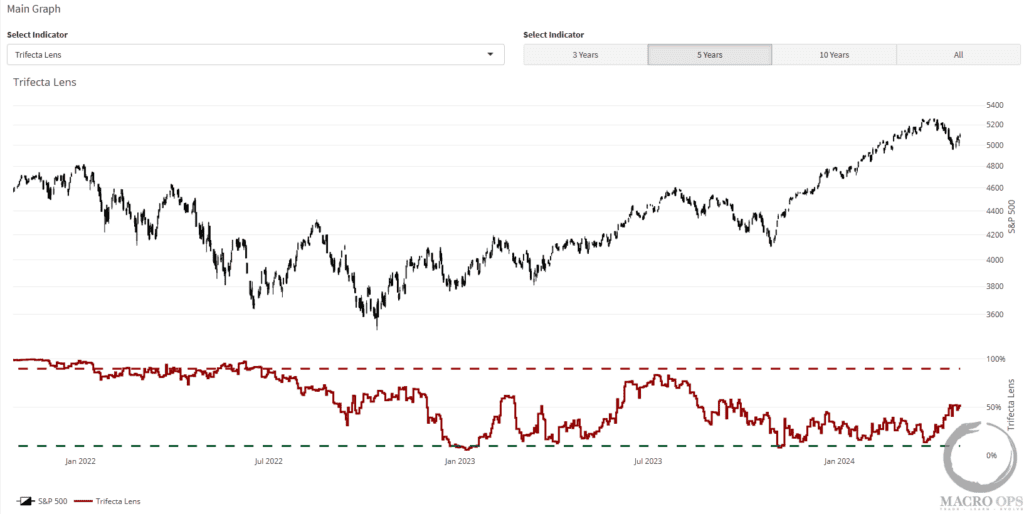
5. Our Trifecta Lens (a composite of various liquidity, sentiment/positioning, and technical data points) sits at 52%, which is a level that’s supportive of the longer-term bull trend. High reads are bearish and low and rising readings are bullish.
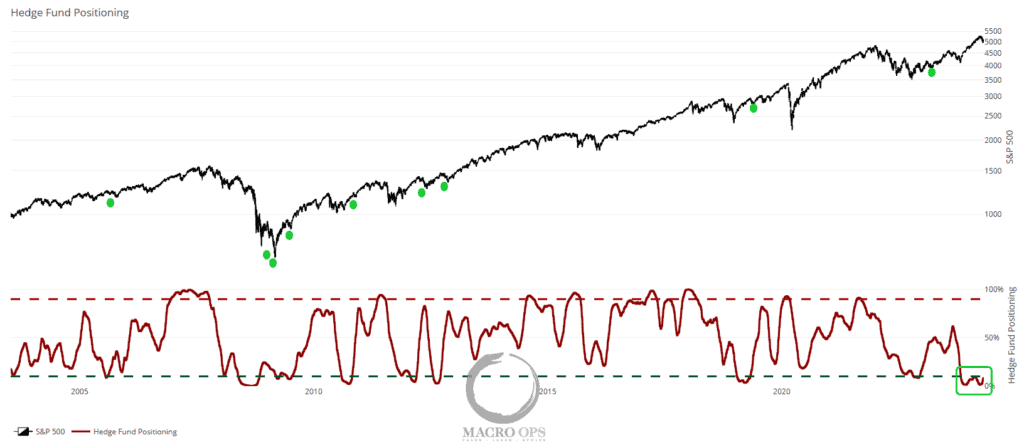
6. Hedge Fund positioning sits at levels that tend to mark either major bottoms or positive inflection points within larger trends. Green dots mark past instances where HF positioning moved back above 10% (green dotted line).
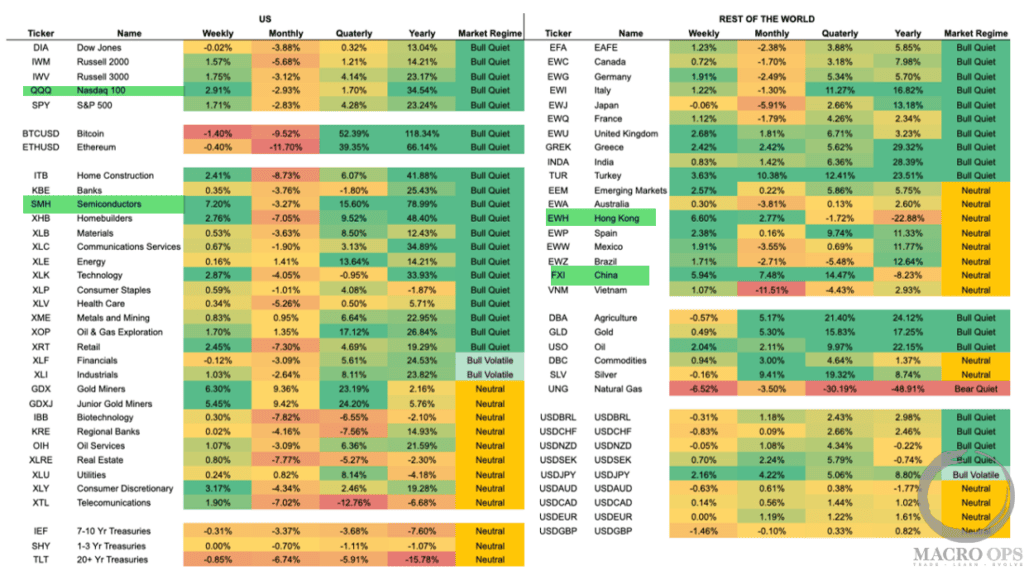
7. The Nasdaq 100 led the rebound last week which is a good sign for the bulls. Other notable performances were in China (FXI) and Hong Kong equities (EWH).
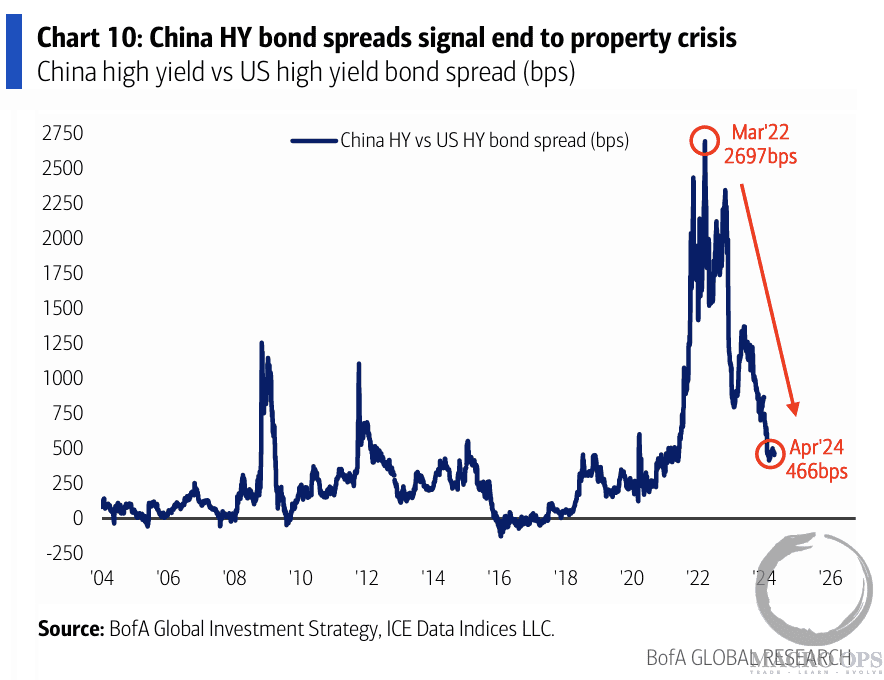
8. This chart from BofA shows that China’s high-yield bond spreads have tightened by roughly 2,200bps over the past two years, signaling at least an intermediate bottom in their property crisis.
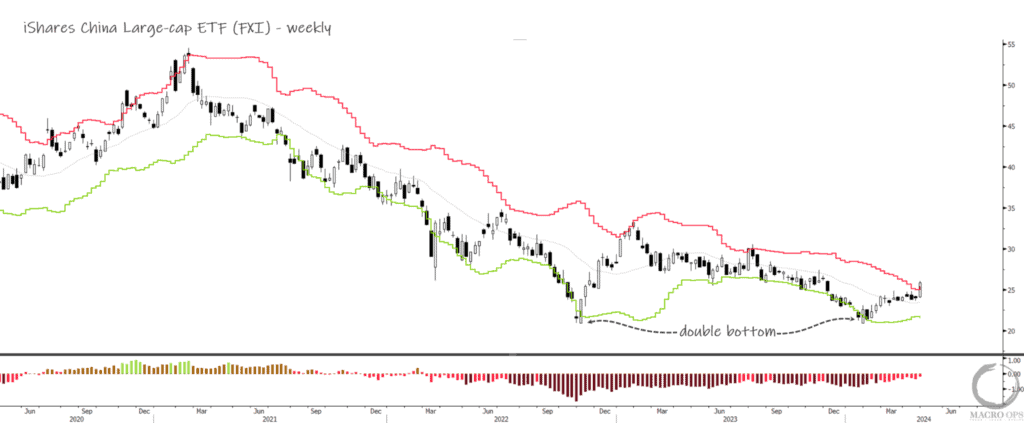
9. Now we don’t invest in Chinese assets because we don’t care to allocate capital to the CCP. But for you degens out there, Chinese large caps (FXI) look to have put in a double bottom (chart below is a weekly).
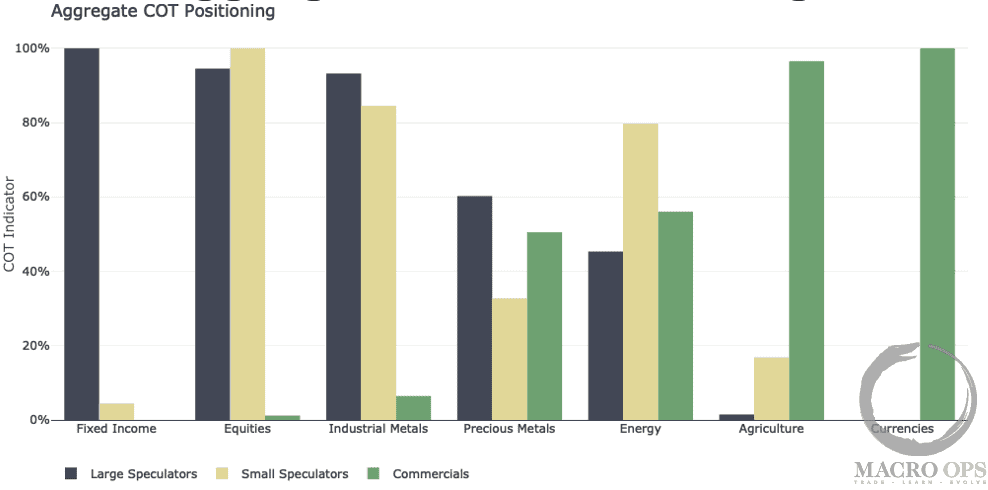
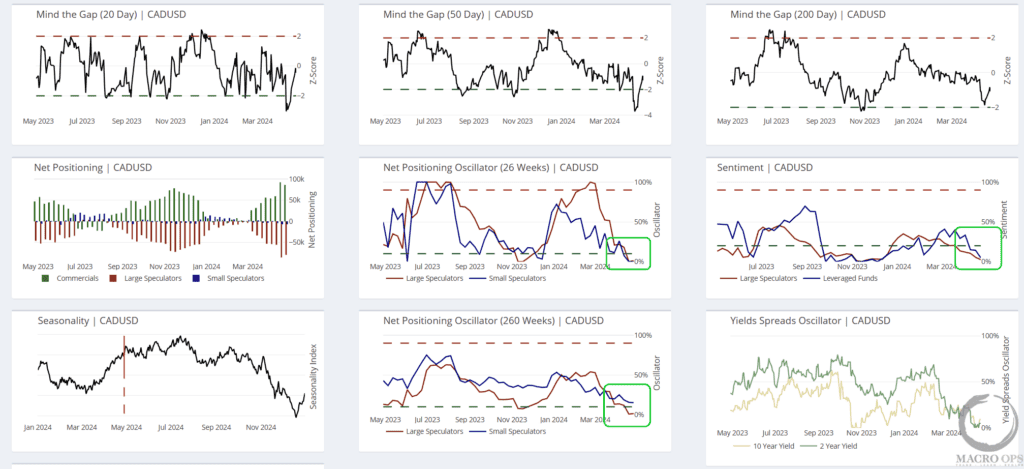
10. Speculative positioning in long USD plays is nearing historic extremes. There are very crowded shorts in AUD, JPY, GBP, CHF, and CAD.
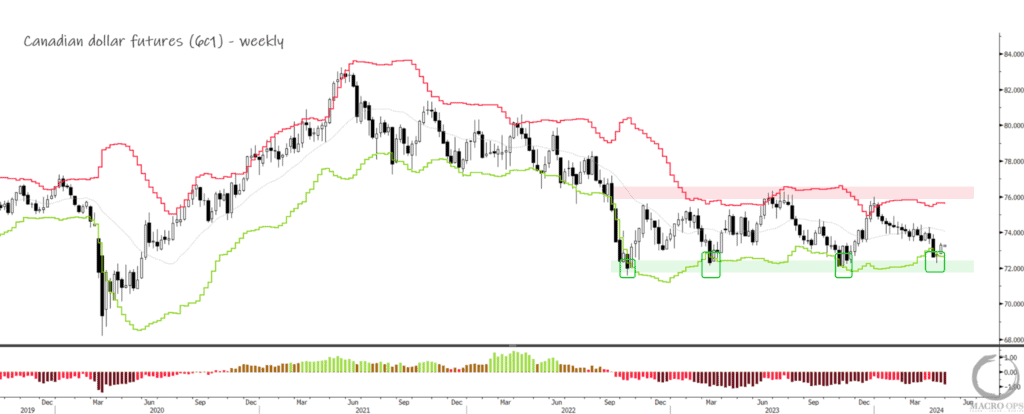
11. I like long CAD here (CADUSD weekly futures chart below). It’s bouncing off an 18-month support level (green line). Both positioning and sentiment are sub-10th percentile. And this (commodity currencies) is a good play on a temporary China recovery.
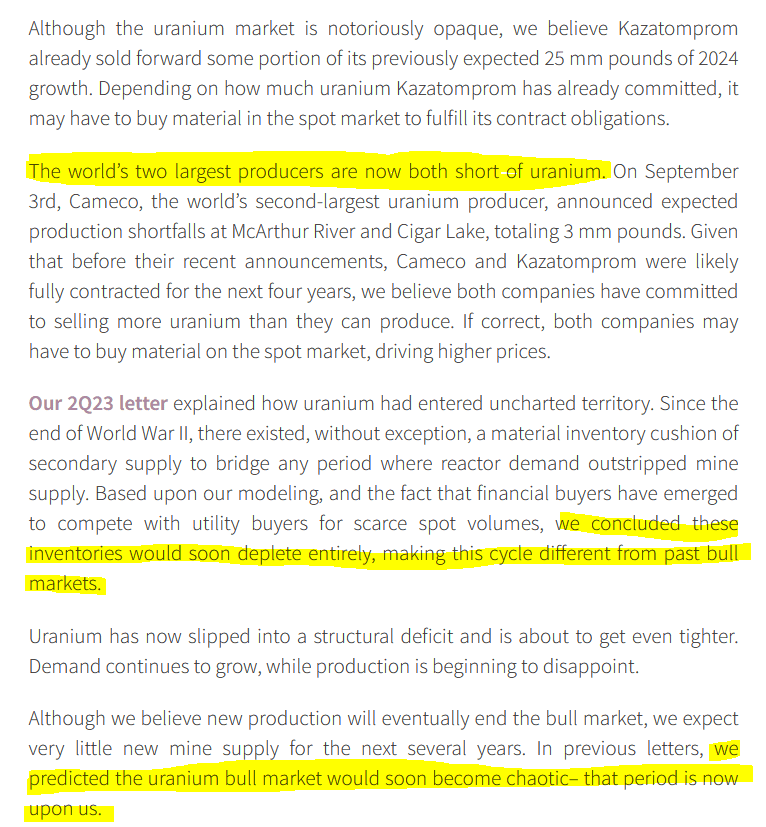
12. @rana1965 shared this clip from Goehring and Rozencwajg’s recent letter regarding uranium. We remain long-term uranium bulls. We’re quite long at the moment, though from a purely technical and sentiment perspective, I wouldn’t be surprised if we have one more good rinse lower before the U bull resumes.
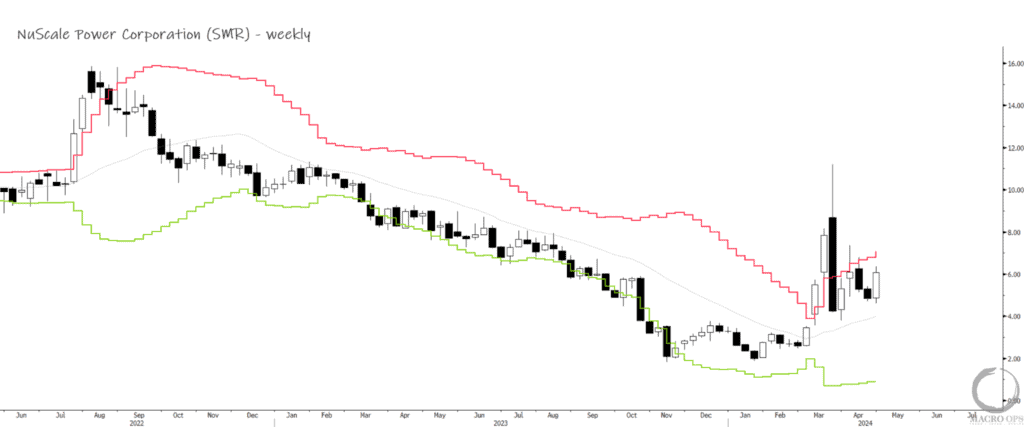
On a related note, NuScale (SMR) weekly chart continues to look constructive. I first pointed them out in these pages back in early February (link here). It popped as high as 280%+ and has since consolidated some. I still like this name as it’s cheap and has solid price action.
Thanks for reading.


