“Remember this: When you are doing nothing, those speculators who feel they must trade day in and day out, are laying the foundation for your next venture. You will reap benefits from their mistakes. Speculation is far too exciting. Most people who speculate hound the brokerage offices or receive frequent telephone calls, and after the business day they talk markets with friends at all gatherings. The ticker or translux is always on their minds. They are so engrossed with the minor ups and downs that they miss the big movements. Almost invariably the vast majority have commitments on the wrong side when the broad trend swings under way. ” ~ Jesse Livermore
Good morning!
In this week’s Dirty Dozen [CHART PACK] we look at the technicals and TL Score on the SPX, discuss credit impulses, rising yields, and stretched EM flows… cover the possibility of an intermediate top in EURUSD, check out record inflows into energy, bitcoin ownership, and make the case for shorting Salesforce.com (CRM), plus more…
Let’s dive in.
***click charts to enlarge***
- SPX finished slightly lower last week. The weekly chart has formed an i-o-i breakout pattern (direction agnostic). The daily is in a rising wedge and firmly in a Bull Quiet Regime.
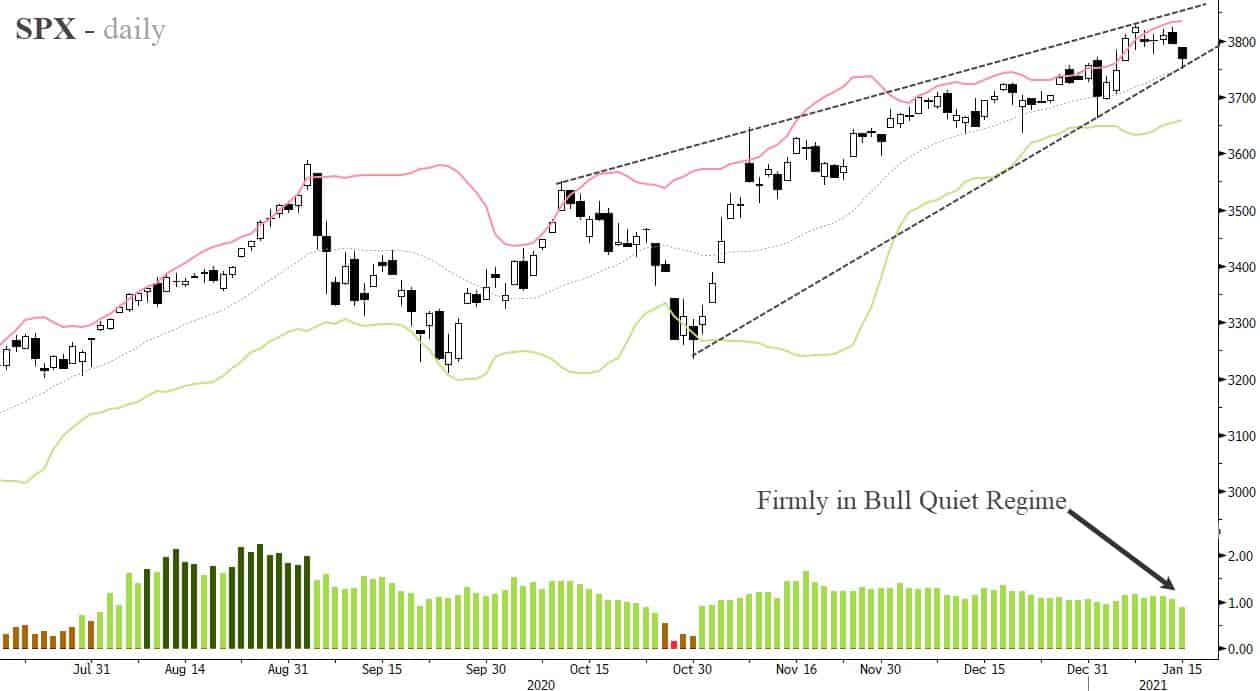
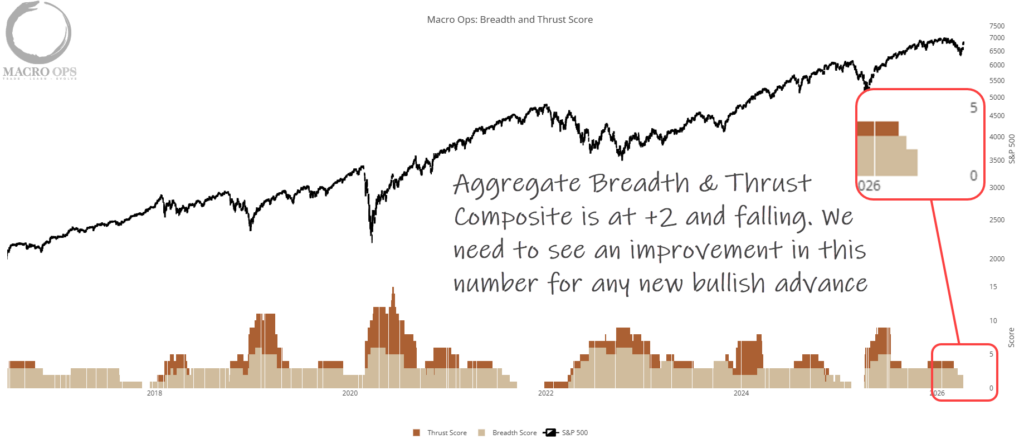
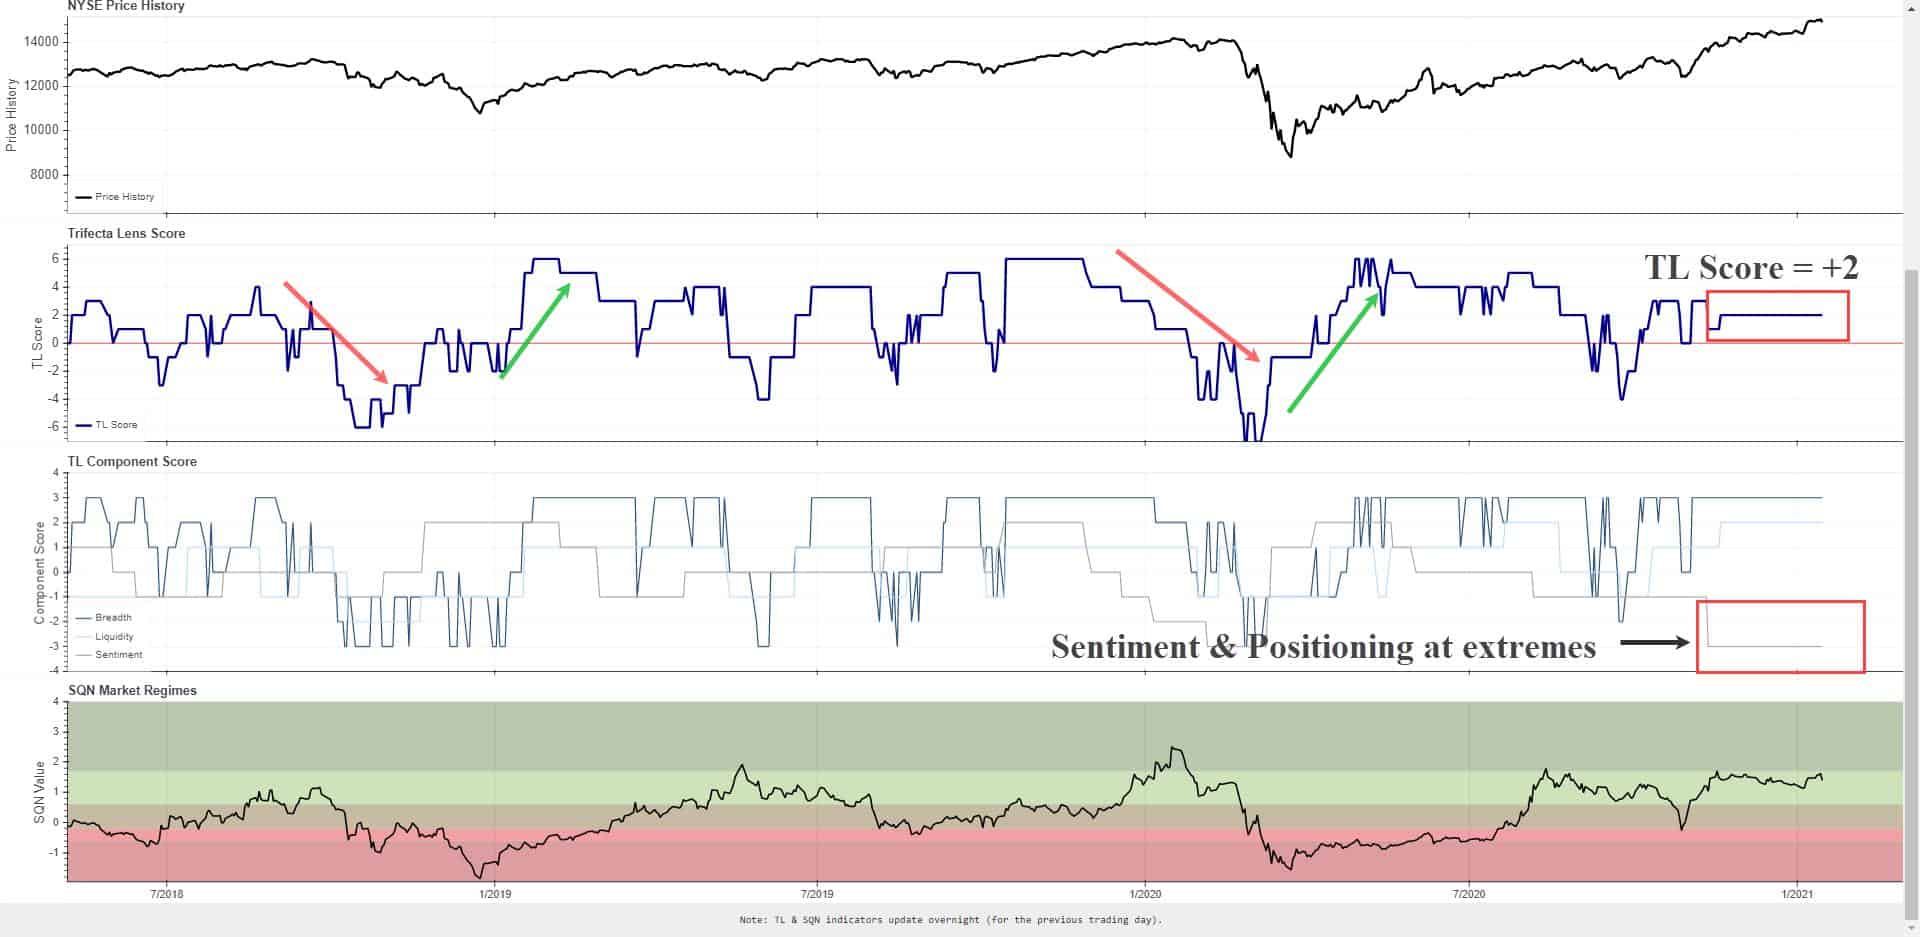
- Our TL Score is still giving a solid +2 with sentiment and positioning being the big detractors. This means that it’s highly unlikely we’ve put in even an intermediate top. The path of least resistance is still up. But we should expect an increase in chop and volatility until bullish positioning is wrung out.
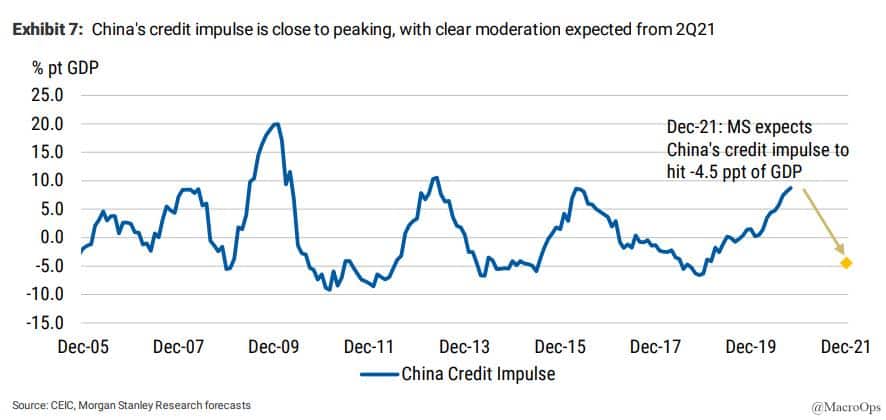
- MS writes “markets may have to contend with a turn in China’s credit cycle relatively soon. To be clear, our China economists do not expect a slowing in China’s credit impulse to derail the growth outlook for China. However, the credit impulse in China is correlated with commodity currencies and commodity FX.
“Should a slower credit impulse also coincide with a repricing of expectations of Fed policy, then this would create headwinds that would justify turning bearish, but that is a decision for when we have more clarity over Fed policy and just how large any fiscal stimulus in the US might be.”
Something to keep in mind.
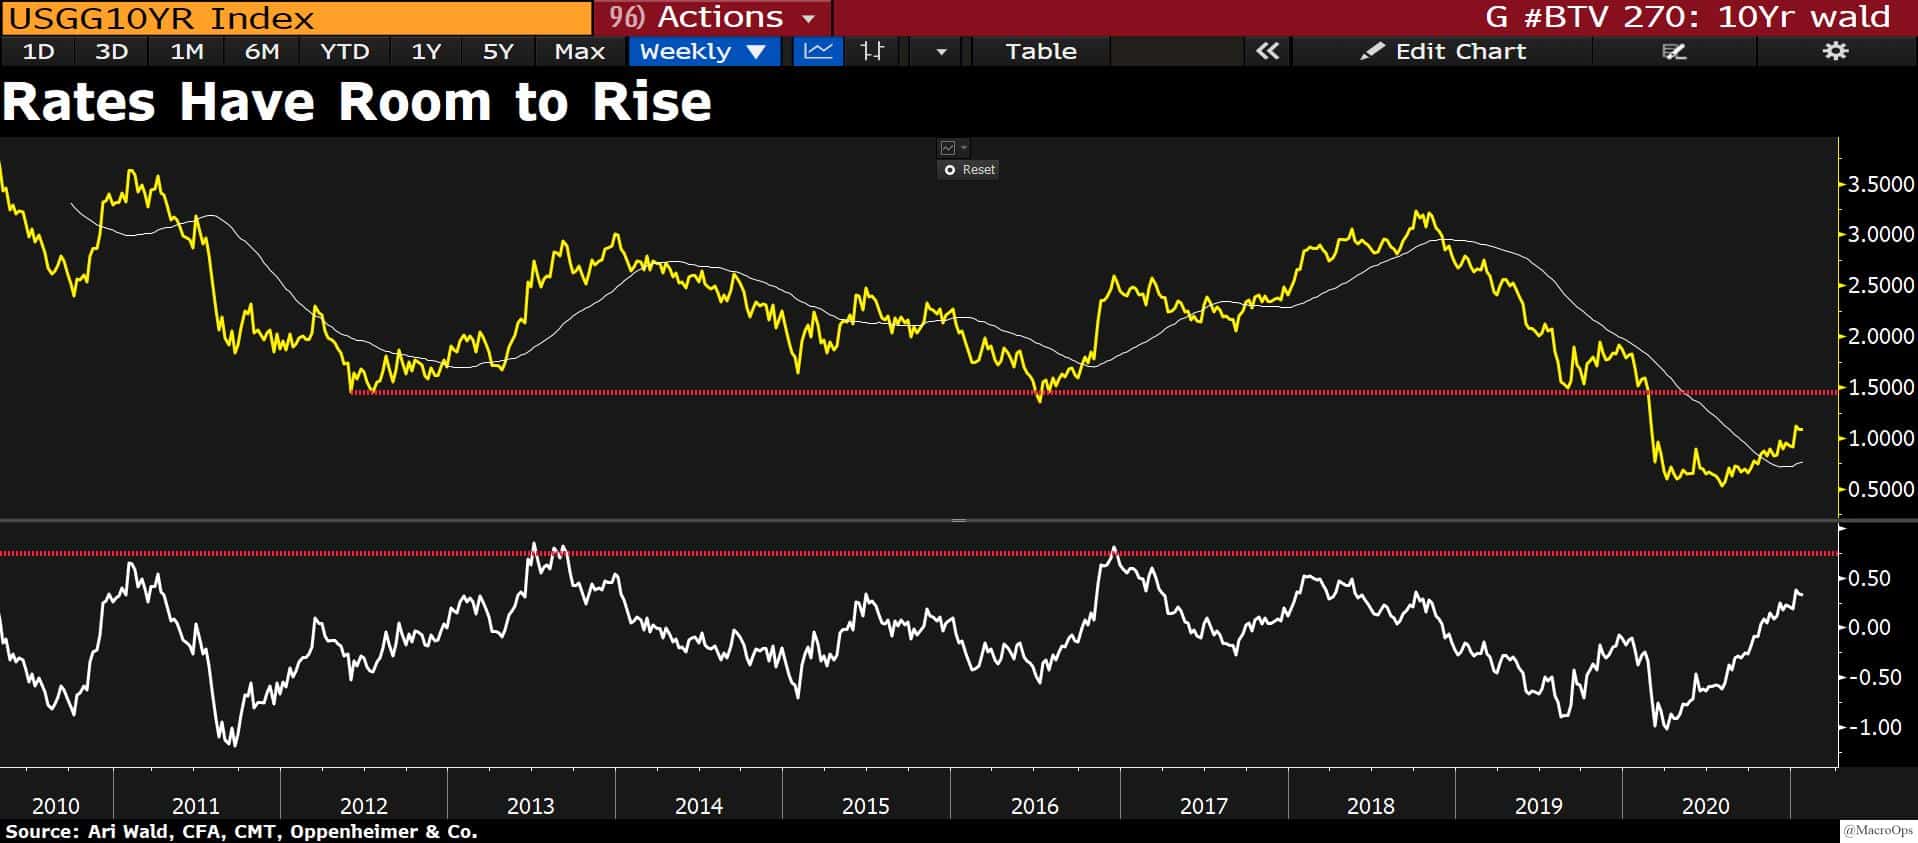
- The 10yr is trading above 1%. According to Ari Wald it still has plenty of room to rise (yellow line = 10yr yield, white line = yield relative to 40dma).
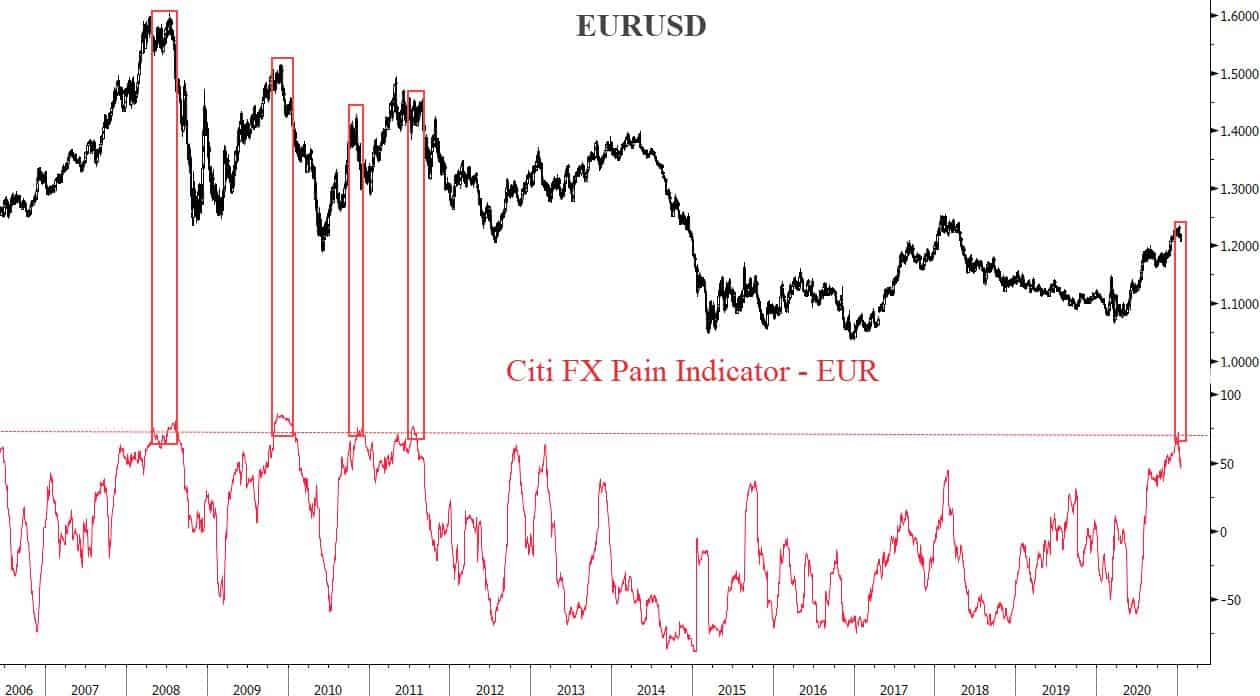
- Rising US yields have brought a bid under the USD. EURUSD has stalled out after hitting its 2018 highs which is serving as major resistance. The Trifecta (macro, sentiment, technicals) suggests we’re entering a corrective phase in EURUSD. Citi’s FX Pain Indicator (EUR) has marked a top every other time it’s turned over from these levels.
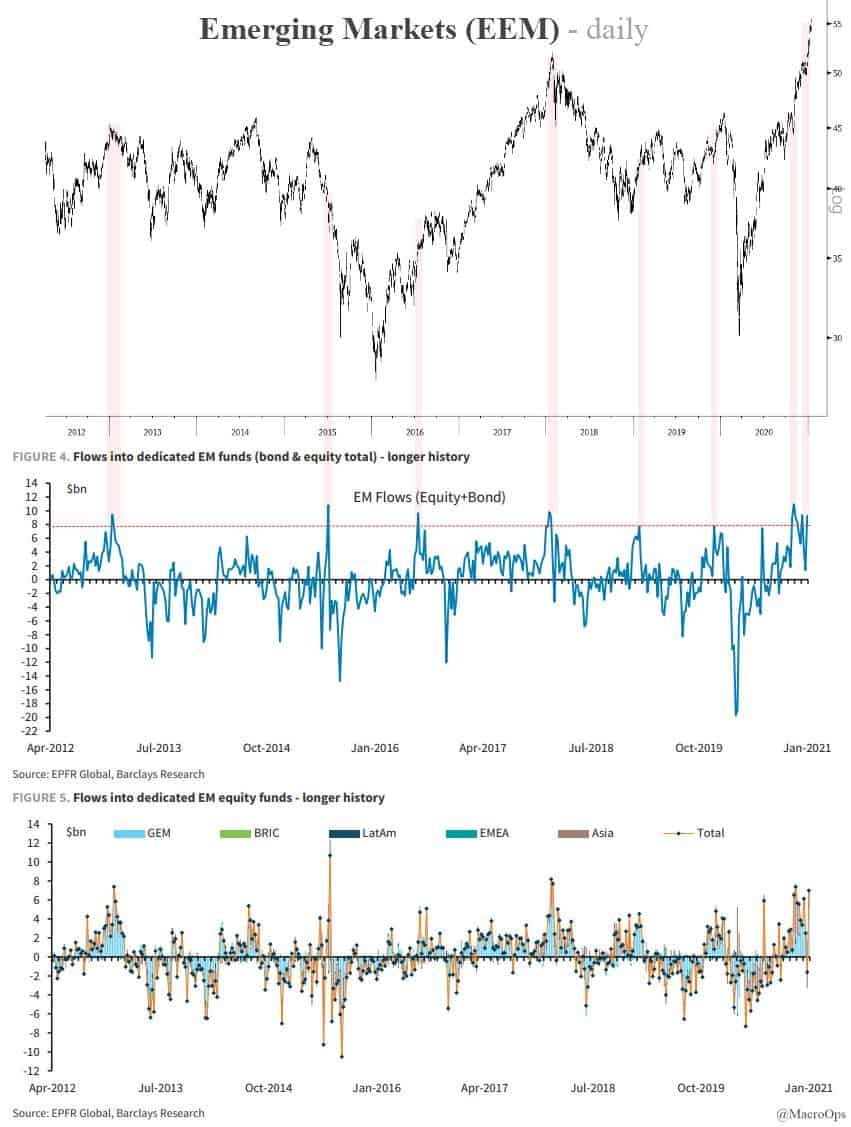
- Slowing Chinese credit growth, rising US yields, crowded USD positioning is running up against near-record inflows into EM equities and debt.
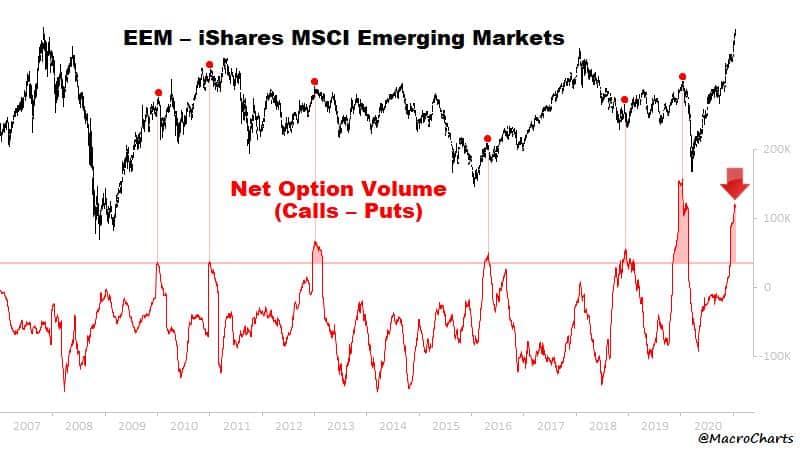
- And as @MacroCharts notes, extremely stretched positioning and sentiment as well.
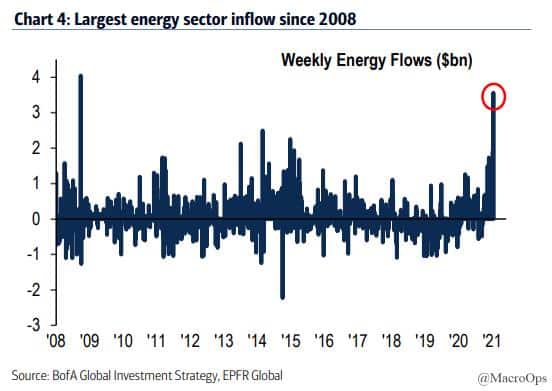
- The energy sector also saw its largest inflows on record last week. Energy is, in effect, a short USD trade.
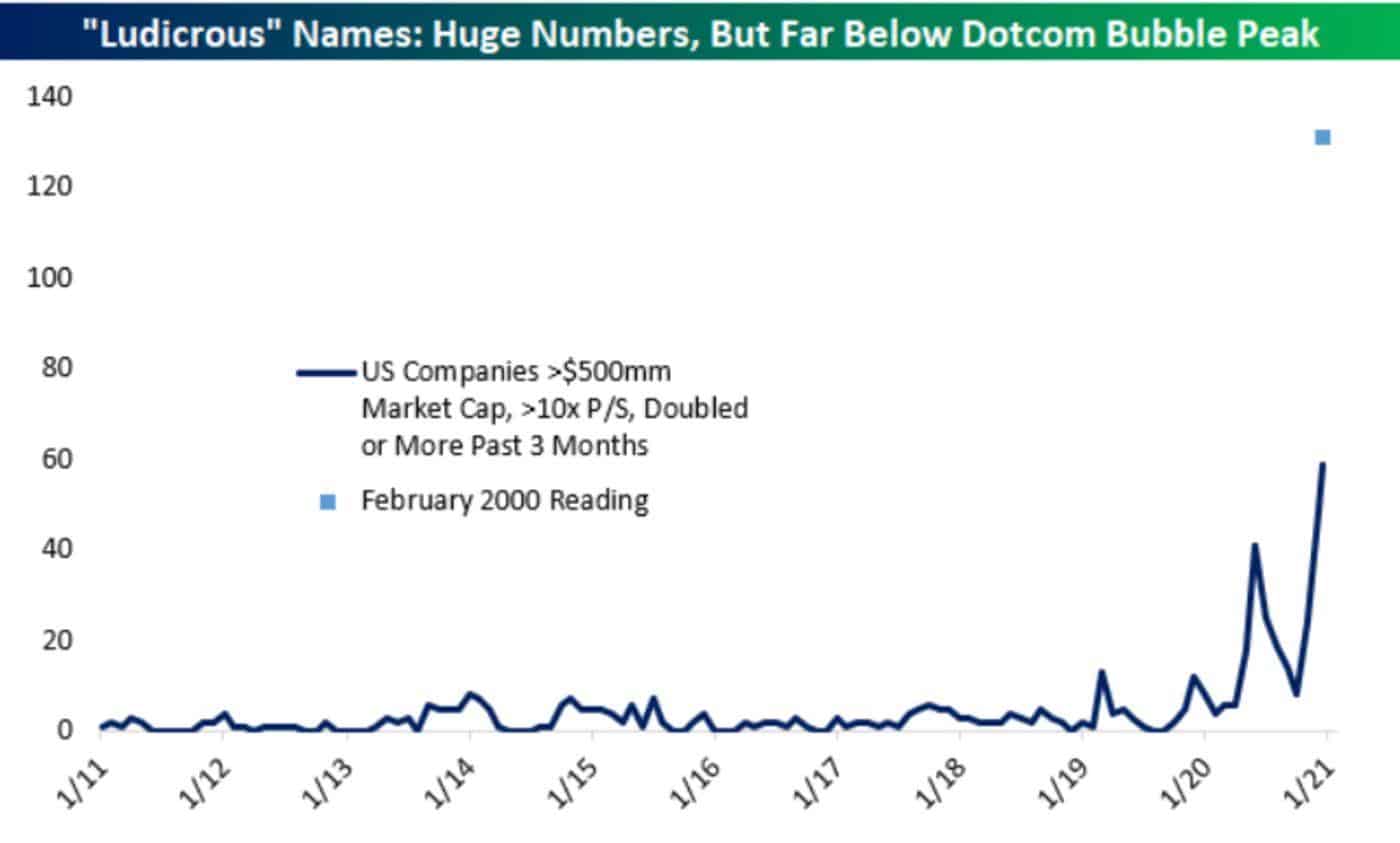
- This is a great chart from Bespoke Invest showing the rise in US companies with over $500mn in market cap trading at over 10x P/S that have doubled or more over the past month. The blue line shows where we are now. The light blue dot shows how “ludicrous” things got by Feb of 2000.
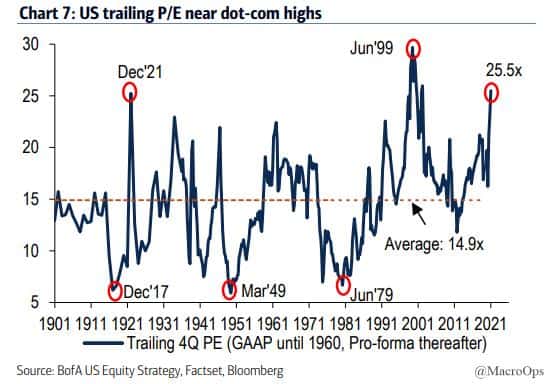
- US trailing P/E… My bet is the market breaks the dot-com record by the time this cycle is over.
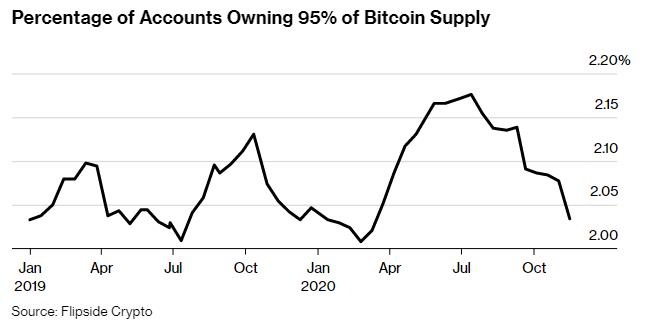
- I thought this was interesting from Bloomberg: “About 2% of the anonymous ownership accounts that can be tracked on the cryptocurrency’s blockchain control 95% of the digital asset, according to researcher Flipside Crypto” And according to PYMNTS.com “Only about 1 percent of the $600 billion invested in bitcoin is institutional… 20 percent of the 18.5 million bitcoin in existence are reportedly stuck in lost or inaccessible digital wallets.” (h/t @tomowenmorgan who’s a great follow on the twitters).
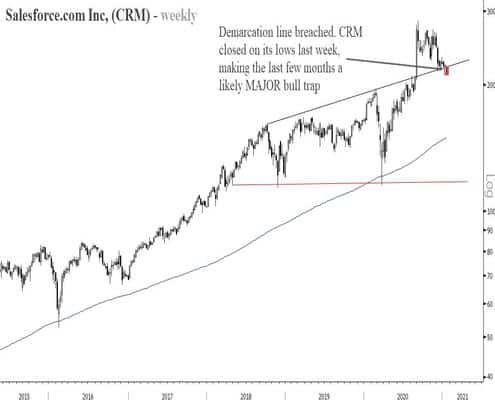
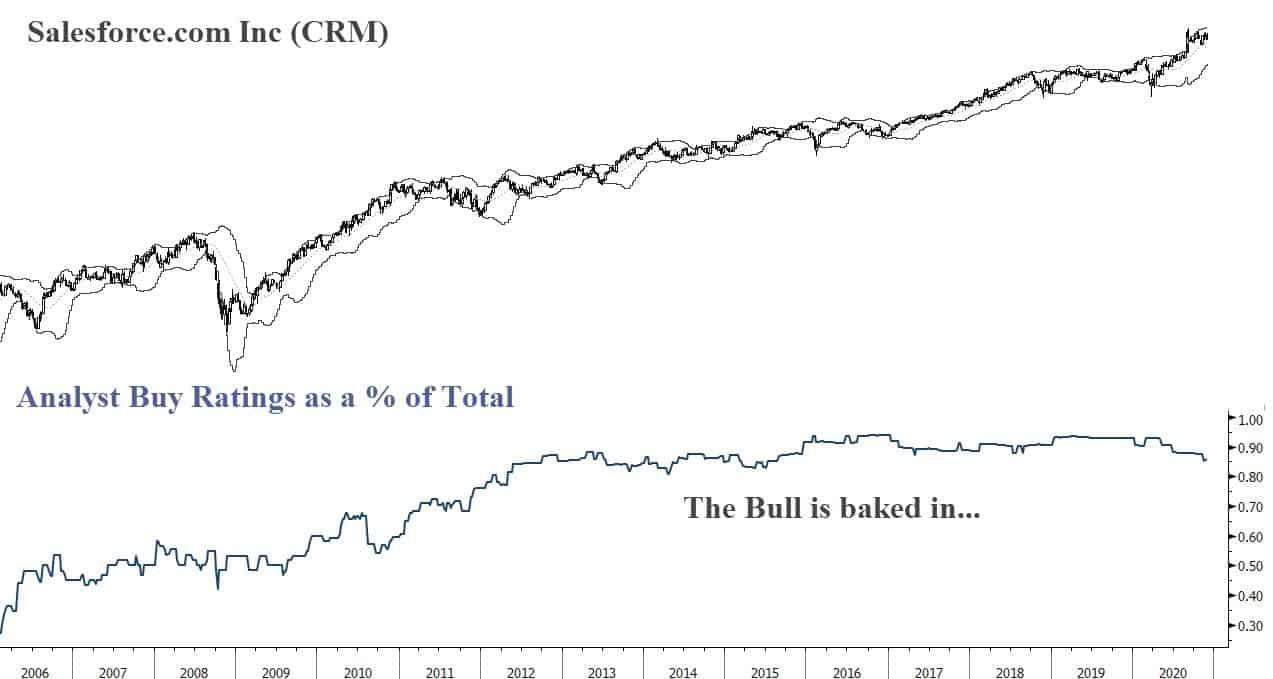
- A short in four acts…
Act 1: Salesforce.com (CRM) is coming off a near-record high gap between its price and 200-day moving average. It recently put in its second-highest price-to-sales ratio of 13x while its revenue growth is declining to its slowest on record…

Act 2: Shorts gave up a looooong time ago.
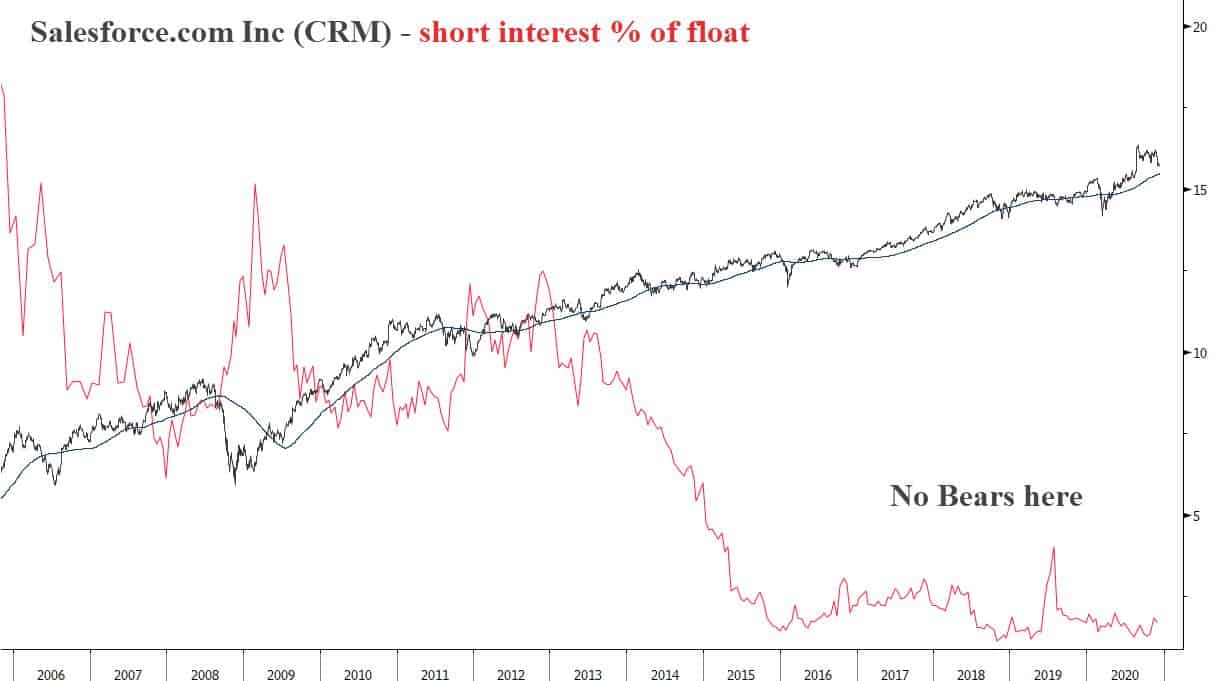
Act 3: Analysts on the street have consensus Buy/Strong Buy ratings on the company. There are NO bears here.
Act 4: Last week the stock closed below the upper level of its 3-year broadening top pattern, suggesting the stock has put in a major bull trap.
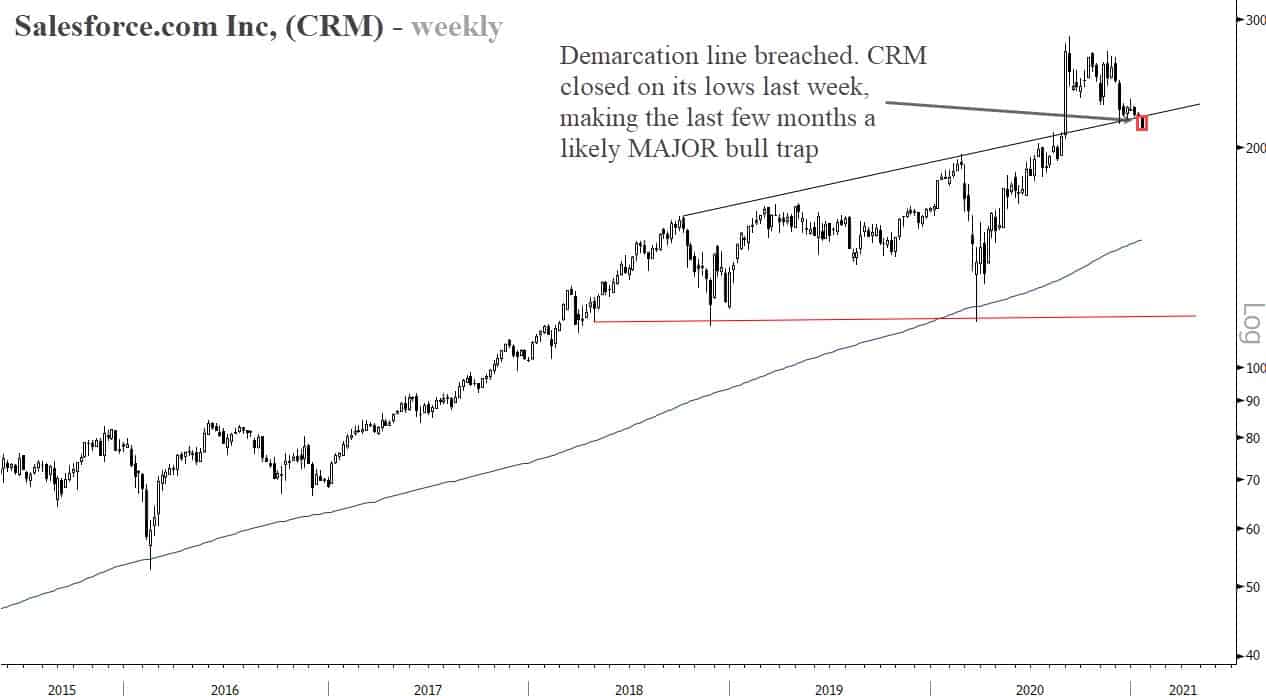
We at MO are very short…
Stay safe out there and keep your head on a swivel.