“Where you want to be is always in control, never wishing, always trading…” ~ Paul Tudor Jones (h/t @AndreA)
In this week’s Dirty Dozen [CHART PACK] we look at consensus SPX end of year forecasts, broad market positioning at their lows. An ISM maybe predicting further downside for the S&P? We then cover big flows out of South Asia, pitch a long setup for an SK tech stock and a US based REIT. And finally end with a look at bitcoin, plus more…
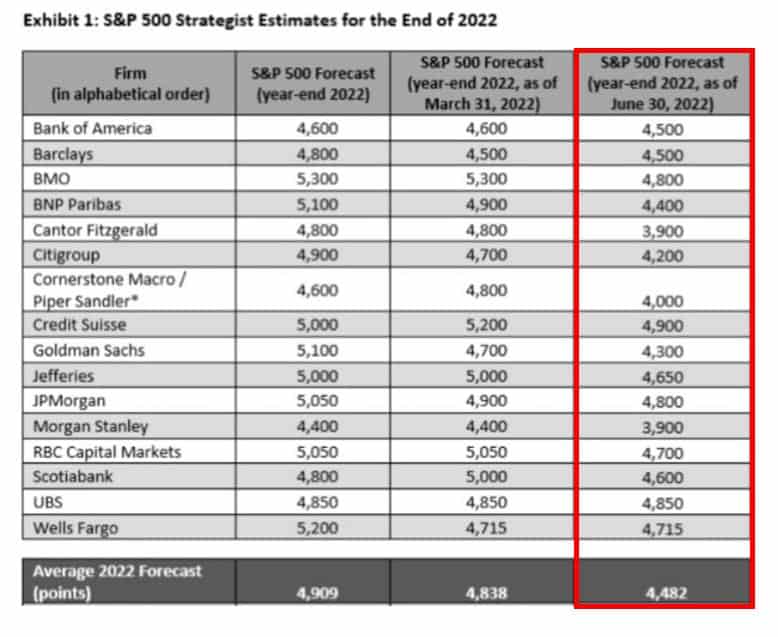
- Zero strategist are predicting a negative 2H return for the market. The consensus estimates remain quite rosy. The average estimate is calling for a 17% rise in stocks over the next 6-months (h/t @johnauthers).
Read this about consensus and markets.
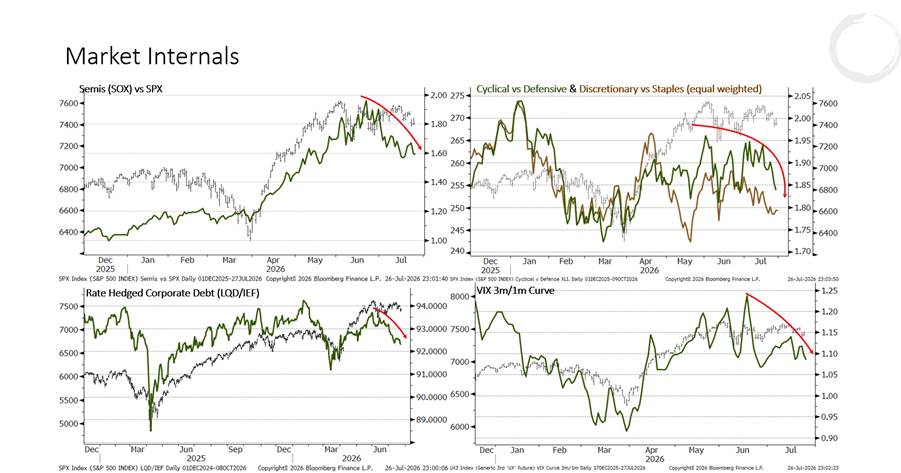
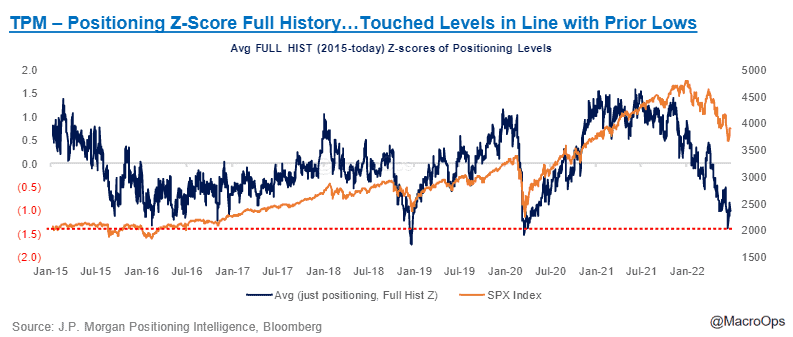
- Last week we discussed how the conditions were giving us a setup for a multi-week bear market rally (if yields held, which they so far have). BofA’s Bull & Bear is pinned at zero. JPM’s TPM, which measures the aggregate positioning level across hedge funds, volatility, asset managers, and retail; recently hit -1.4z. A range that has marked the last three major lows.
Of course, today is different. Recession may be imminent. So stay nimble, size small, and respect your stops.
- @MichaelKantro of Piper Sandler, believes the ISM is headed much lower, tweeting:
Welcome to the start of the earnings/employment bear market. Stay risk off.
Like clockwork – ISM new orders now below 49. We’ve got a LONG way to go before any eco recovery.
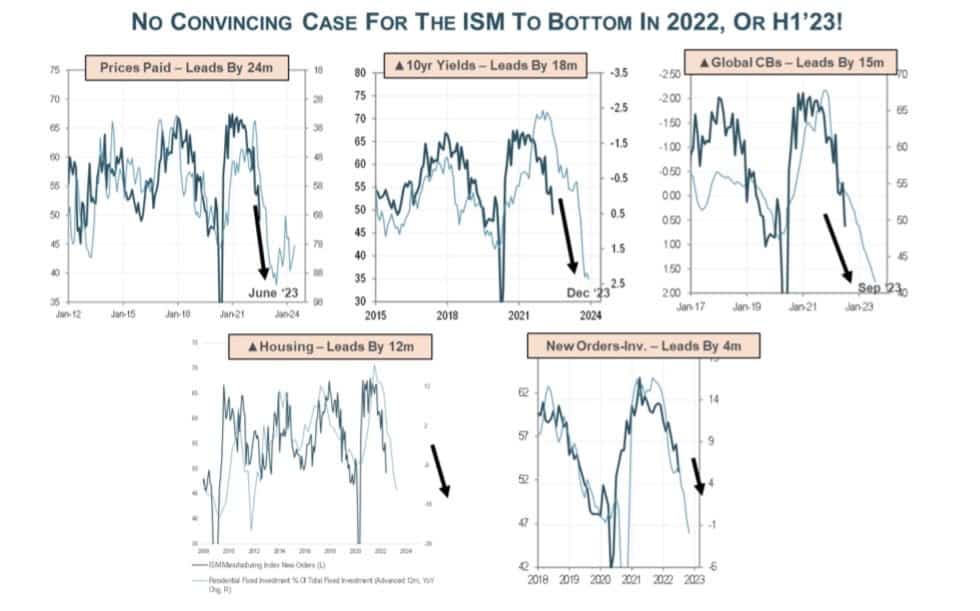
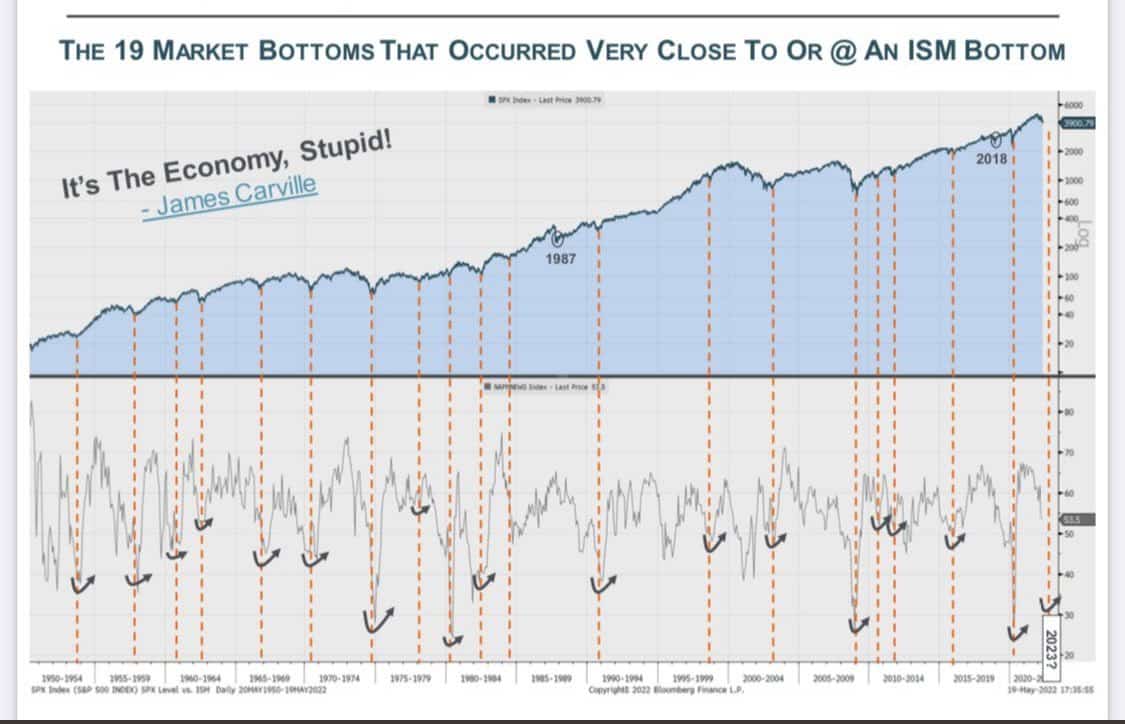
- This is important for markets because as he points out “markets do not bottom without the economy. On average, stocks bottom 1 month before ISM recovery. Charts don’t lie.”
- While I’m sympathetic to Michael’s view, this selloff has been very different than selloffs past.
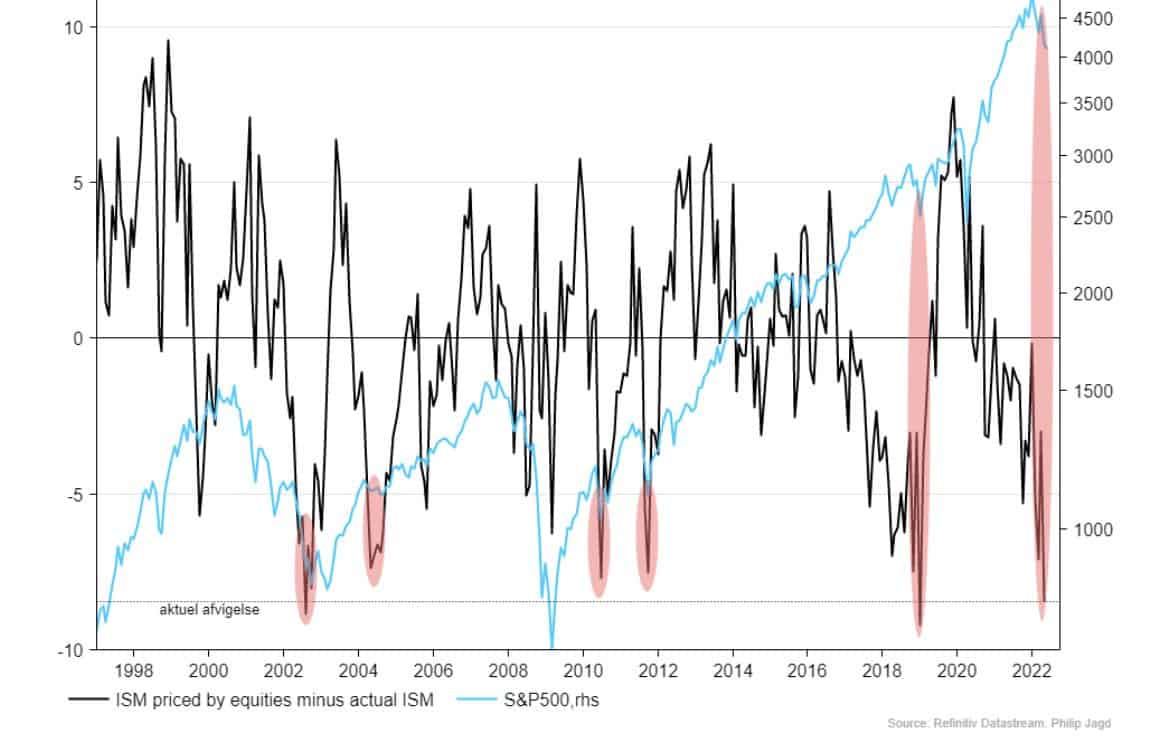
This bear has largely been driven by liquidity and a tightening Fed to date. And the market has already come off a good bit, relative to the move in the ISM. @PhilipJagd shared the following last week “Chart shows the difference between the ISM level priced by equities and actual ISM before todays print. The difference is unusually large and that often mean we are approaching a bottom in markets.”
- Clear as mud? Good, you should be. It’s a confusing environment. The cone of probabilities is wide. So closely manage your risk. Don’t overanchor to your opinions. And let the tape tell you where its headed (wait for setups).
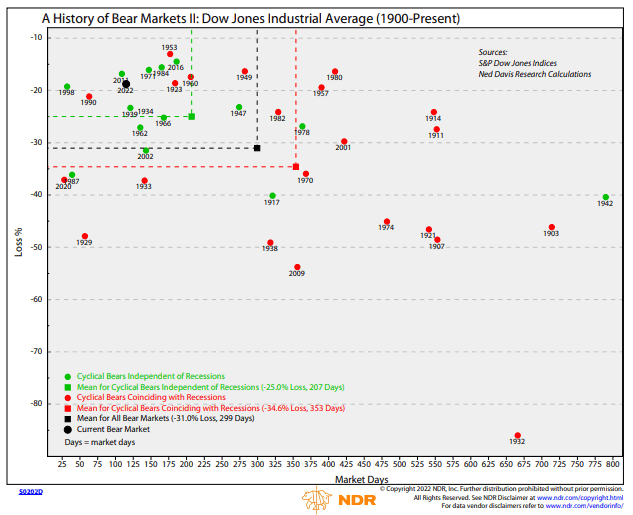
@markminervini shared this chart from NDR last week. He points out “The average non recession bear drops -25.0% over 9.1 months, vs. -34.6% over 15.3 months in recession. Over 50 yrs. the median non-recession bear fell -18.0% over 6.8 mos. If the economy avoids a recession, then the current decline is approaching the avg. for both time and price.”
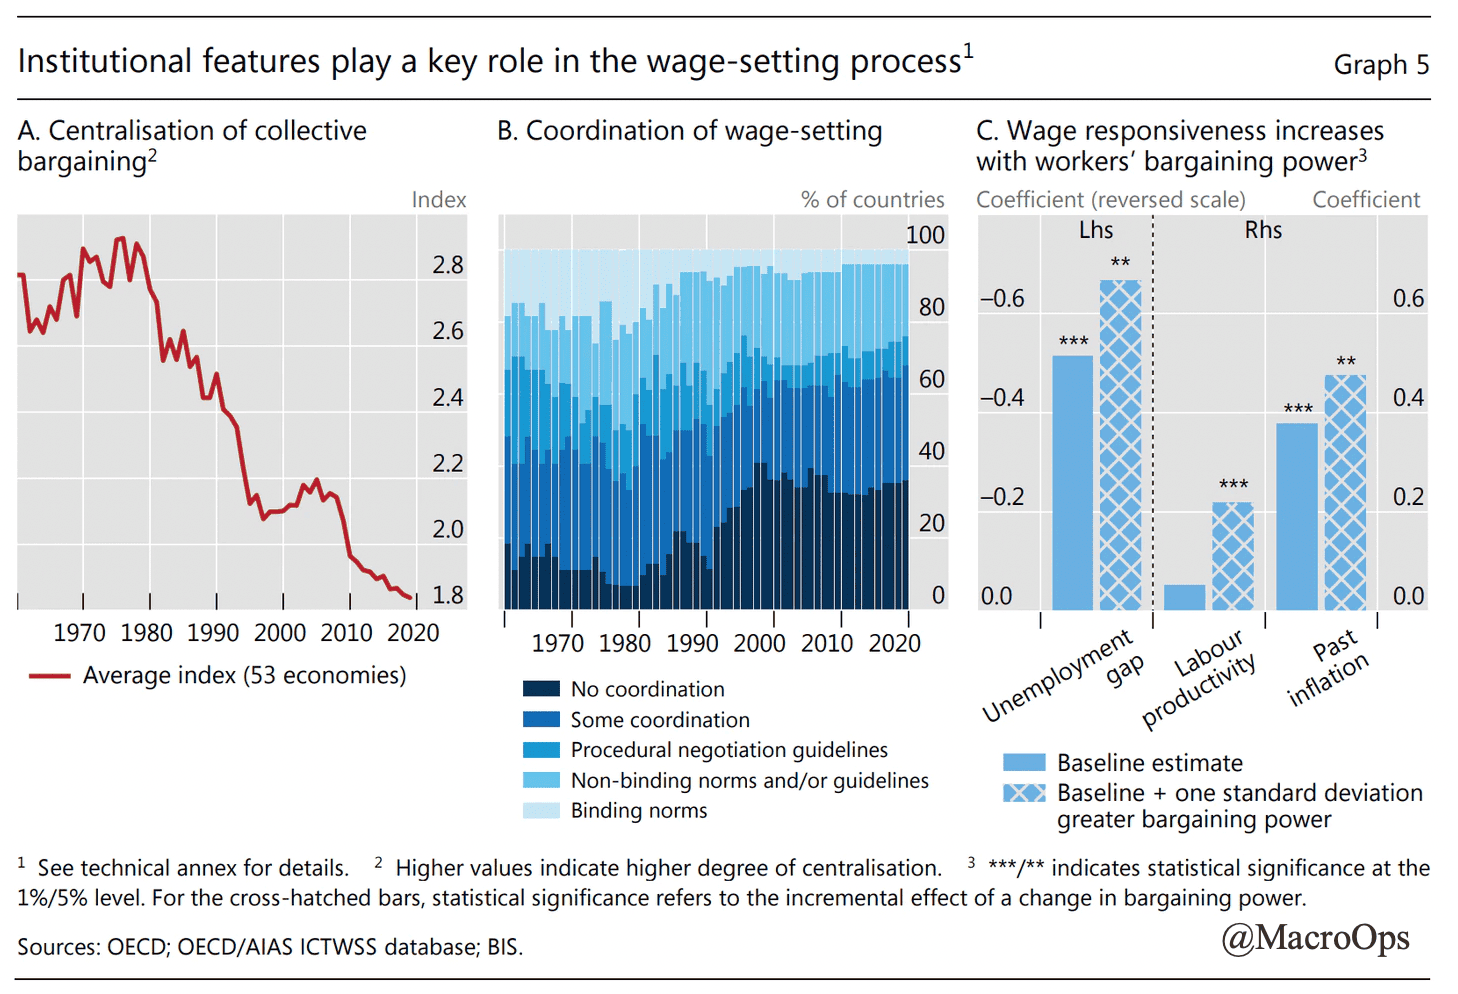
- I’m a big fan of Adam Tooze’s substack. In his most latest post, Adam discusses some of the BIS’s recent work on inflationary regimes. Here’s the link. One of the central points is around wage-price spirals. And how we need both price and wage setters (capital and labor) with roughly equal bargaining power in order to drive a classic wage-price spiral.
The charts from the BIS below show what a weaker position labor is in today relative to the 60s and 70s.
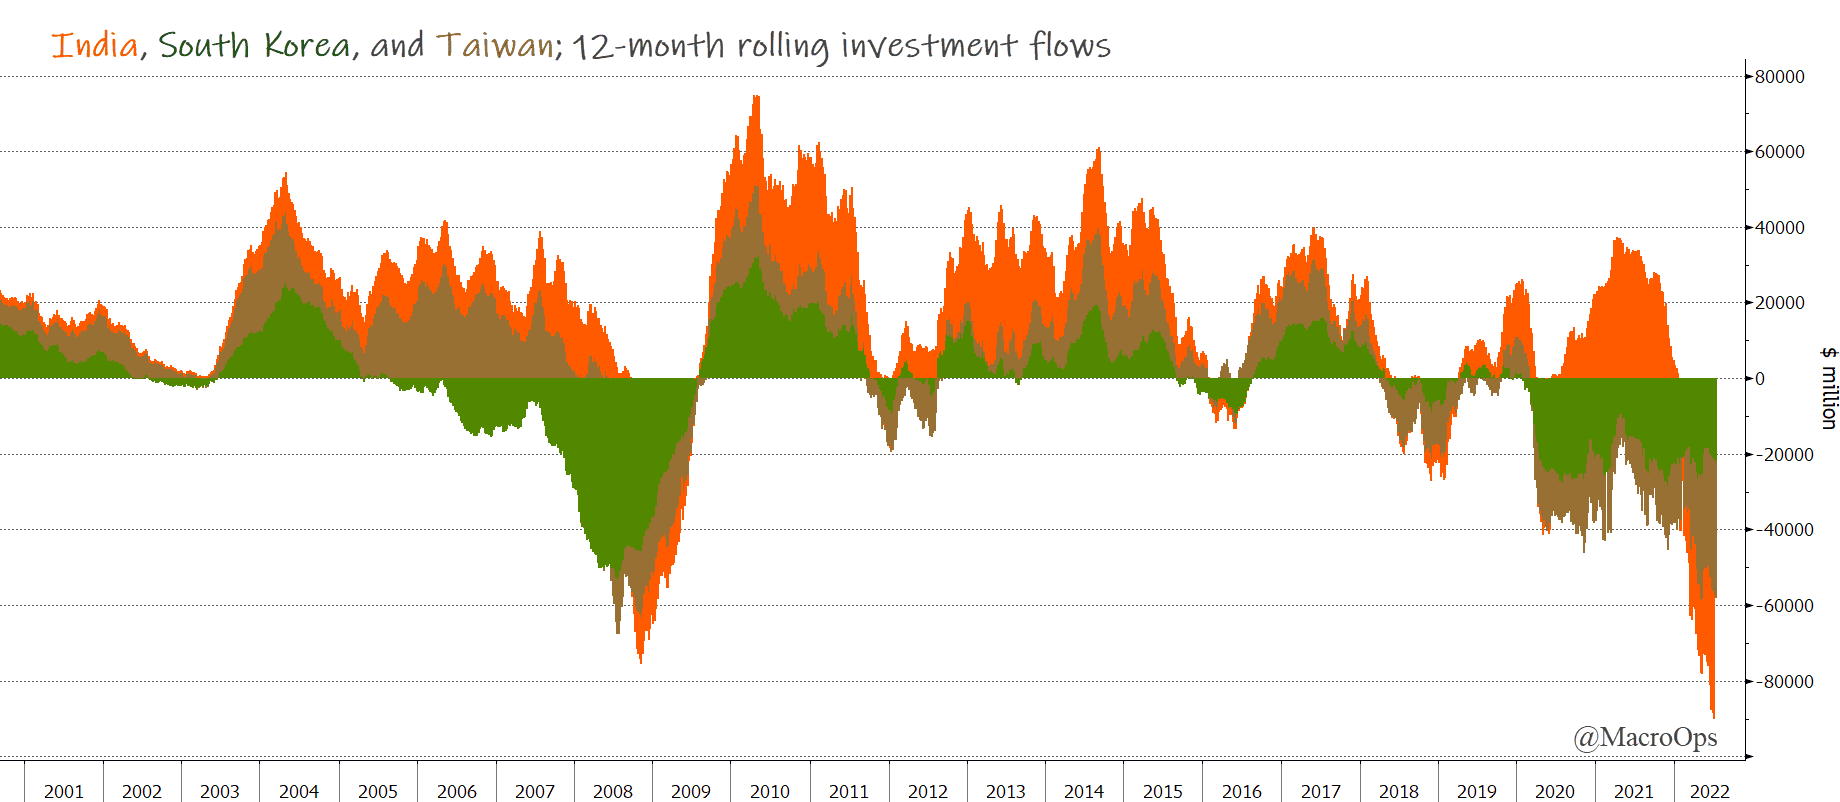
- 12-month rolling investment flows into India, South Korea, and Taiwan are at or below lows last seen at the height of the Great Recession.
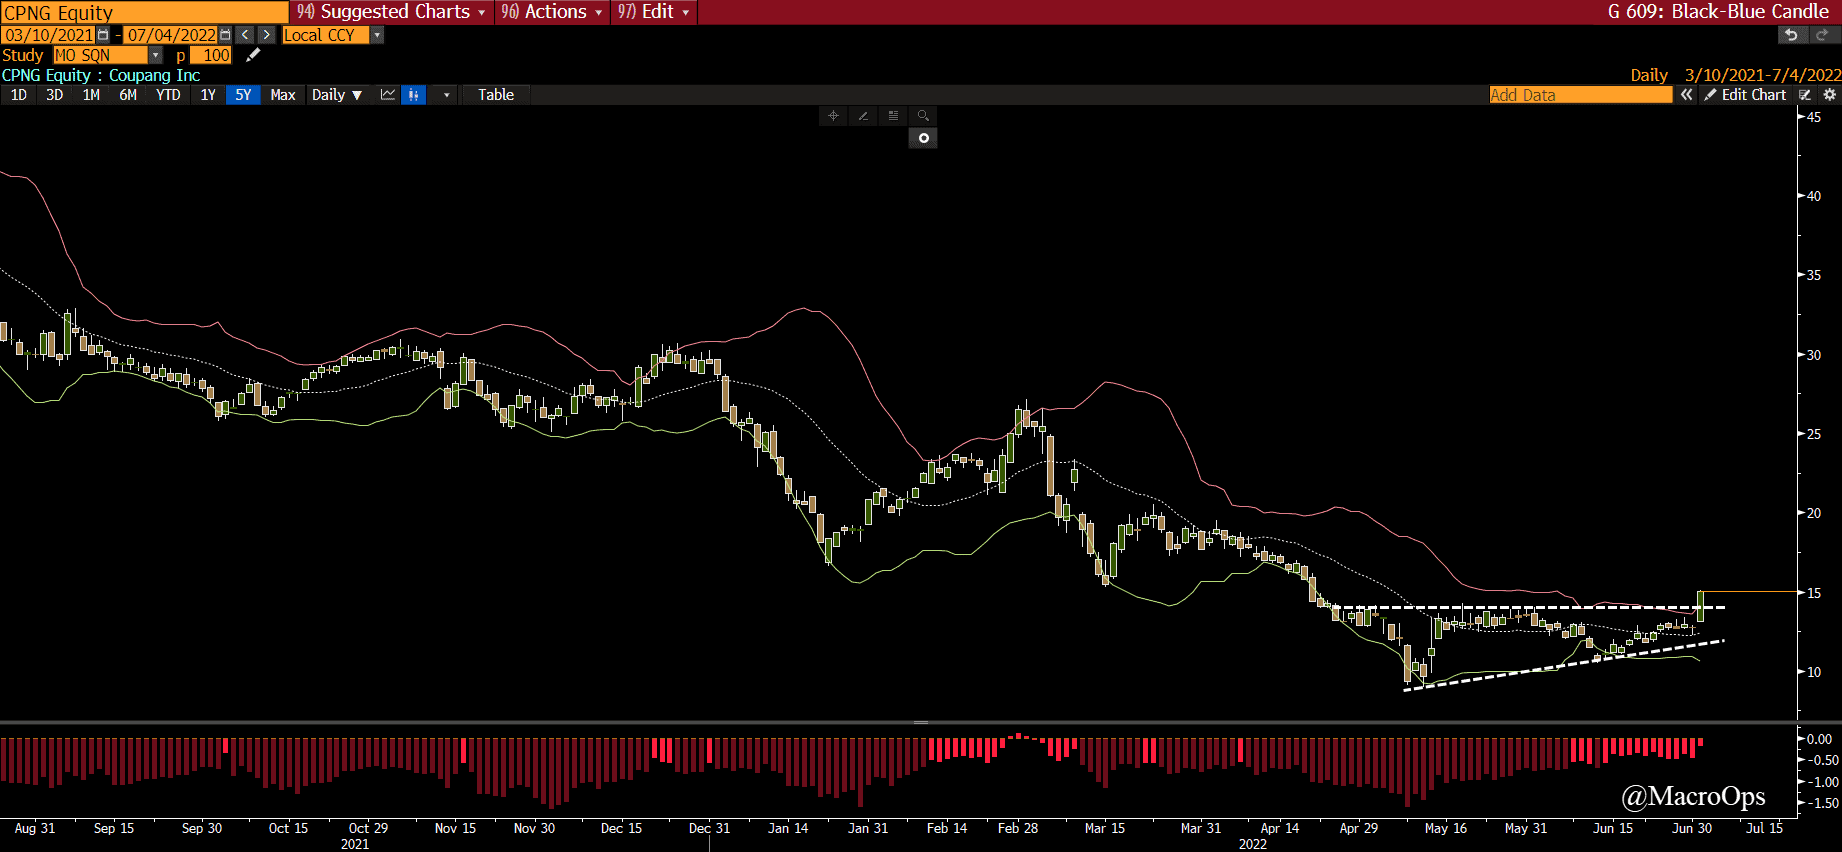
- Coupang, Inc. (CPNG), often referred to as the Amazon of South Korea. Broke out of a 3-month wedge bottom last week. The stock is down roughly 70% since it went public last year. I know a lot of smart guys buying this name (it’s Druckenmiller’s biggest holding and one he’s been adding to).
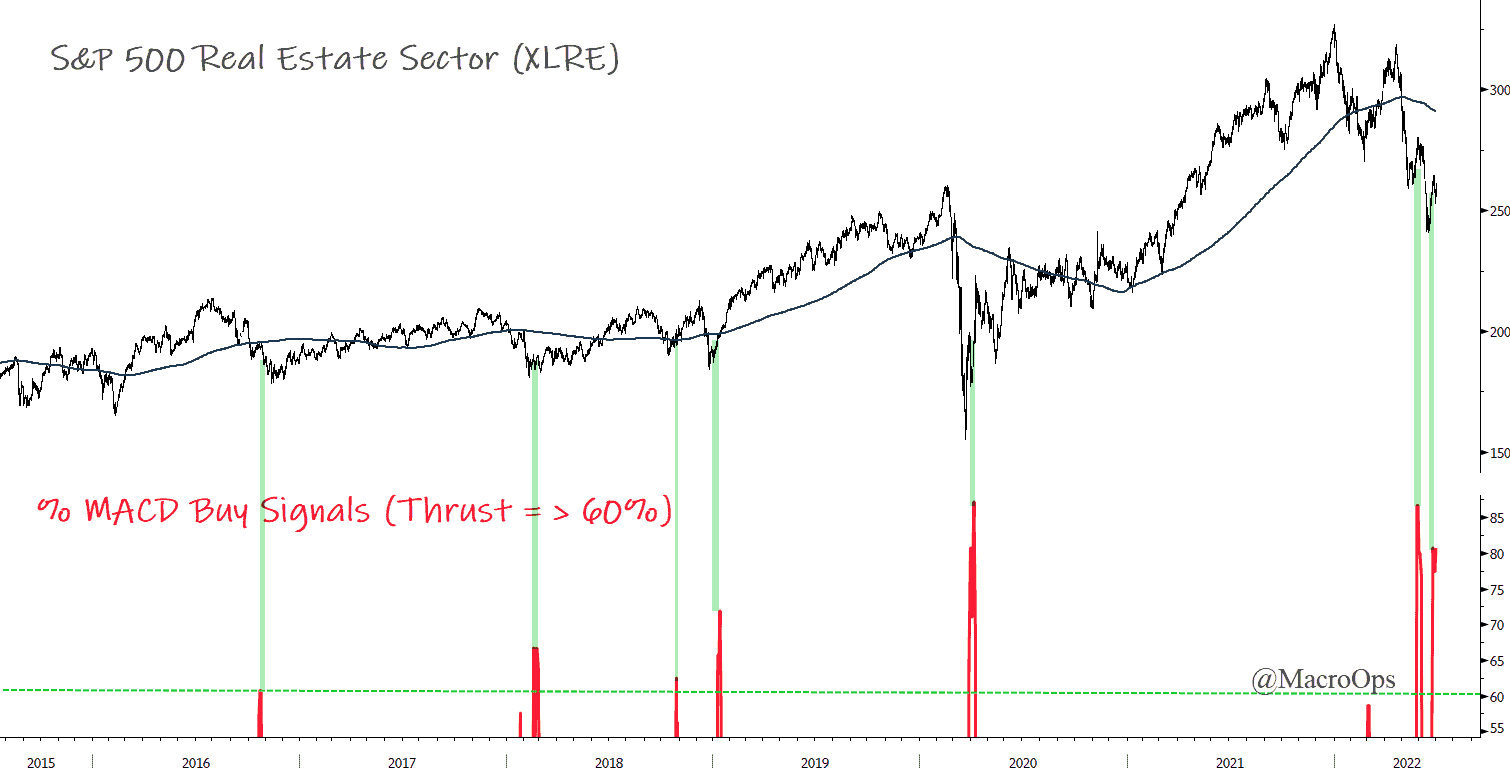
- Real Estate (XLRE) saw another breadth thrust (MACD % buy signal > 60%) last week. Past instances coincided with major sector lows. But I should point out that these thrust signals become less reliable in recessionary bear markets, which we might be in.
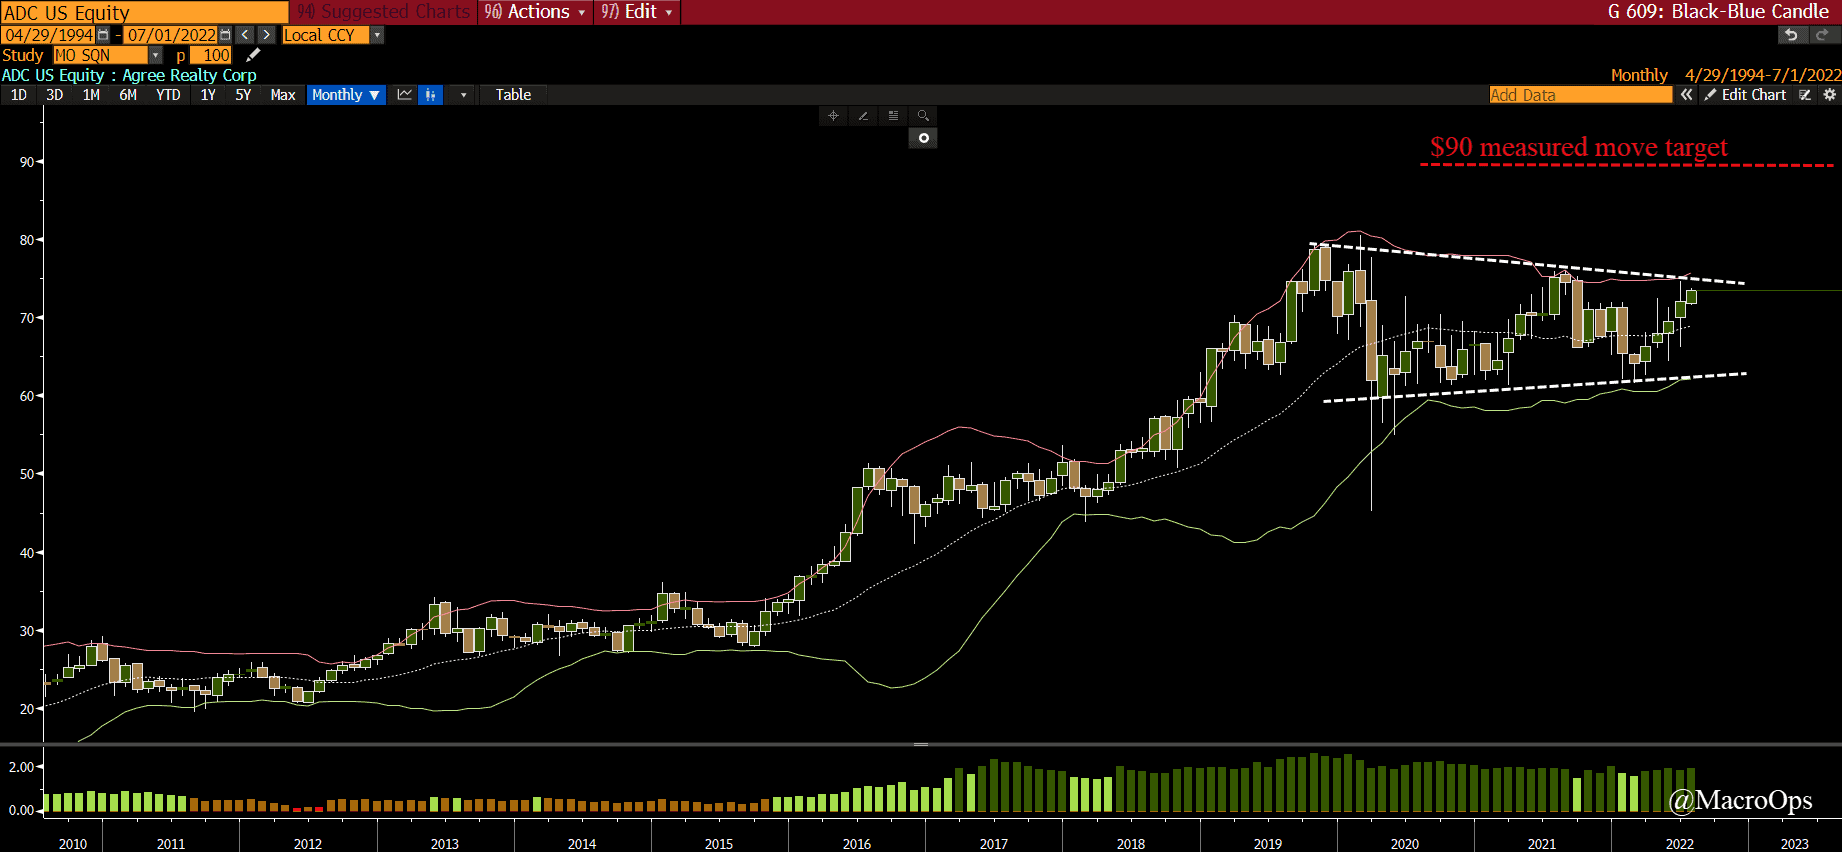
- But digging into the real estate sector we can find a number of good longer term setups. Below is Agree Reality Corp (ADC). ADC is a reit “engaged in the acquisition and development of properties net leased to industry-leading retail tenants.” The chart below is a monthly with a measured move target of $90 a share.
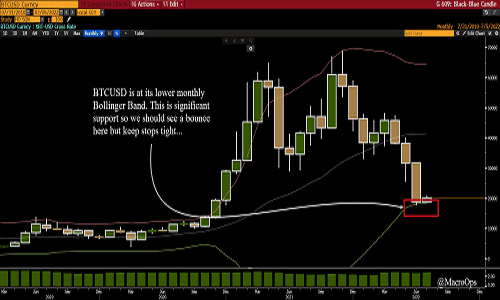
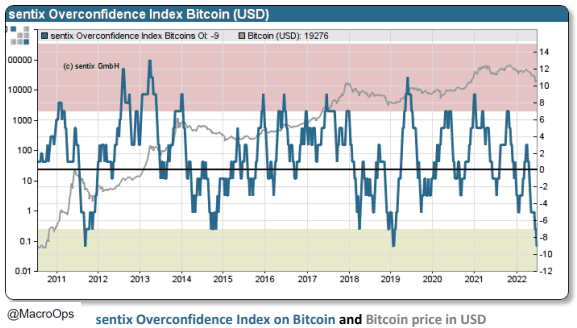
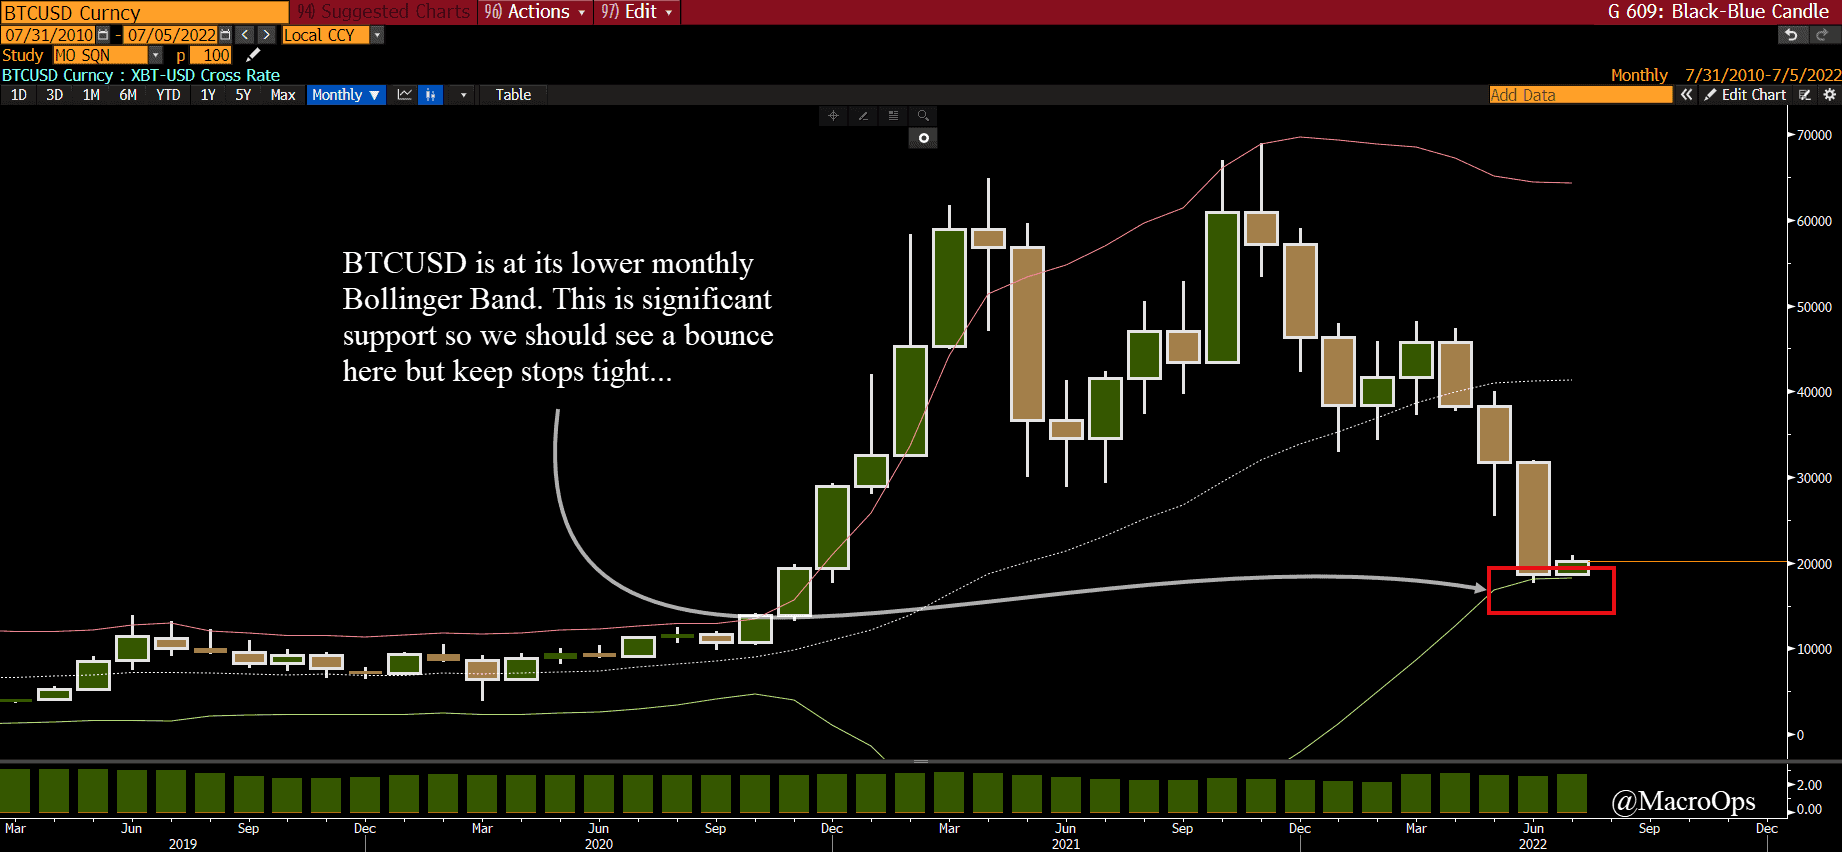
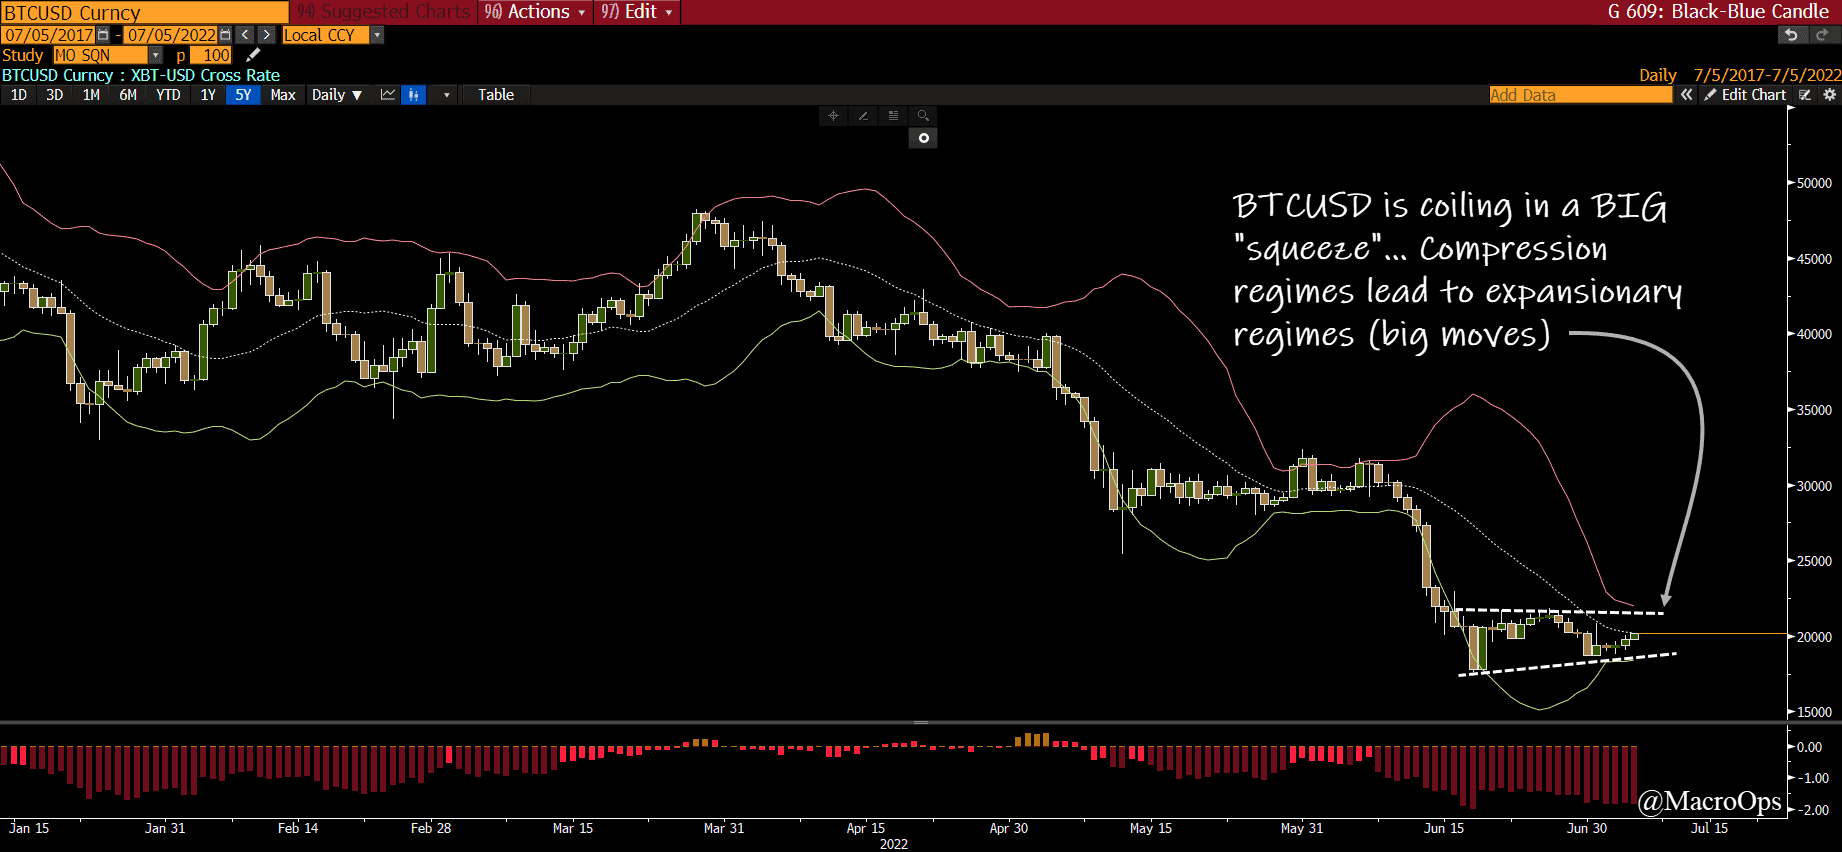
- A bitcoin setup in three charts (1) Sentiment: Sentix notes that Bitcoins Overconfidence index recently fell to a value of -9, a “comparable indication has been seen only four times in the last 13 years.” (2) Monthly chart shows BTCUSD at its lower band and (3) BTCUSD on a daily basis setting up in a major compression regime.
Thanks for reading.
Stay frosty and keep your head on a swivel.