The investment process is only half the battle. The other weighty component is struggling with yourself, and immunizing yourself from the psychological effects of the swings of markets, career risk, the pressure of benchmarks, competition, and the loneliness of the long-distance runner. ~ Barton Biggs
In this week’s Dirty Dozen [CHART PACK] we discuss the latest BofA Global Fund Manager Survey, talk about the persistent bearish reaction function that is bullish for stocks, go over the divergence between the no-landing consensus and priced in Fed cuts, and end with a look at a cheap EM along with an actionable way to play it.
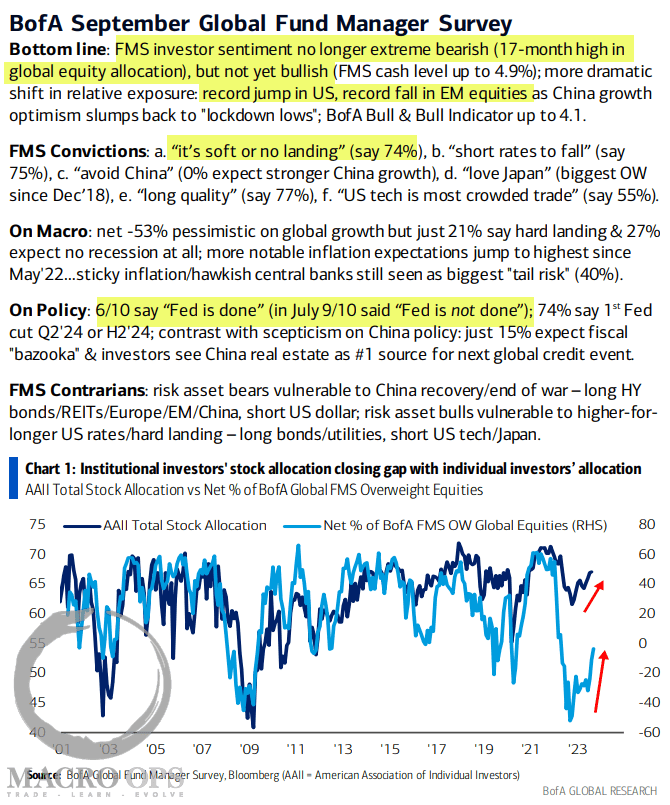
1. Summary of the latest BofA Global Fund Manager Survey with highlights by me.
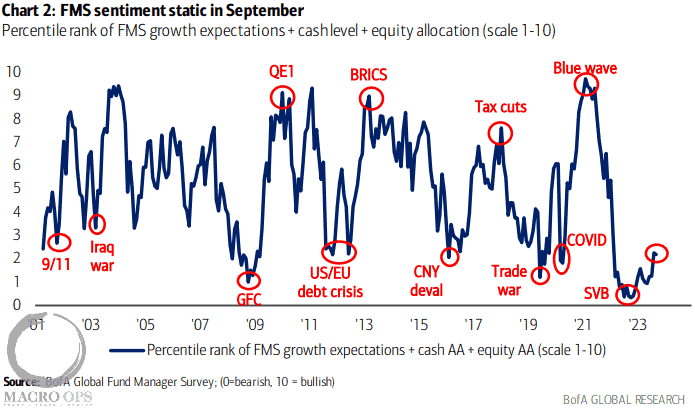
2. Another chart from the report. This one is a composite percentile rank of FMS expectations, cash levels, and equity allocations. As much as the narrative pendulum has swung in the direction of the bulls, there’s still plenty of room for it to swing further still.
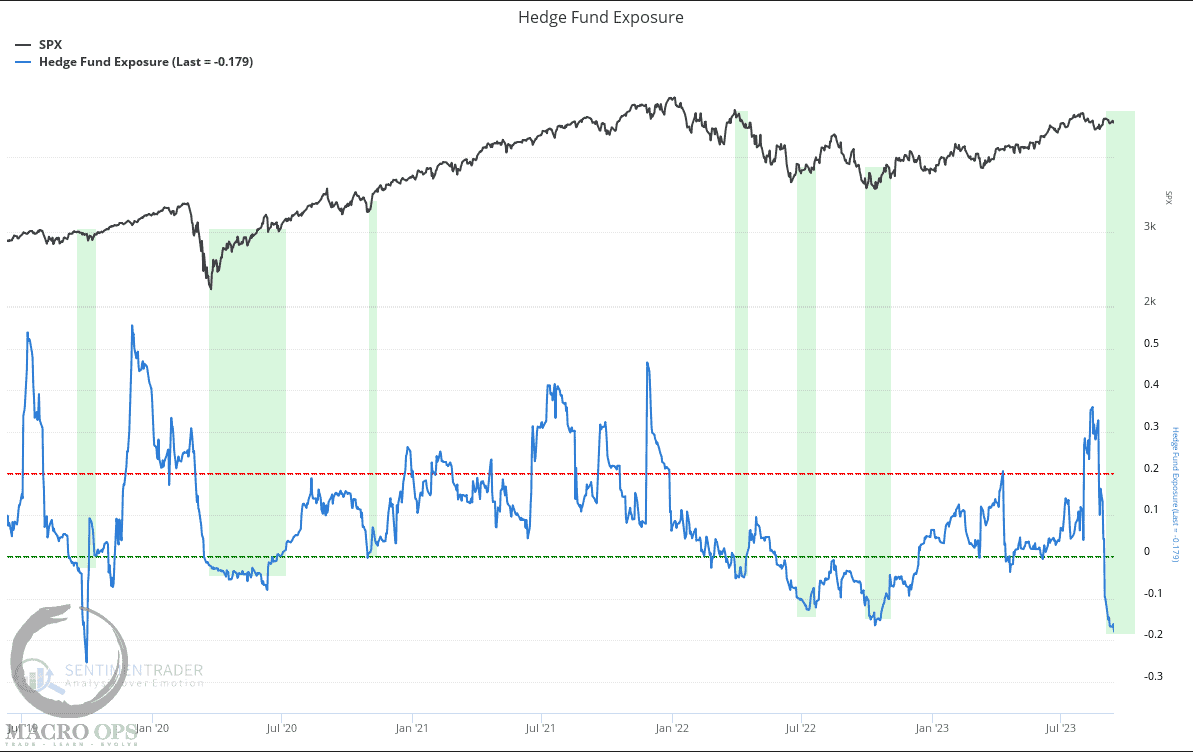
3. In that same vein, here’s the Hedge Fund Exposure index from SentimenTrader hitting fresh multi-year lows. I highlighted in green the last few times that HF positioning fell this much. An event that often corresponds to a bottom.
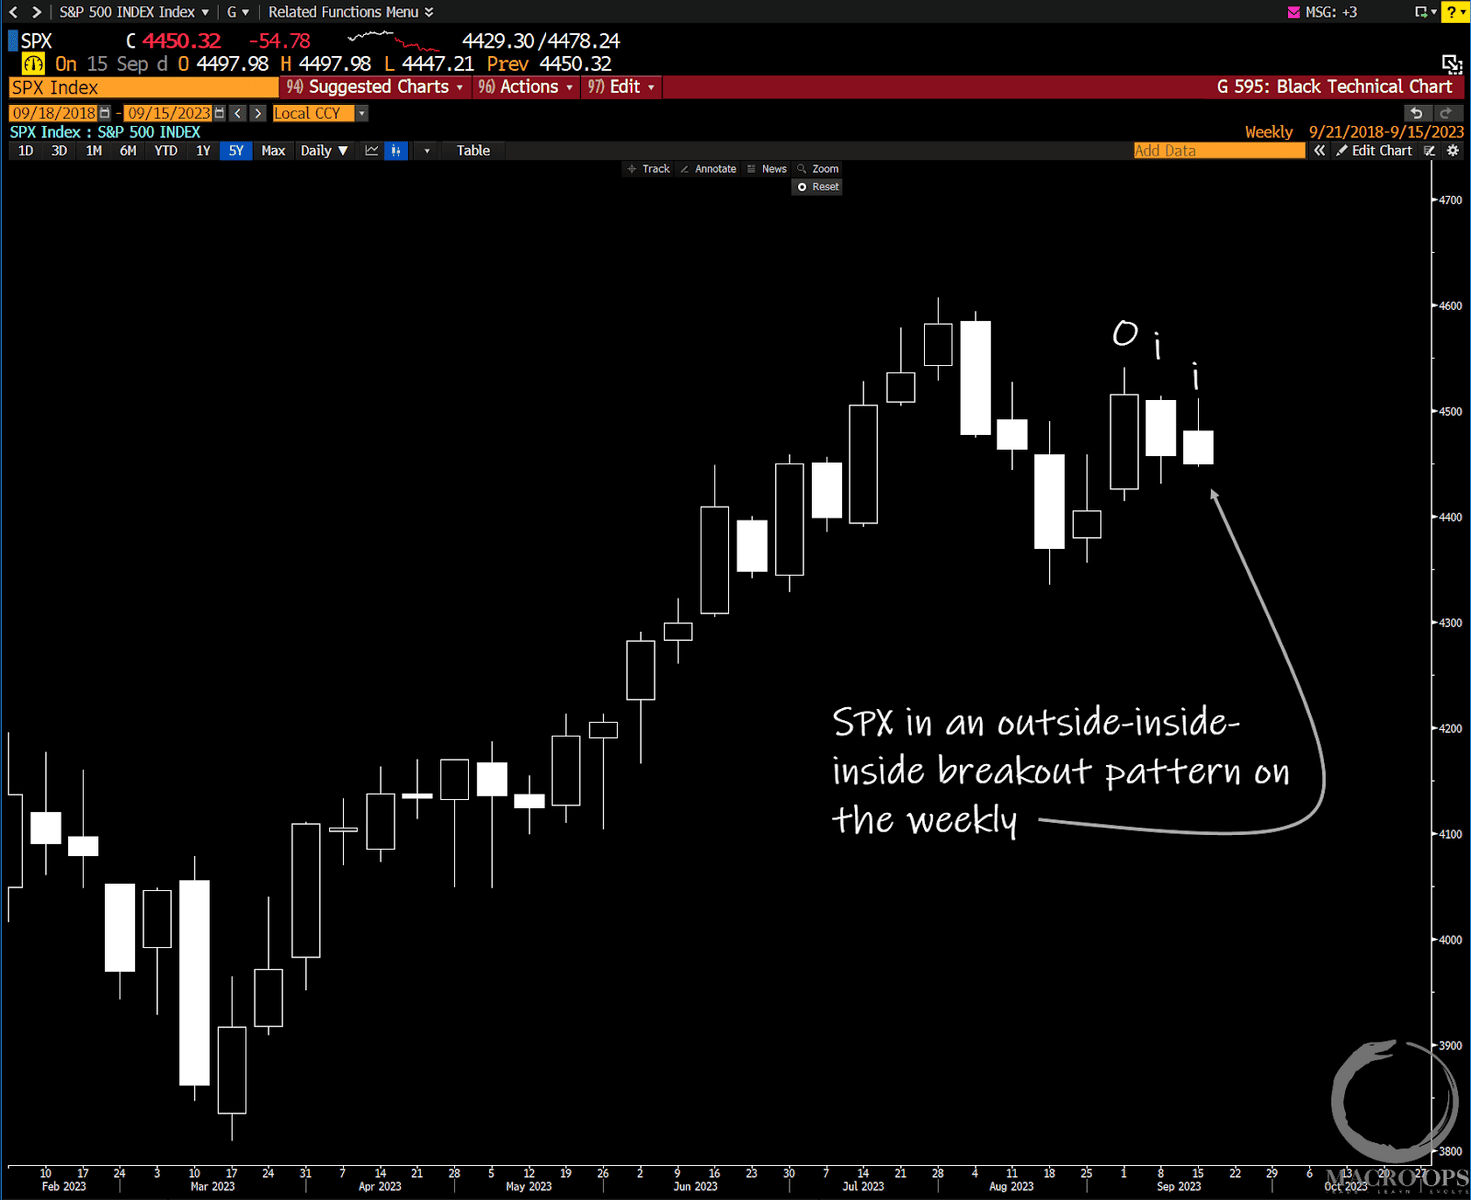
4. The SPX is in an outside-inside-inside (oii) breakout pattern on the weekly chart. This just means that the market is in a compression regime and compression regimes tend to lead to trends. The larger the compression the larger the subsequent trend.
It’s directionally agnostic but unless Powell drops a hawkish surprise this week, the odds favor a breakout to the upside.
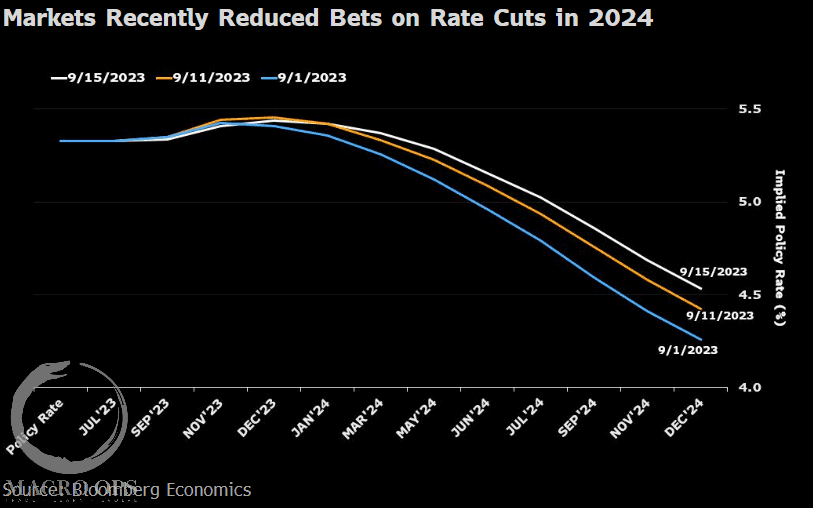
5. As per the BofA GFS above, it appears the majority of participants are now betting on no landing or soft landing scenarios for the economy. If either of these ends up becoming true then the 100bps in cuts that are currently priced into 24’, need to come in and be pushed further out in time, meaning higher for longer.
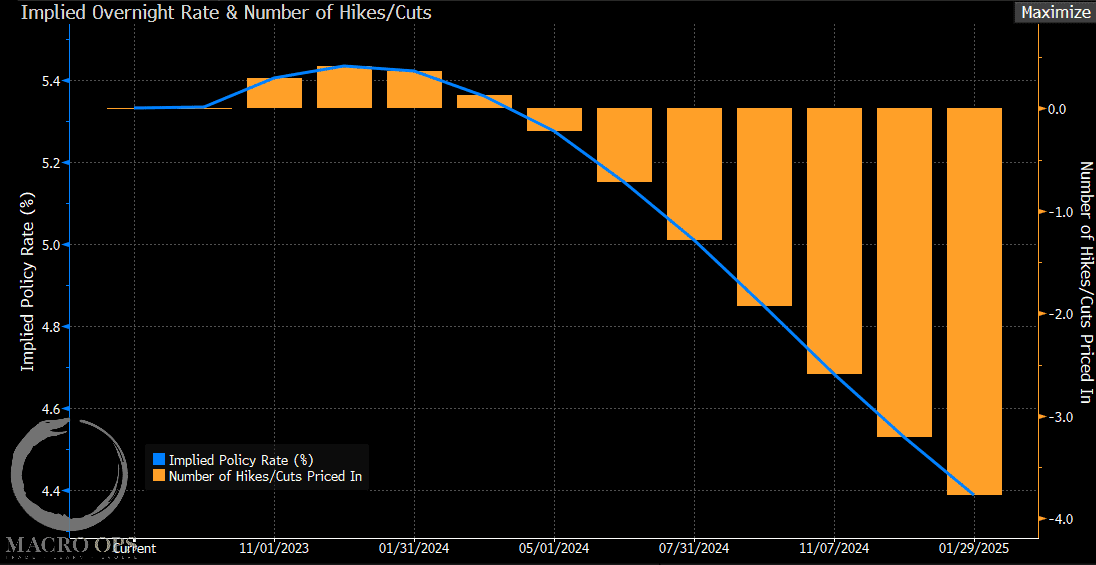
6. We’re starting to see the market move in this direction but it’s got a ways to go if it’s going to more closely reflect the consensus narrative.
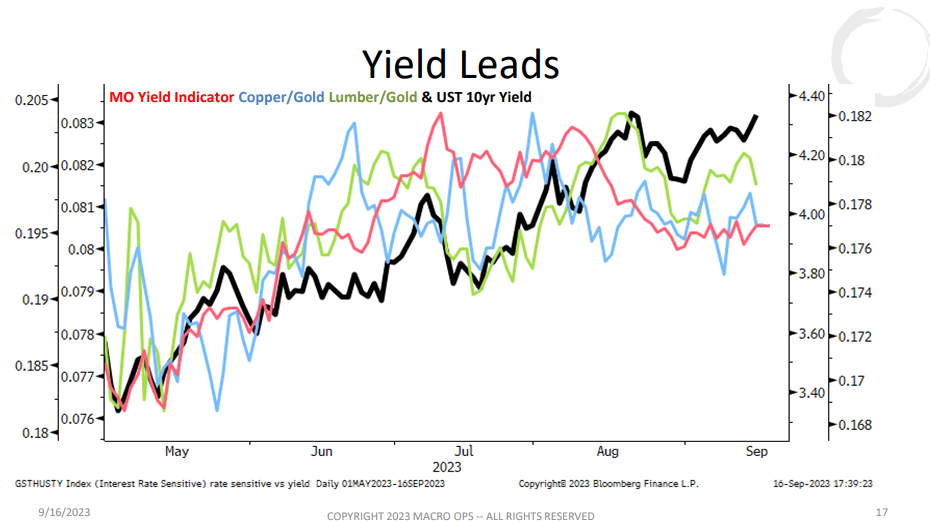
7. Our yield lead charts are trending sideways and so have turned neutral, not giving us much of a signal. But as the entire curve is in a Bear Volatile regime, we should expect that trend to continue for bonds down (yields up) until something catalyzes a change in trend.
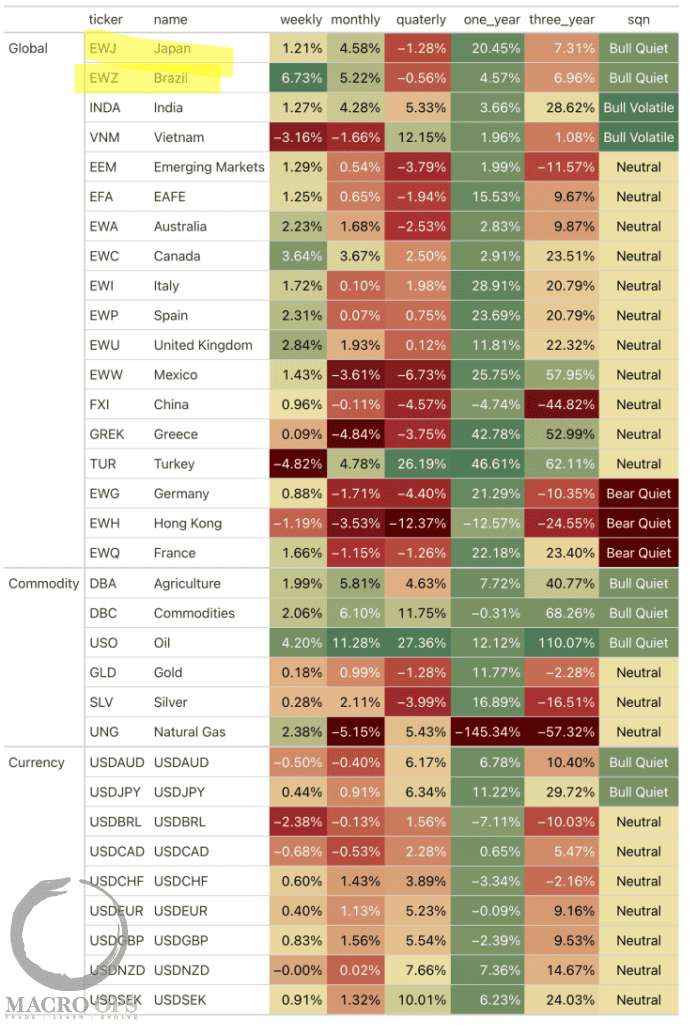
8. Brazil (EWZ) was one of the better performing global market last week.
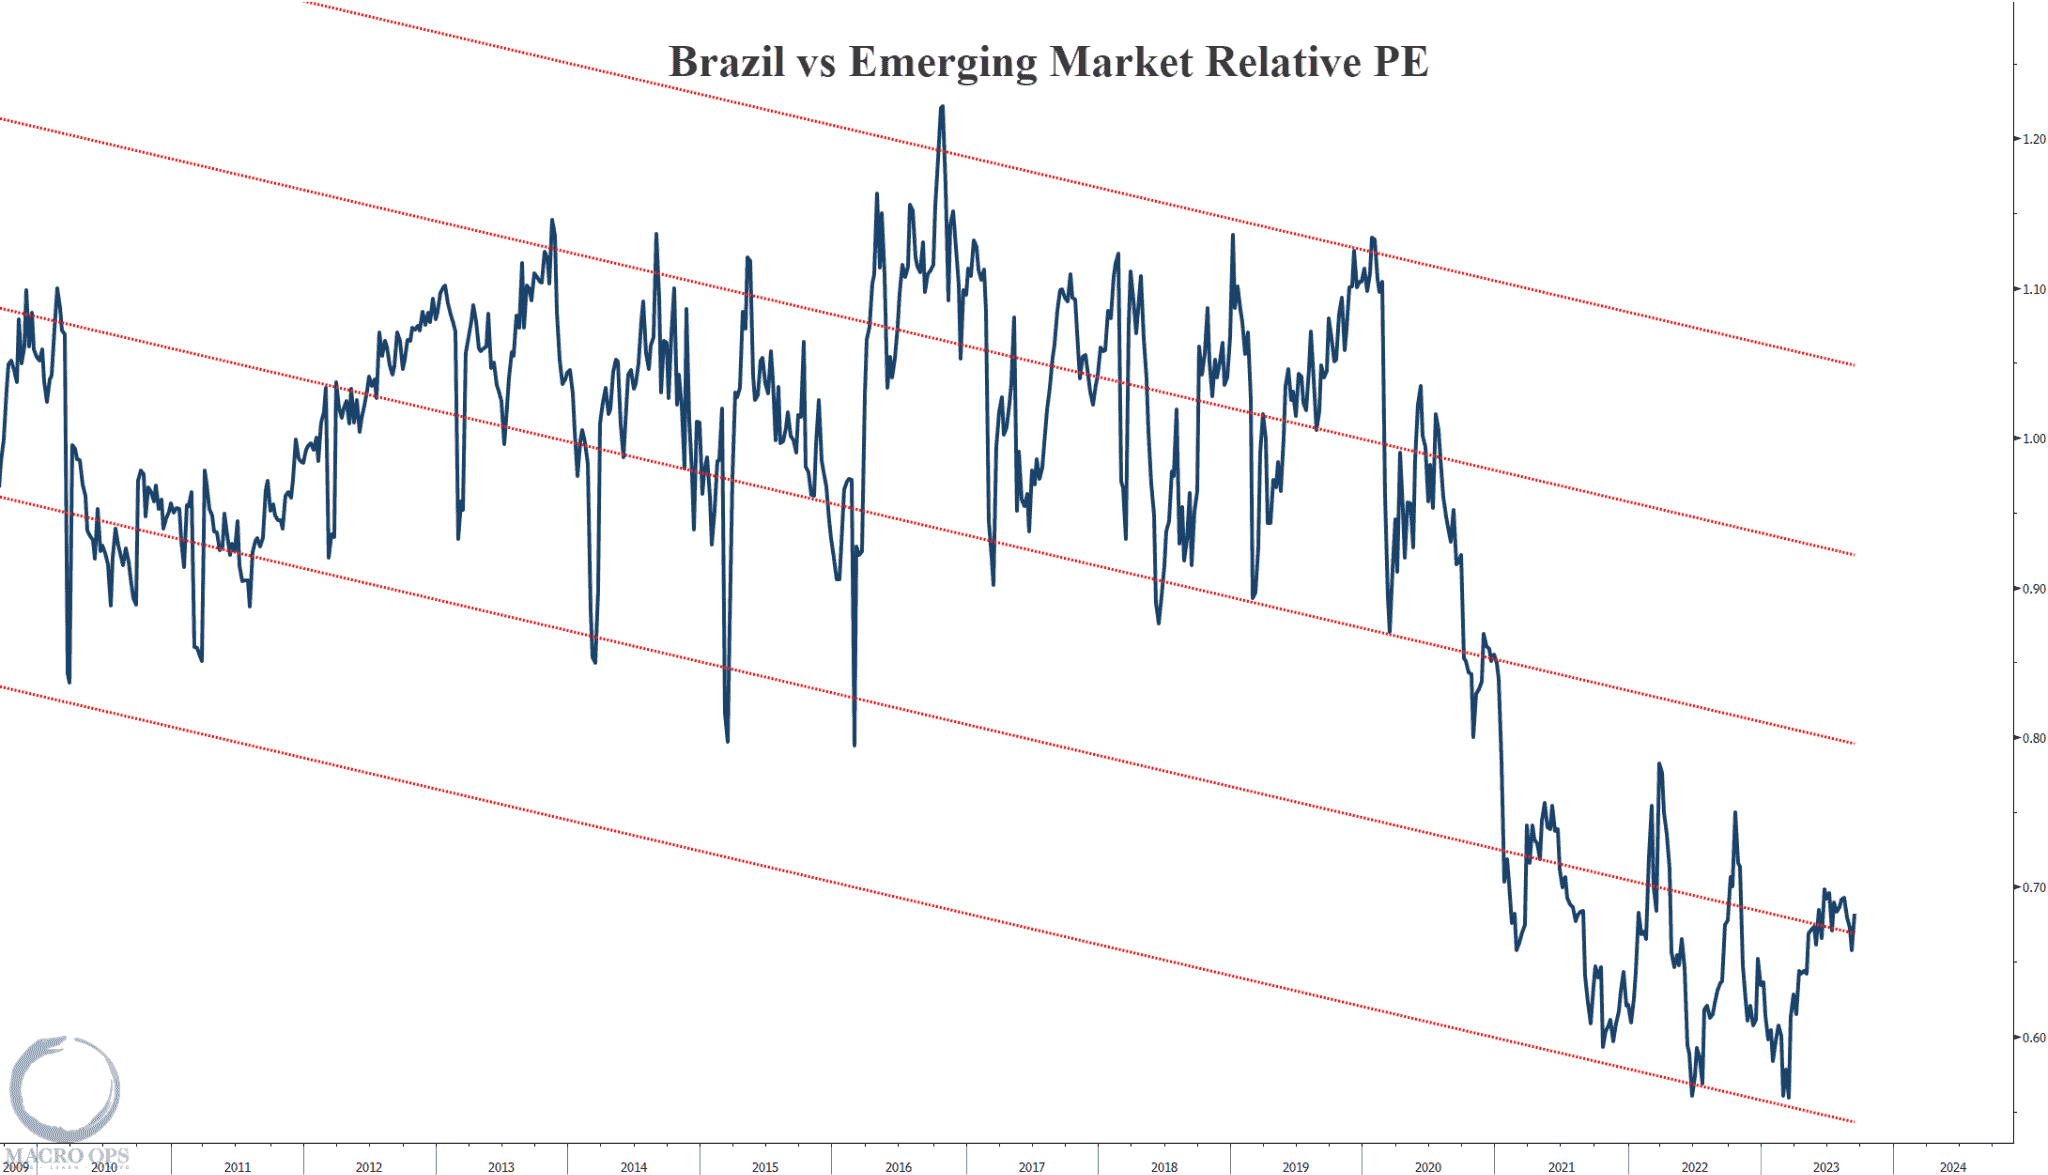
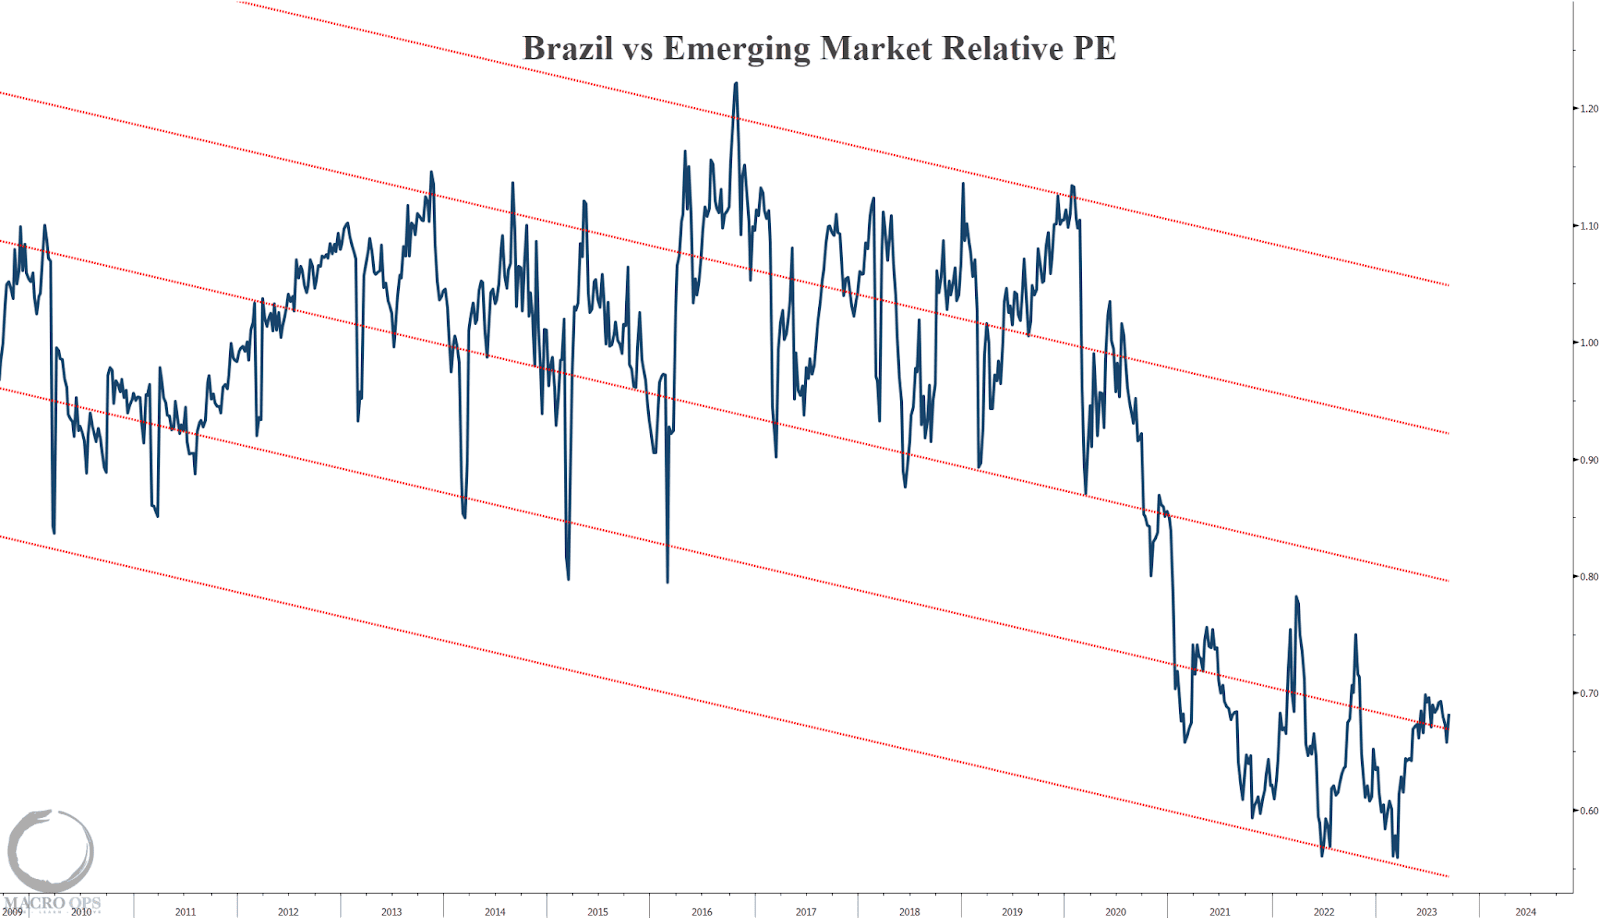
9. While FMS investors are dumping emerging markets at the “fastest rate in the survey’s history”, we at MO are starting to like select EM a bit more. Here’s Brazil’s relative PE to MSCI Emerging Markets, where it trades near a historical discount to the index.
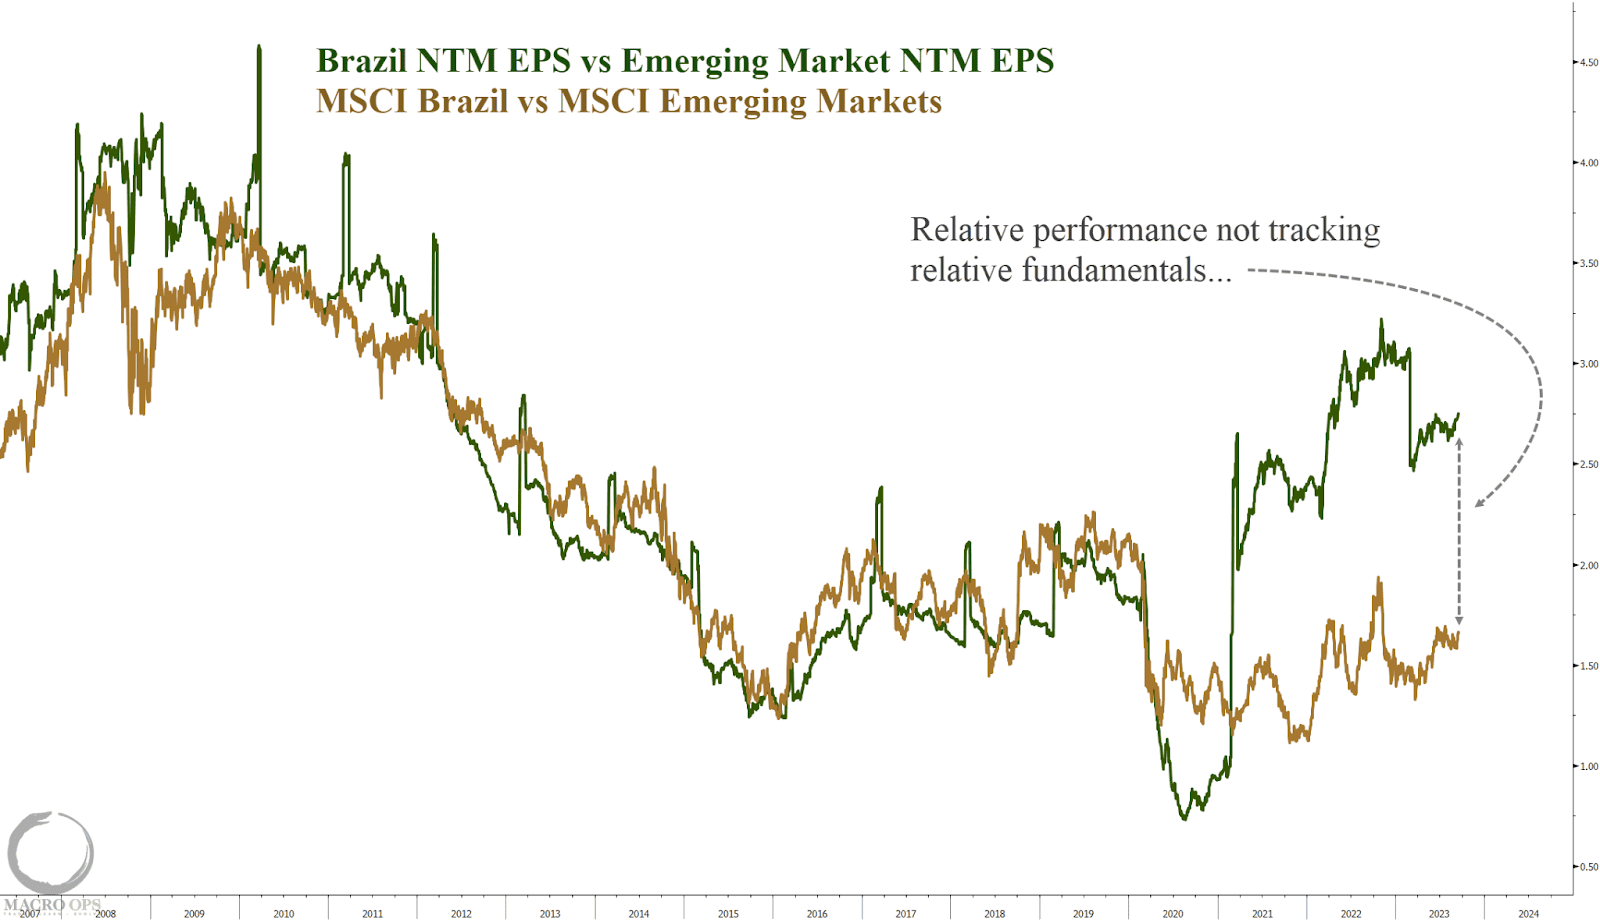
10. While at the same time, its relative fundamentals continue to improve and diverge higher from its relative price performance. Looks like everybody is too focused on adding more of the Magnificent 7 to their ports to care…
11. Here’s the breakdown of EWZ’s holdings via Koyfin which has become our preferred tool for looking at markets.
.
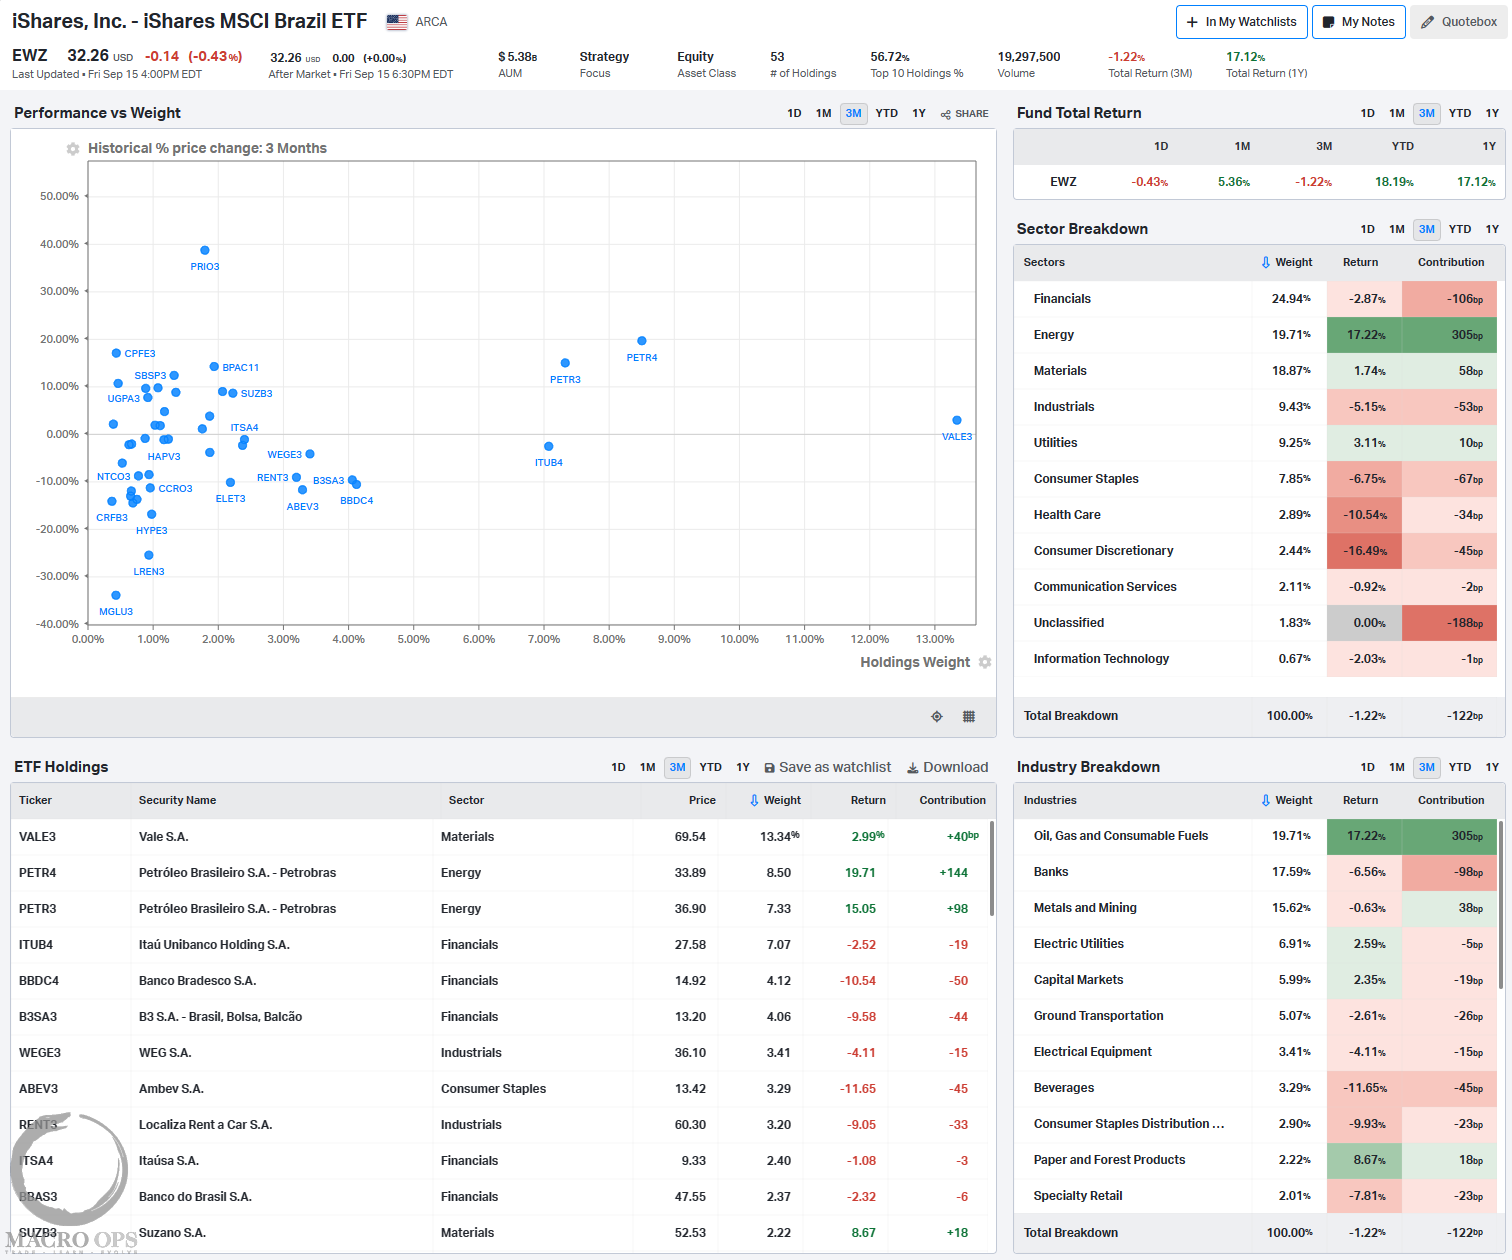
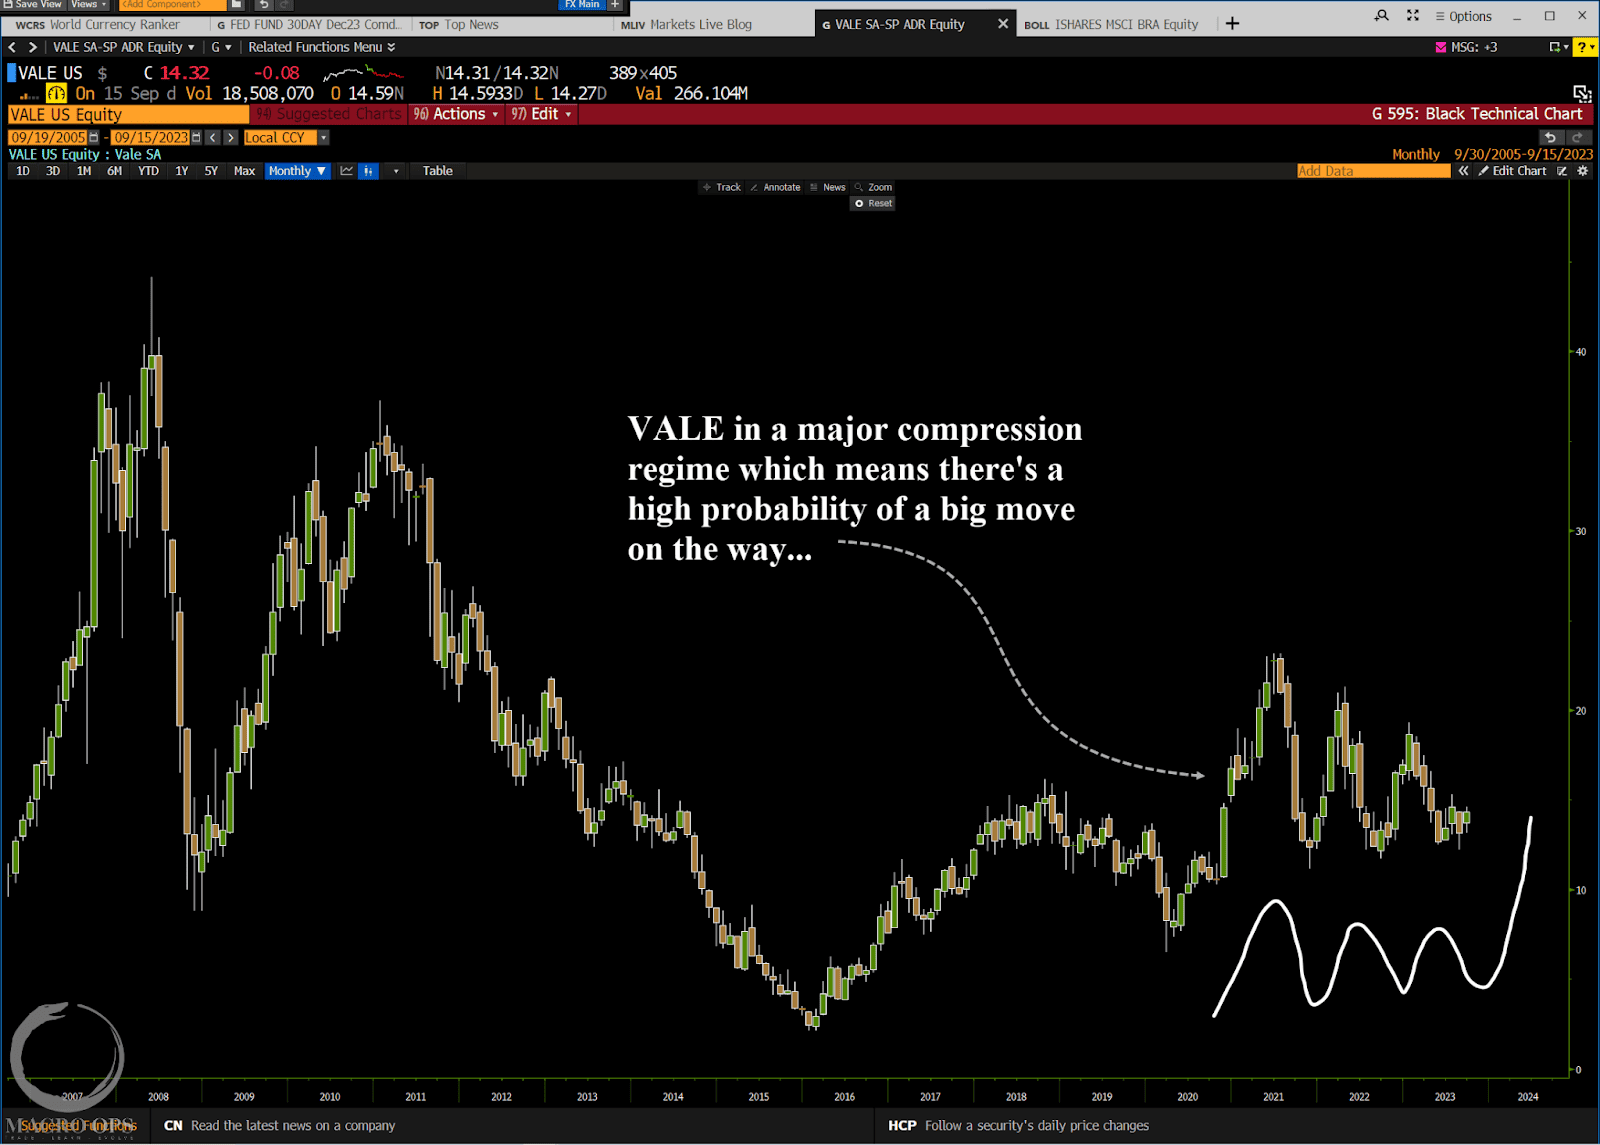
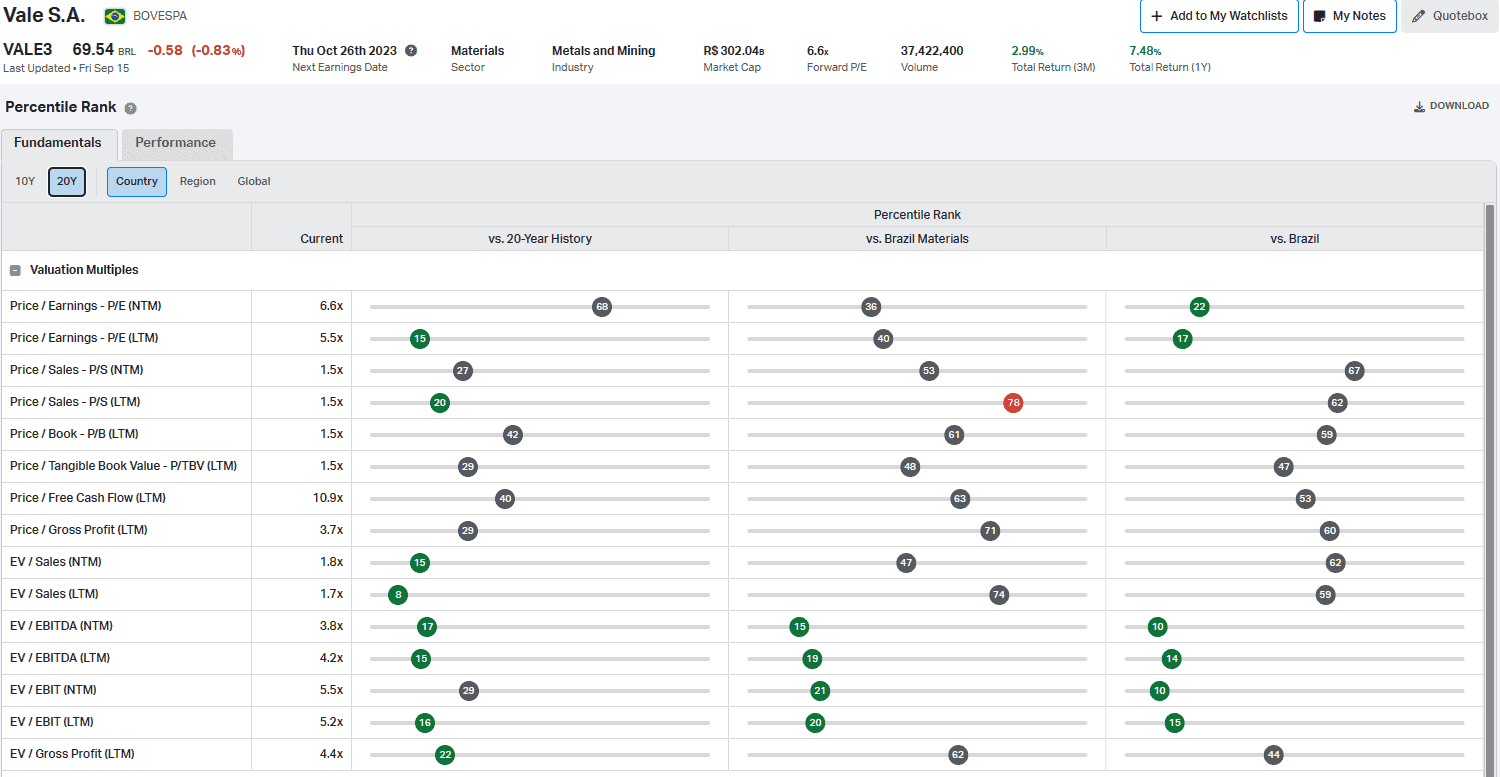
12. The largest weight in the index is EWZ which makes up 13% of the index. VALE is a global producer of metals. It’s trading cheap, in the sub-20th percentile of its 20-year history, for most valuation metrics (see second chart below, also from Koyfin).
We haven’t looked at the name in a while. And we have other names we like more in Brazil. But its chart is in a coiling compression regime (chart below is a monthly). And it looks like it’s getting ready for a big move.
Thanks for reading.


