When the California residential home market collapsed, the market thought the company might go broke, but it survived the test and we made a fortune. That is when I made the rule that one should own stocks when they have successfully passed a difficult test, but one should avoid them during the test — something that is easier said than done. ~ George Soros
In this week’s Dirty Dozen [CHART PACK] we look at the market passing an important test, the positively boring picture in margin debt, more signs of stubborn bears, positive and negative CAPEX cycle trend, deteriorating UST liquidity, and two tech stocks with recent breakouts, plus more…
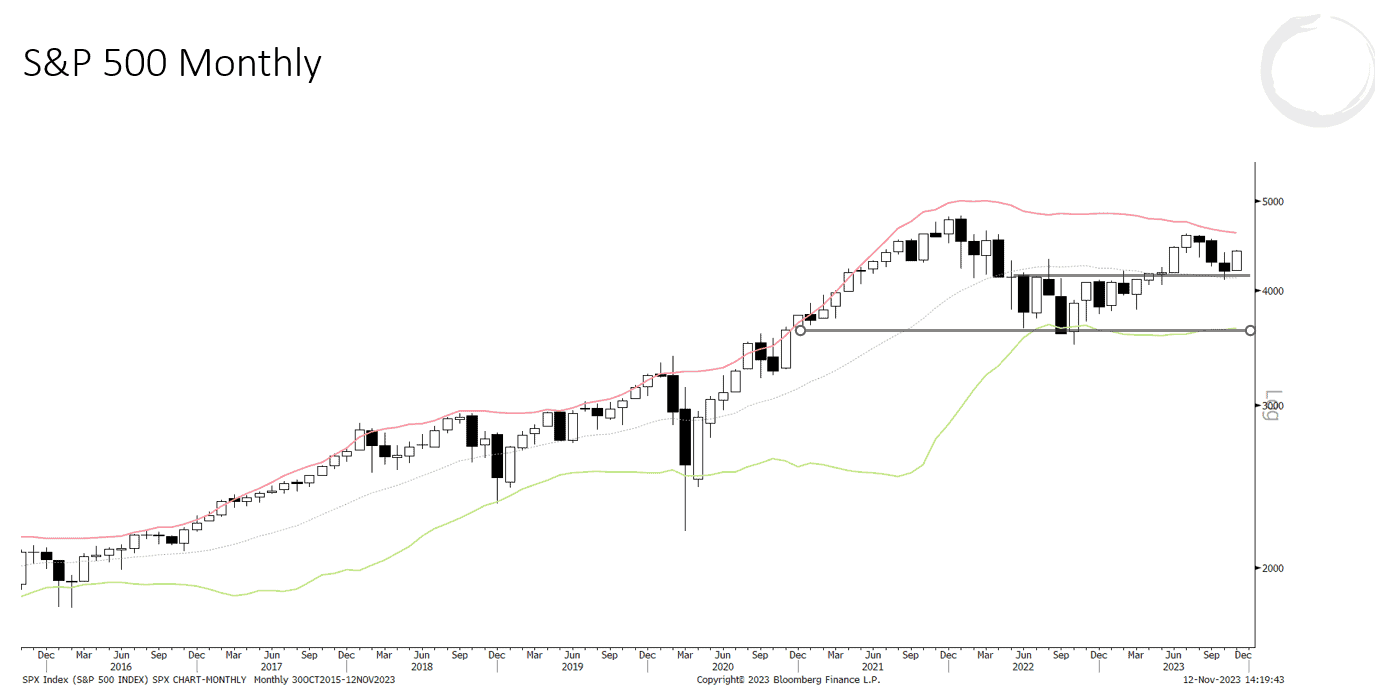
1. The SPX’s previous breakout from its monthly range was tested the other week. It passed the test. The trend has been strengthened as a result.
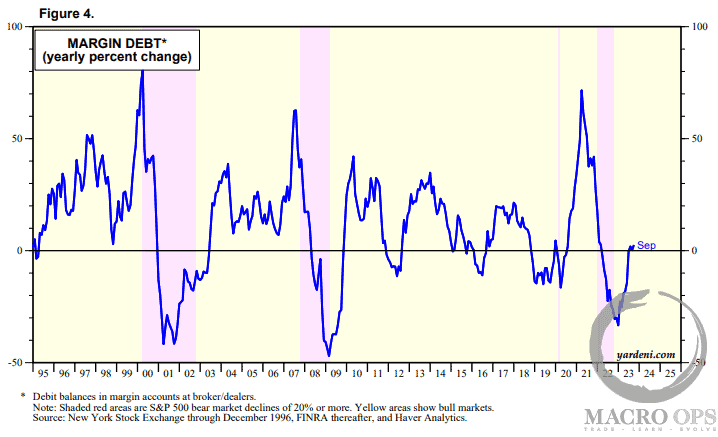
2. There’s an old saying in markets that you can’t commit suicide jumping out of a basement window. Well, one indicator I like to track is the YoY change in margin debt. This is a meaningful data point because cyclical bears are typically preceded (caused) by investors leveraging up and getting out over their skis. This eventually causes a feedback loop of forced derisking once a fundamental catalyst appears, which then creates a bear market.
YoY margin debt is currently flat… this is maybe not the basement but certainly no higher than the first story (chart via Yardeni).
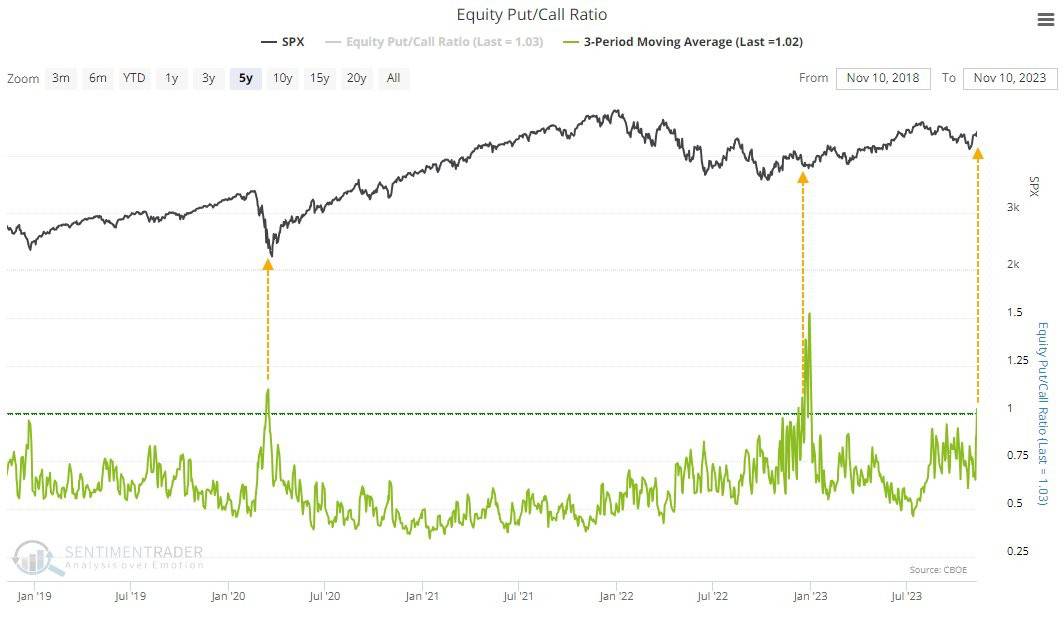
3. @jasongoepfert shared this chart of the panic buying we saw last week in puts. He wrote the following:
Fighting the rally much?
Over the past 3 sessions, equity options traders turned over more puts than calls.
That’s only been exceeded twice in the past five years.
Over the past 25 years, readings above 1 preceded two-month gains in the S&P after 26 out of 29 days.
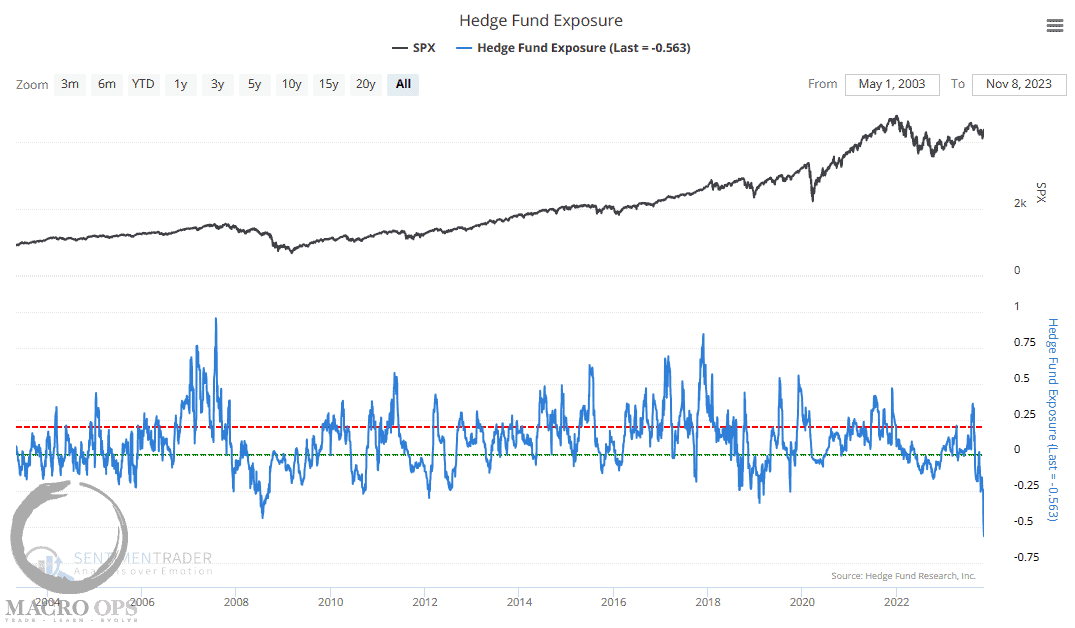
4. And what the hell has been going on with hedge fund exposure? It’s fallen to its lowest levels ever. I’m not sure if this is a data error or not but these guys typically have a habit over being very wrong when there’s a strong consensus as there appearst to be now (chart via Sentimentrader).

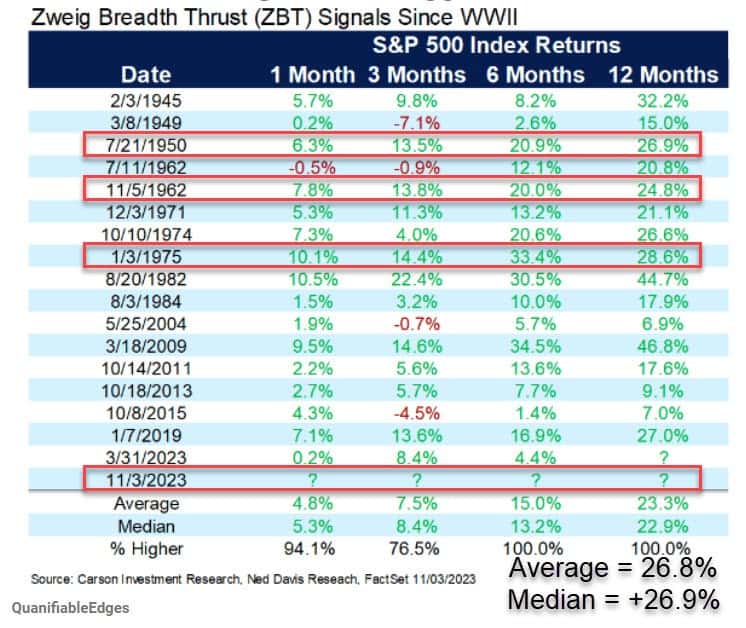
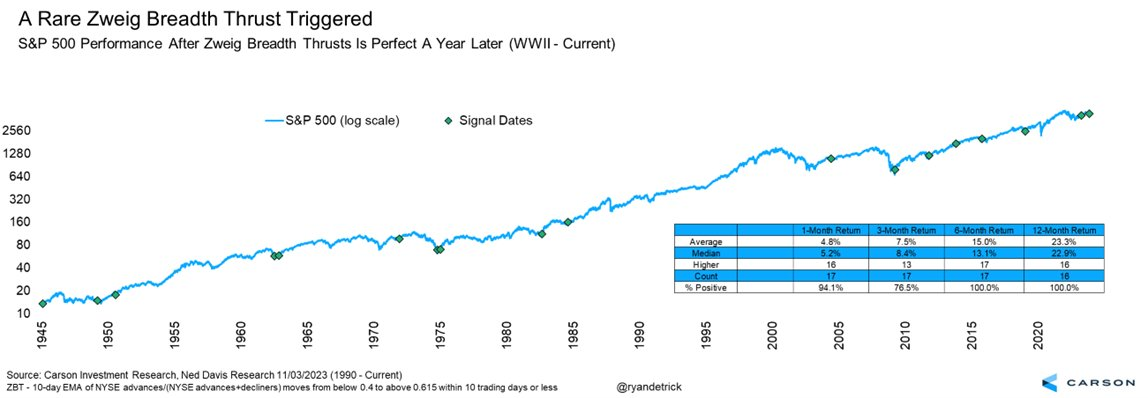
5. Quantifiable Edges pointed out that second Zweig Breadth Thrust within an 18-month window, as we just saw the other week, leads to even higher forward 12m returns on average than the first Zweig Thrust.
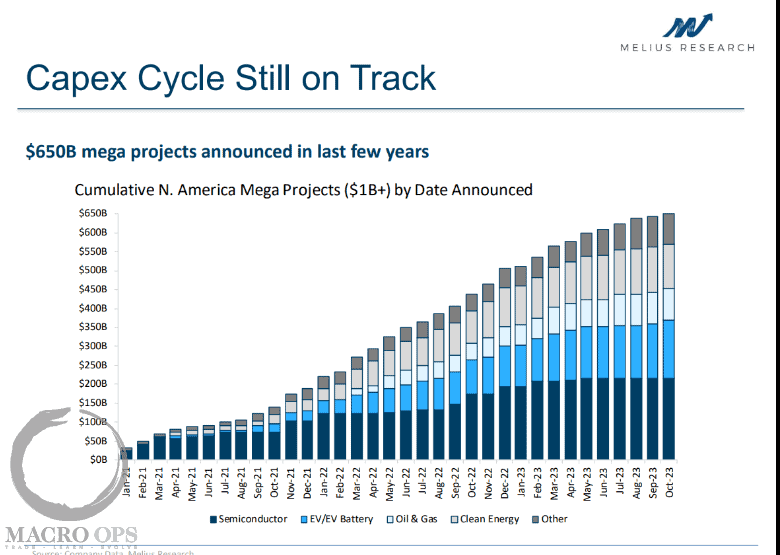
6. According to BBG, the “US is on track to build a new data center every month” and a combination of “demand growth and practical realities is driving a significant portion of the $650 billion of so-called mega-projects announced since the start of 2021.”
With US manufacturing construction spend at relative multi-decade highs and companies once again investing generously in US based production, it’s clear that we’re in an entirely new world from the one we’ve been in for the last two decades.
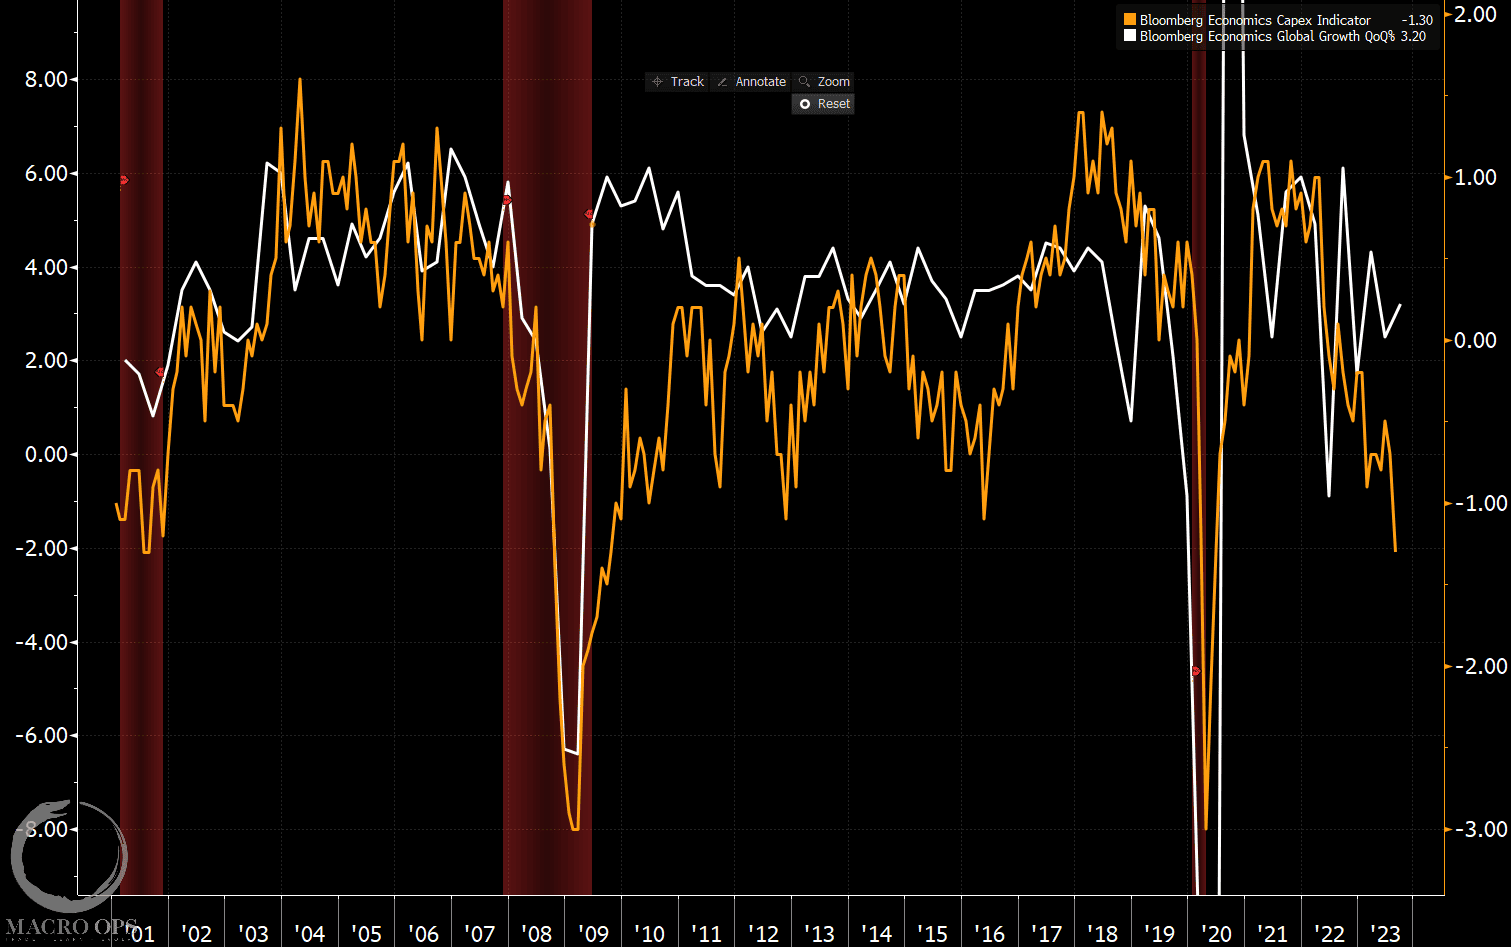
7. At the same time, Bloomberg’s Global CAPEX indicator (orange line) is collapsing to levels that have preceded recessions in the past (global QoQ% growth in white).
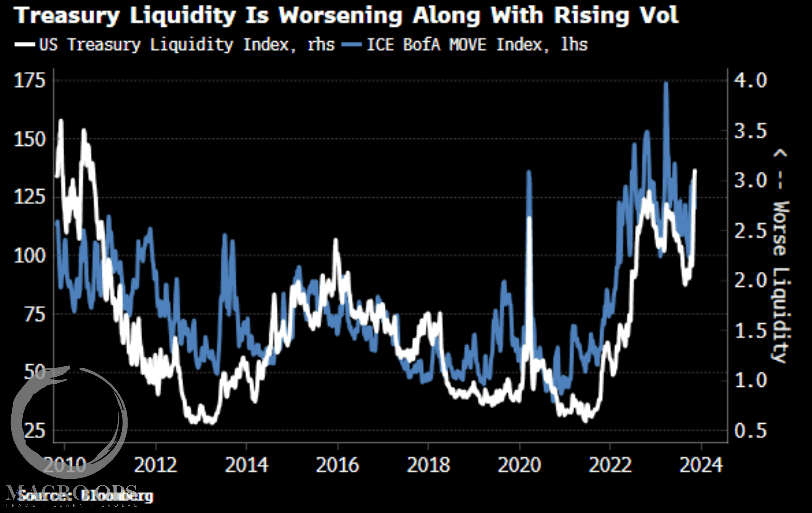
8. BBG’s Simon White recently pointed out that Bloomberg’s treasury liquidity index is worsening and now sits at its worse level since 2011.
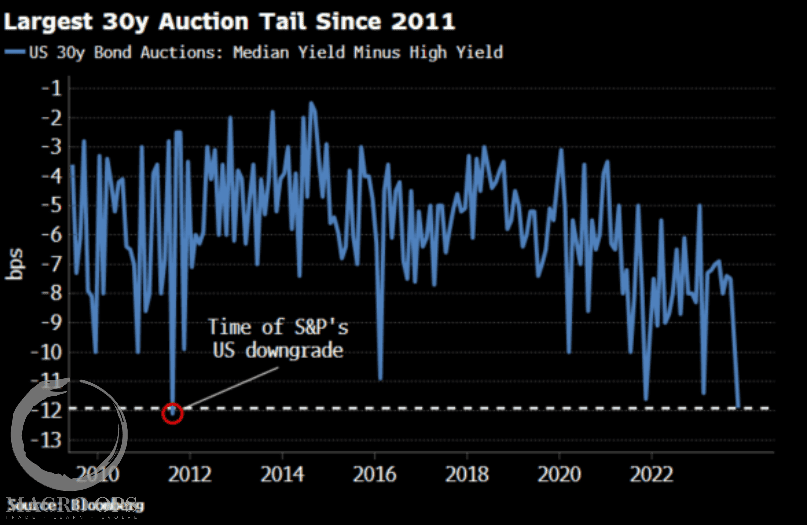
9. This is troubling since the recent 30yr auction “saw the worst tail (median – high yield) since August 2011, when the S&P downgraded the US from its AAA rating. Primary dealers, who backstop auctions, had to take a quarter of the issue, double the proportion they take on average” according to White.
10. Interestingly, Sentix’s Strategic bias in UST bonds, just climbed to 22-year highs. This is a positive for bonds though it tends to have a long lead.
11. Considering the current backdrop of negative sentiment and positioning combined with the recent cluster of breadth thrusts, not too mention overwhelmingly positive seasonality, it’s a good idea to be long this market.
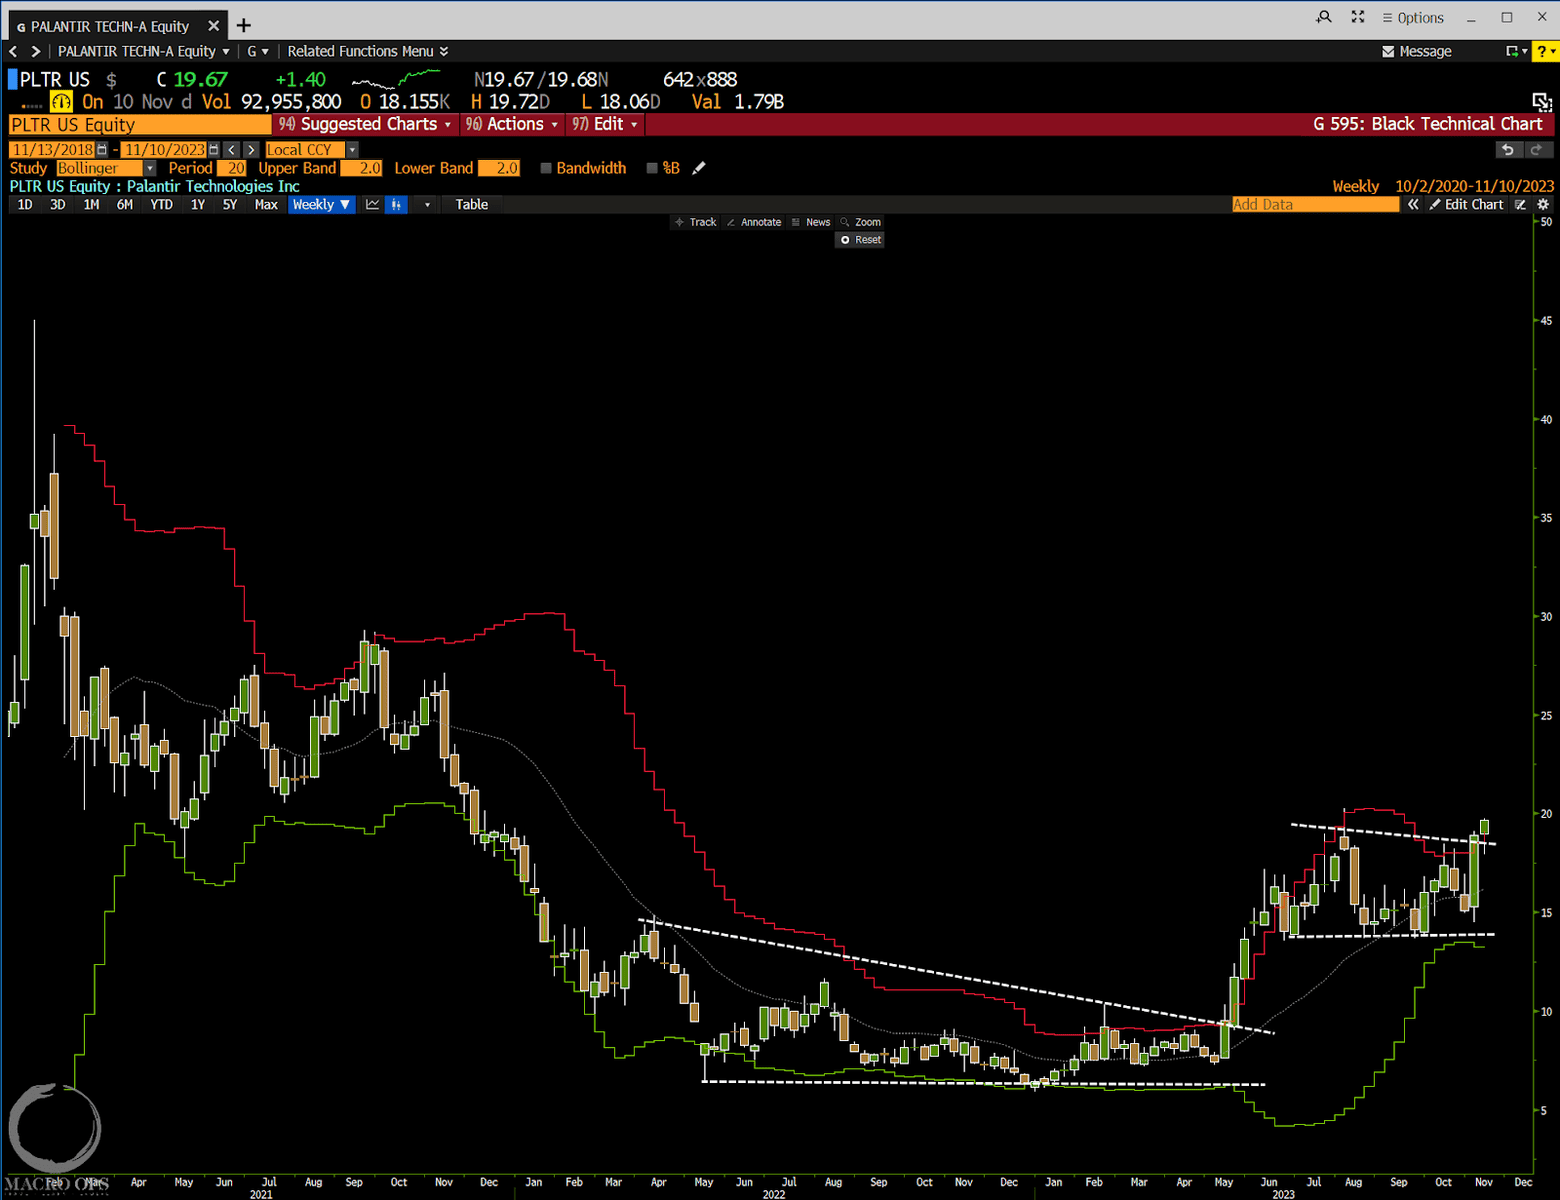
We like the Qs and the Nikkei here as we expect both to lead, and we’ll be sticking to playing the indices themselves. But two tech stocks with great long-term charts and strong recent relative performance are my old employer Palantir Technologies (PLTR). The chart pictured below is a weekly.
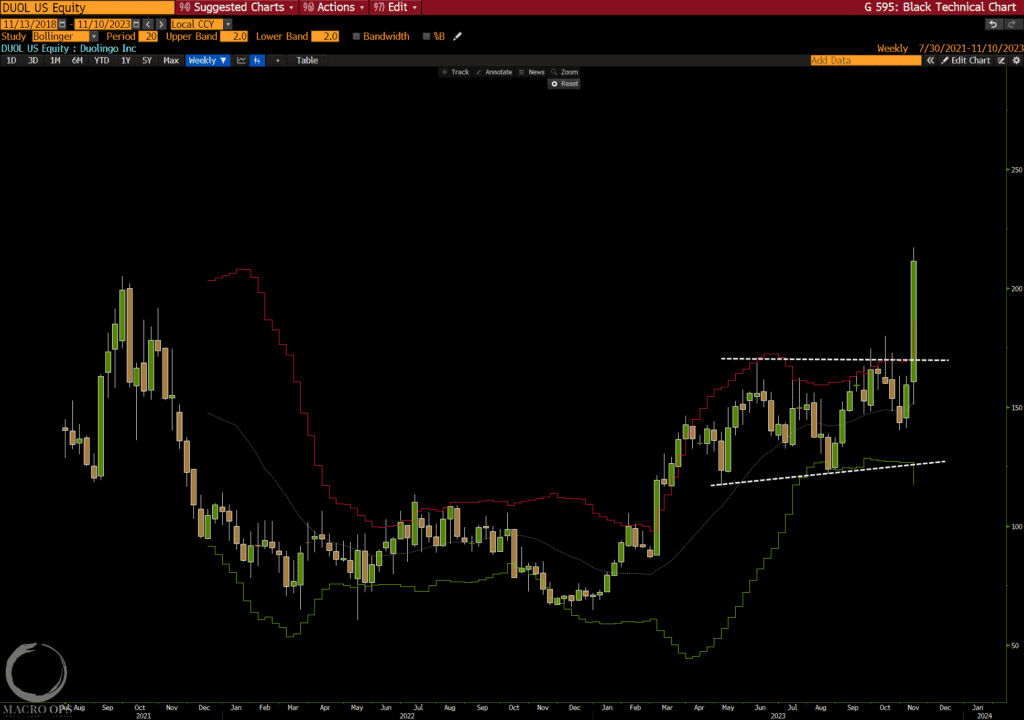
12. And the language app Duolingo (DUOL). Chart below is also a weekly.
Thanks for reading.