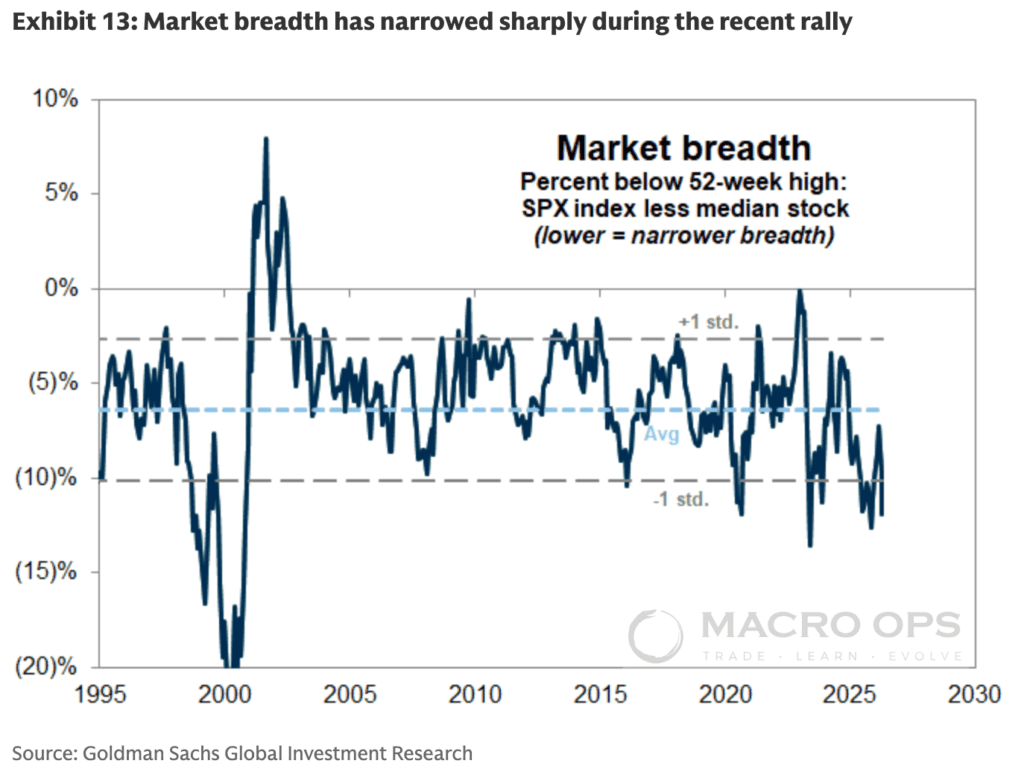
Summary: Trend Fragility triggered a conditional buy signal, falling to 19%. The Investors Intelligence Bull-Bear spread just logged its largest 7-week drop since COVID — a historically reliable contrarian marker. Both suggest a short-to-intermediate bottom is in. Despite this, we never saw true capitulation. And our Liquidity gauge cratered to 0% last week, which has historically been a headwind for 6-12 month returns. Net: SPX likely chops in a volatile sideways range until geopolitical clarity emerges. Base case remains — market is forming a cyclical top. Also: an EU defense play, a US strategic asset, and why crypto is about to get ugly.
MO Portfolio & Trades
1. Portfolio fell -136bps on the week, sitting at +37.39% YTD. Getting chopped around more than we should be. This is a wait-and-see market — and we need to do more of nothing.
Still running high cash. Core book: long silver, long gold miners, long BBG Commodities ETF, long 2y USTs, short cotton, plus a couple idiosyncratic equity names.
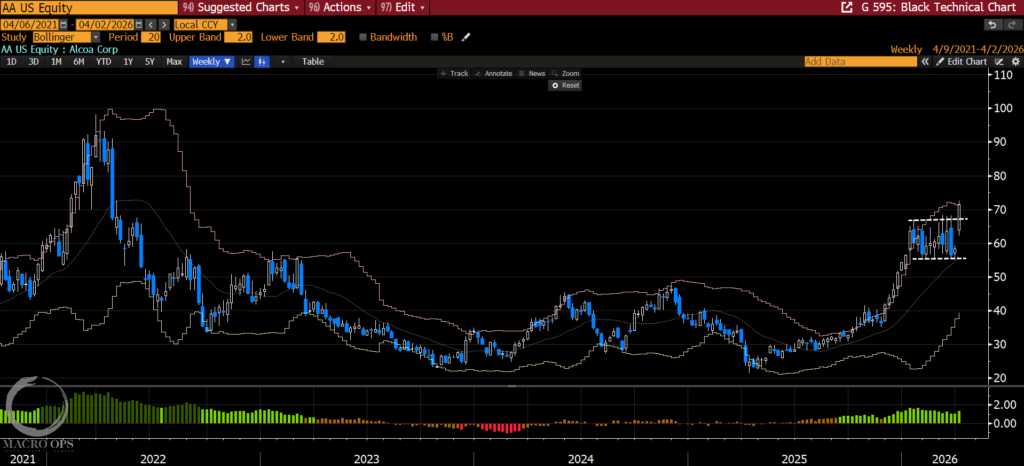
2. We took profits on CENX last month, but decided to take another swing at the aluminum trade — adding Alcoa (AA) to the book last week following its recent breakout. An Iran/Hormuz closure starves bauxite and alumina shipping lanes, spikes global energy costs, and crushes smelting capacity for energy – import-dependent competitors. AA, powered by cheaper domestic grid power, takes share. Meanwhile, the defense and aerospace procurement surge that follows any Gulf escalation is aluminum-intensive — front-loading demand exactly when supply is most constrained.
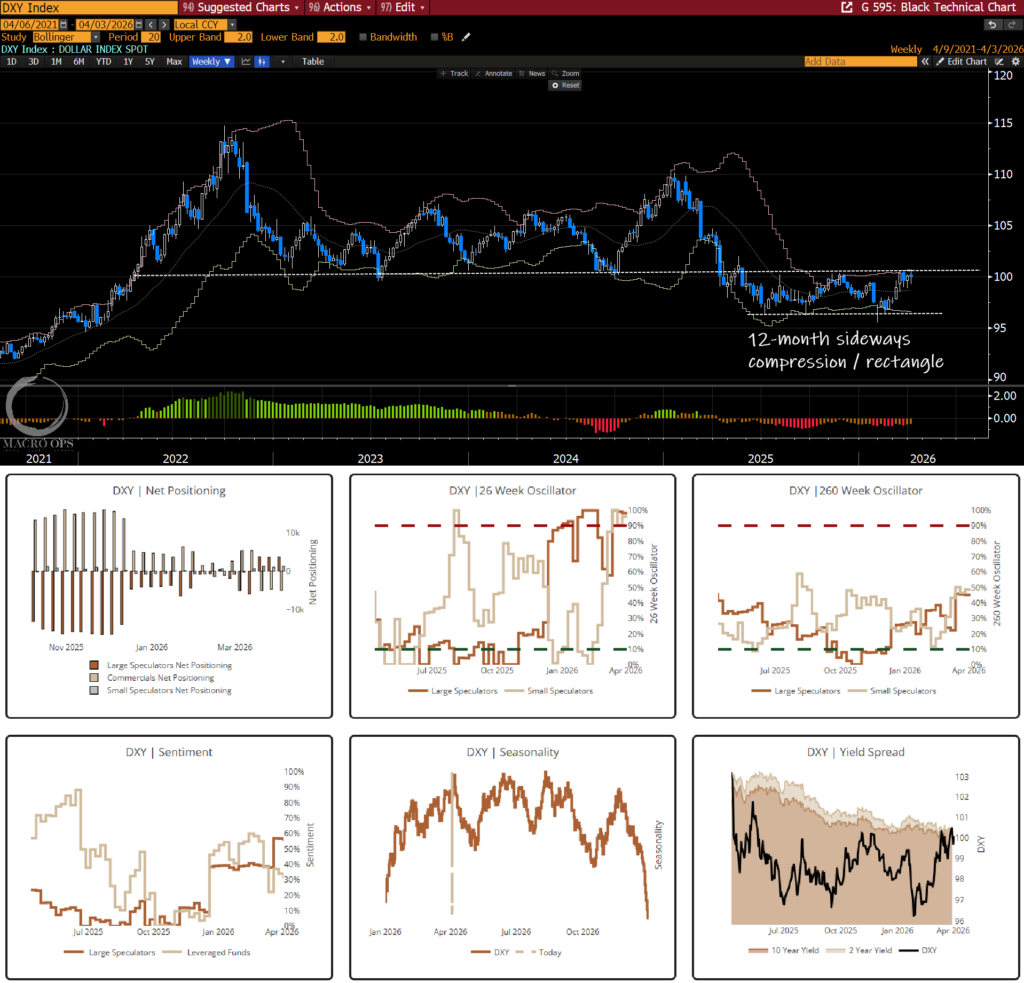
3. This is one of the more important macro charts to keep an eye on. DXY continues to coil near the upper bound of its 12 month sideways compression/rectangle pattern. Short-term positioning got ahead of itself, and is a near-term headwind, but longer-term positioning is still muted. We’re agnostic on direction and will play a move in either direction.
Trifecta Charts
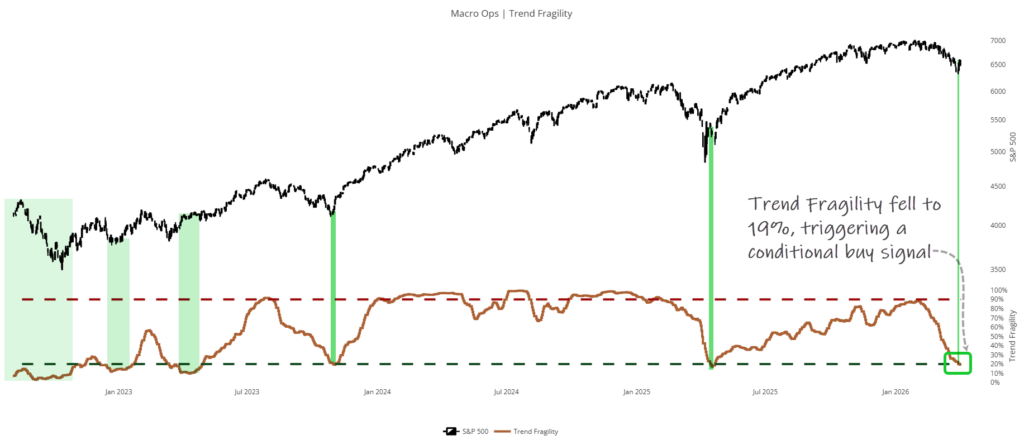
4. Ding ding ding. Our Trend Fragility indicator — a composite of sentiment, positioning, and flows — fell to 19% last week, triggering a conditional buy signal. Past signals marked by green vertical shading.
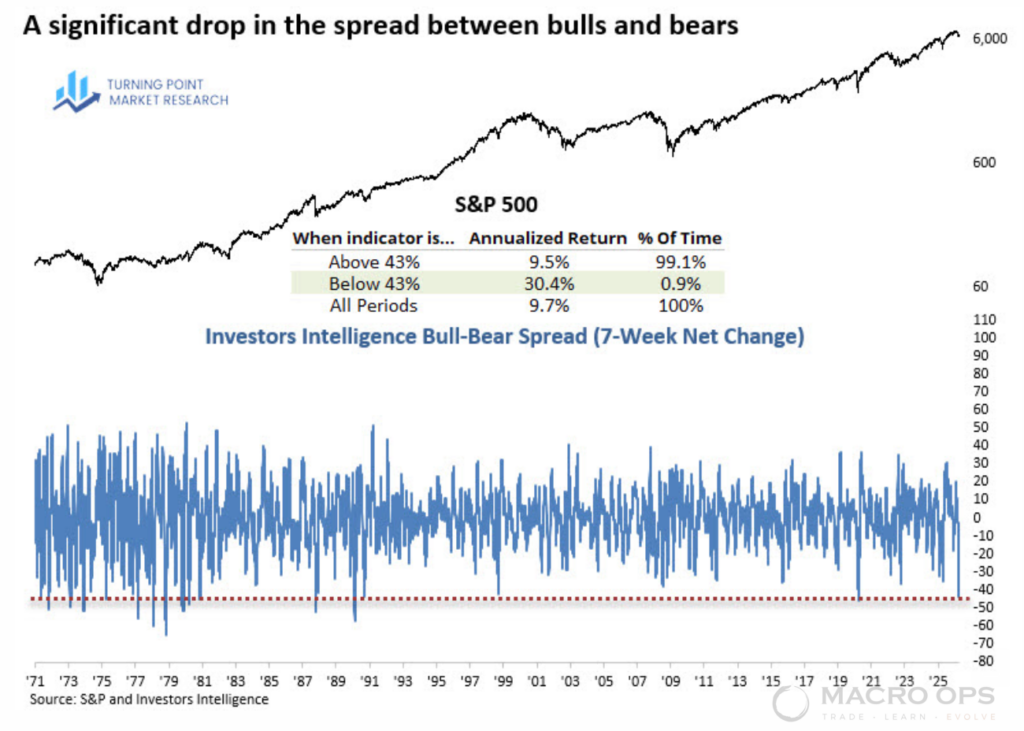
5. Our friend Dean Christians flagged this in a recent note: the 7-week Bull-Bear spread in the Investors Intelligence survey has “fallen dramatically to -43.5% — the largest decline since the COVID crash, occurring in fewer than 1% of observations since 1971.” Historically, extreme readings like this have preceded sharp reflex rallies, with SPX generating annualized gains near 30% when the spread falls below -43%. Classic contrarian setup.
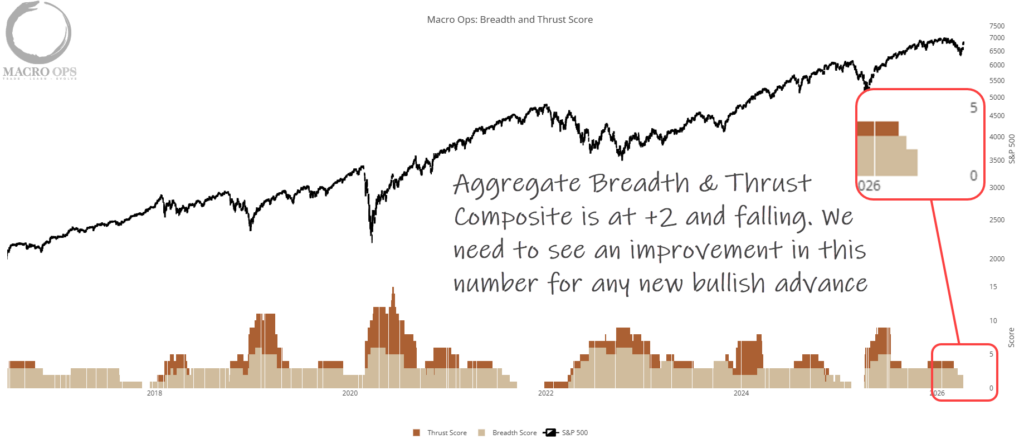
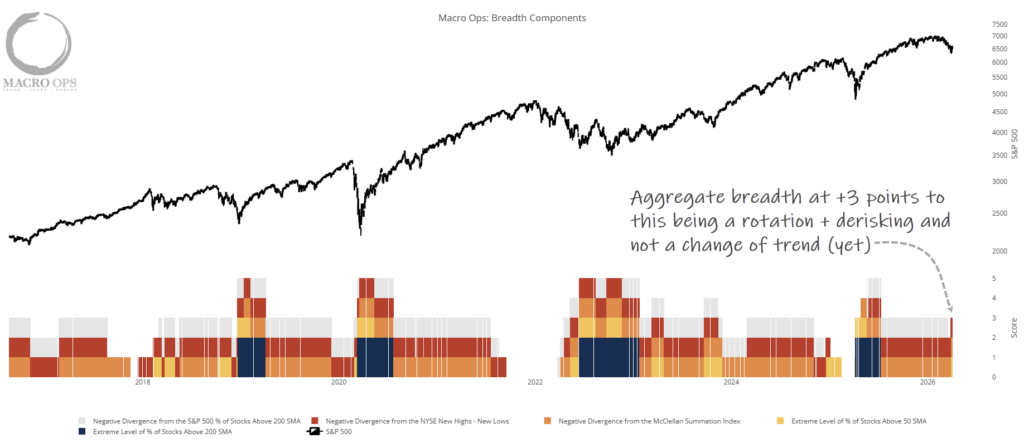
6. Our Aggregate Breadth Indicator continues to chug along at +3 — a solid reading. Points to recent market weakness being more about rotation than broad distribution. At least for now.
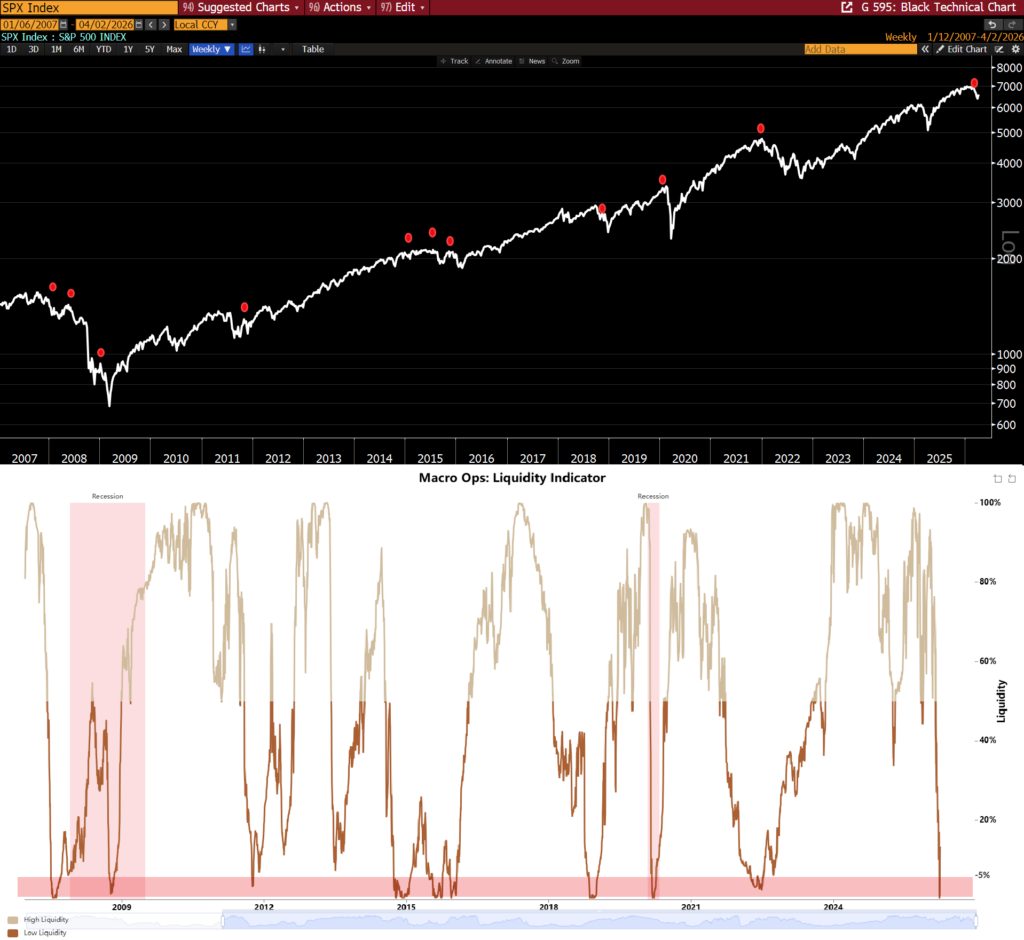
7. The Liquidity gauge, however, hit the floor last week — 0% reading, now sitting at 7%. Red dots mark past instances when this gauge first crossed below 5%.
All of the above keeps telling me: at best, we’re in a larger sideways volatile regime — and likely a cyclical topping process — that plays out until we start seeing cracks in the labor market.
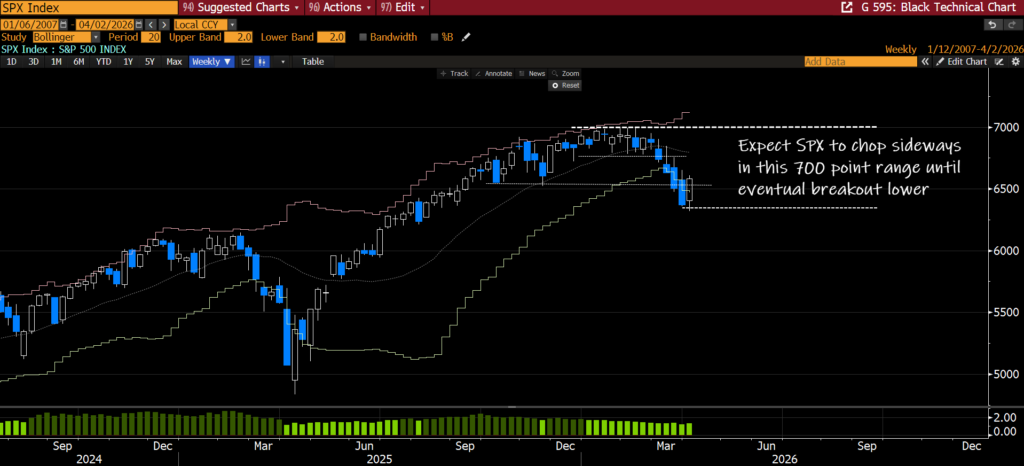
8. We have conditional buy signals from TF and sentiment surveys, but we never saw true capitulation. The kind that marks an enduring low and gets followed by breadth thrusts.
That said, we’ve probably seen enough for a short-to-intermediate bottom. My working assumption: SPX chops in a ~700-point range between the recent 6,300 low and the 7k high.
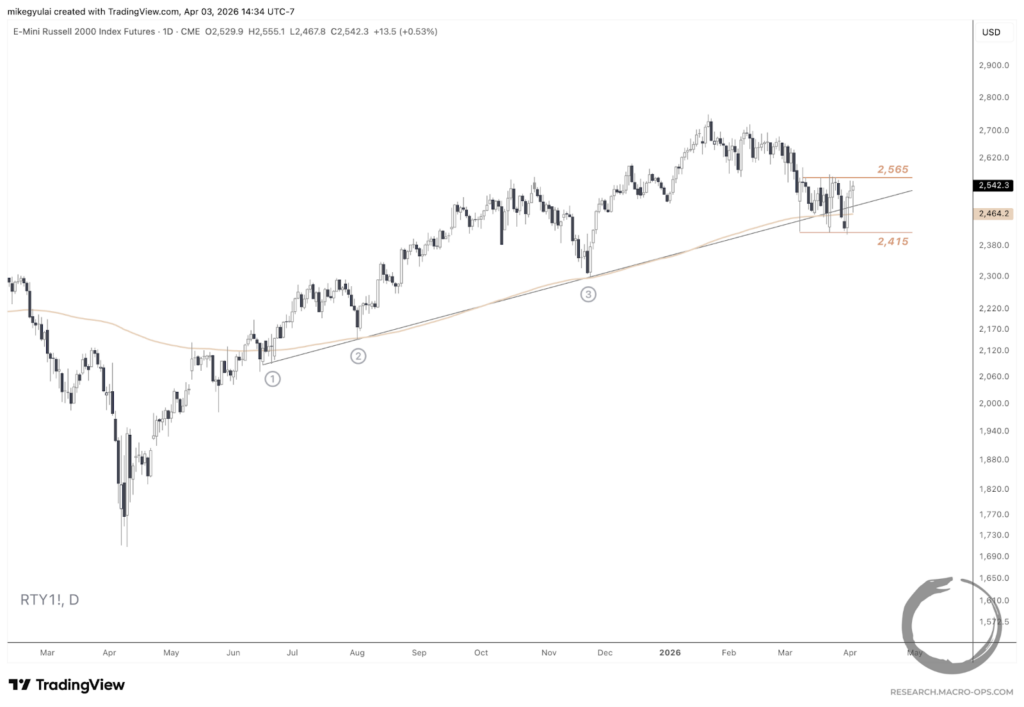
9. If you haven’t read Mike G’s latest note yet, do it — the full piece is on the Collective site, excerpt on Substack here. He’s watching the Russell closely: “More interesting to me in the equity world is the Russell, which has held its tight price compression right at the convergence of its 200EMA and multi-point trendline.”
Macro
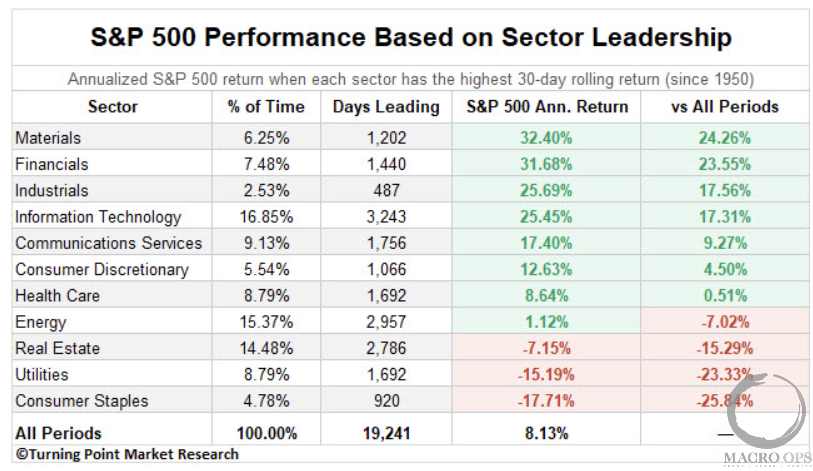
10. Who leads matters. Dean Christians again — this time on why energy leading the charge isn’t a great sign: since 1950, the S&P 500 has returned just 1.12% annually during periods when energy led, versus an all-period average of 8% (link here).
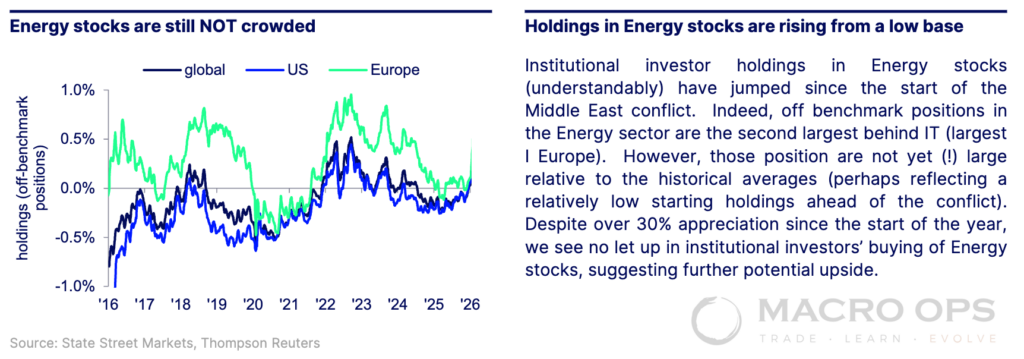
11. Short-term, flows into energy are large and positioning looks a bit overcooked — sector is likely due for a breather. But as State Street recently noted, positioning relative to historical averages is still far from crowded. It’s coming off a very low base.
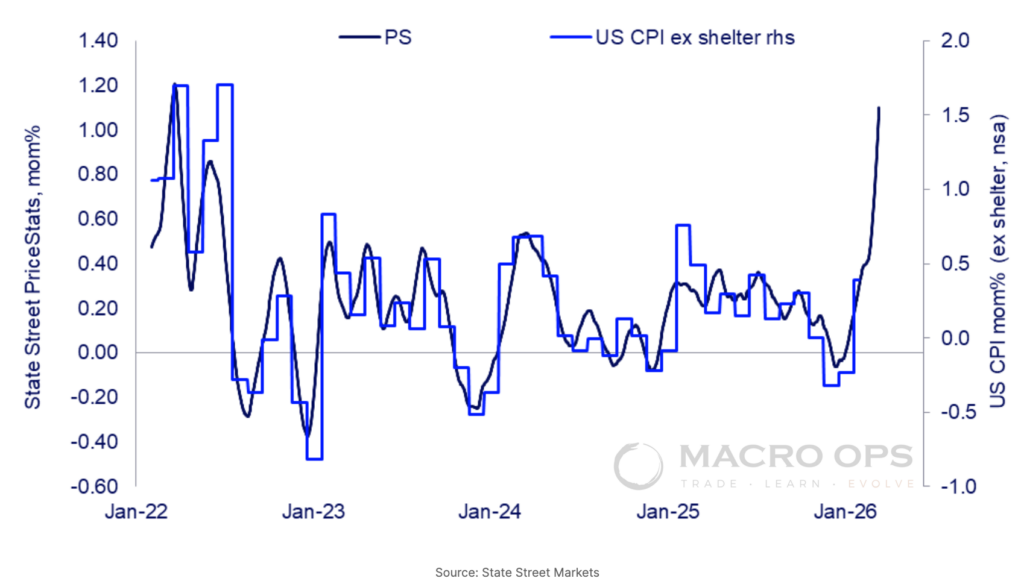
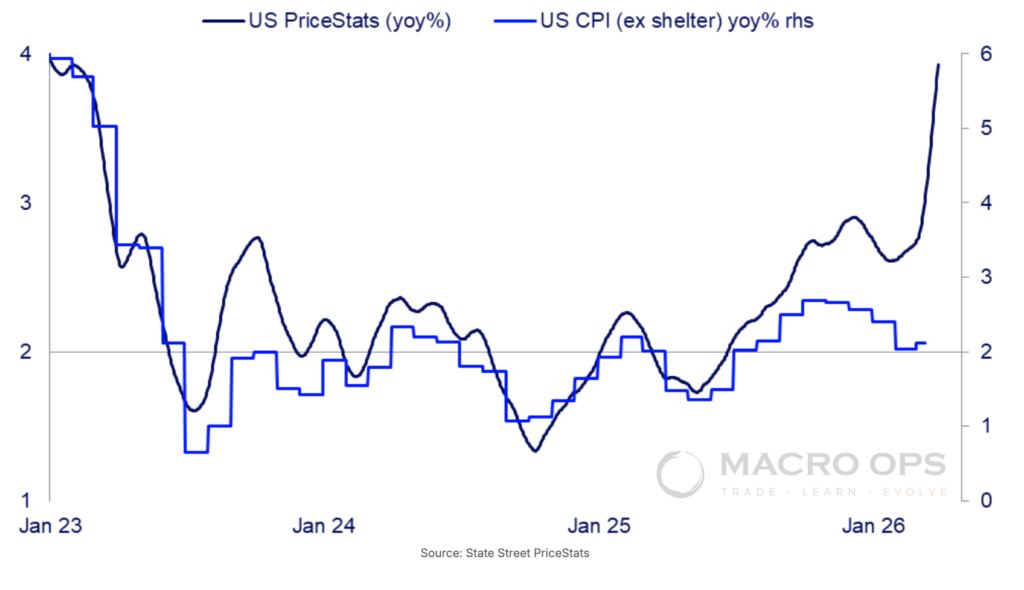
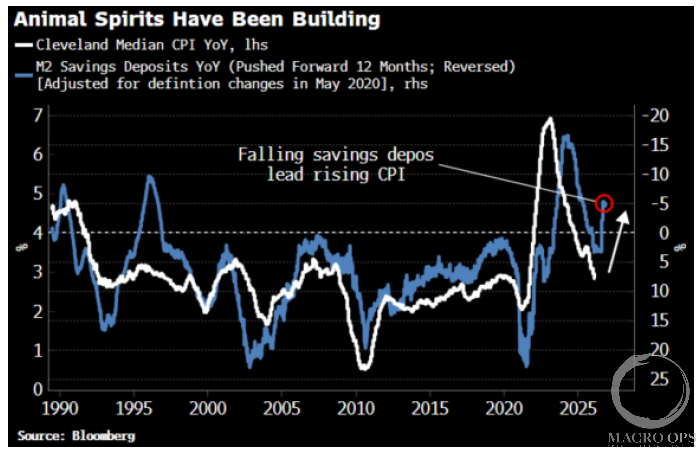
12. Updated US Price Stats YoY% from State Street. Inflation is about to rip. The question is how much the Fed chooses to look through supply-disruption-induced inflation — watch the upcoming minutes for any signal.
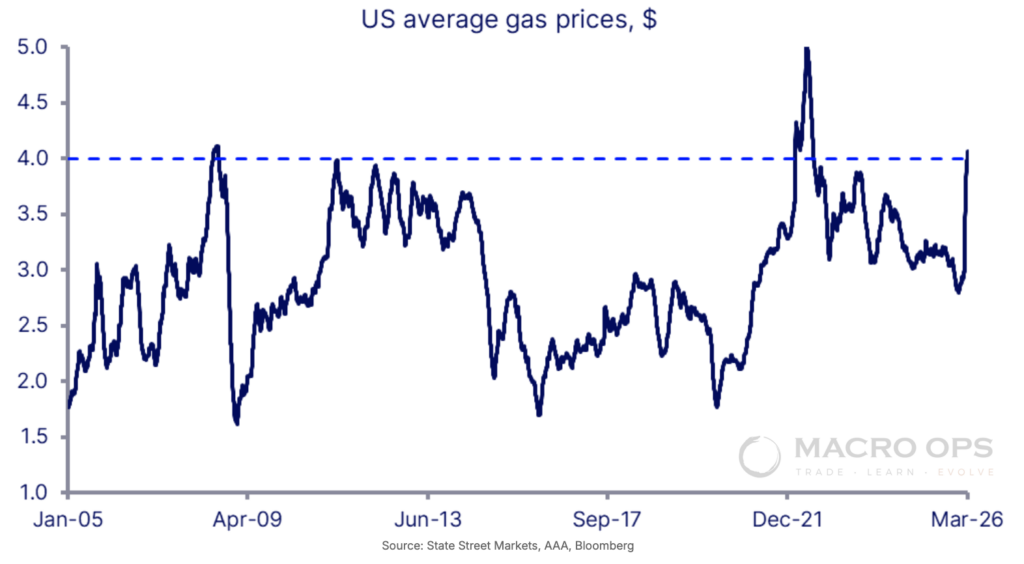
13. Earnings estimates have held up, but the longer the Strait stays partially closed, the more it squeezes an already stretched consumer through higher energy costs.
14. From BBG’s Simon White…
Trade Setups / Topical Charts
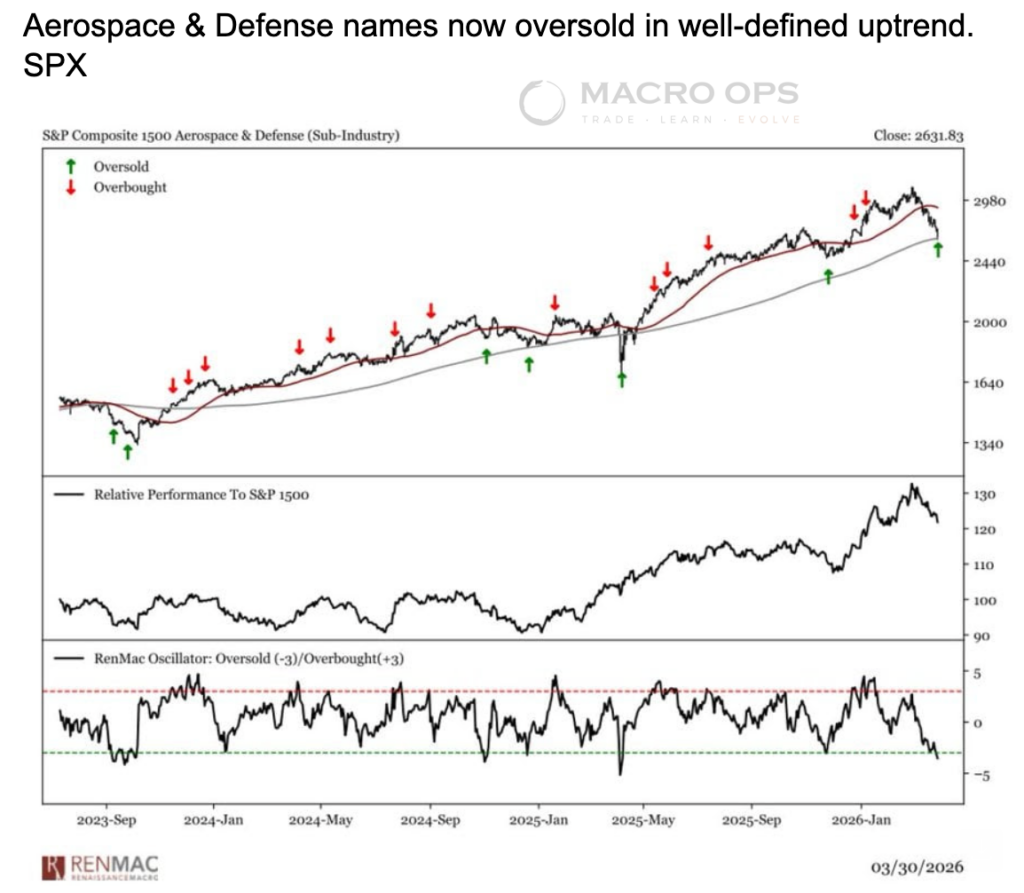
15. Aerospace & Defense names are oversold within a broad uptrend (chart via @RenMacLLC.
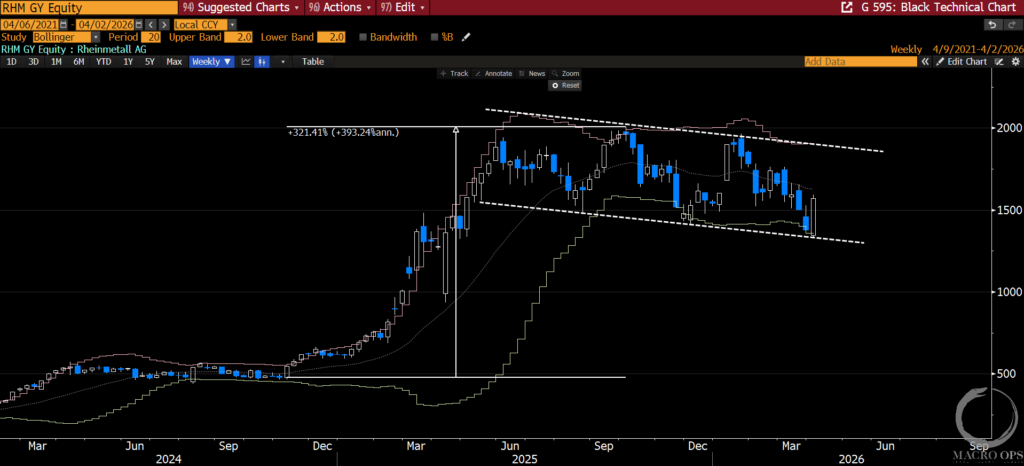
16. Rheinmetall (RHM) was one of our big equity winners in ’24. It’s been consolidating those gains in a sleepy sideways channel — and just reversed off the lower bound on the weekly. RHM is the purest expression of European rearmament at the exact moment a Gulf escalation makes NATO’s 2% GDP floor look politically untenable as a ceiling. Germany and Poland are tracking toward 3-4% trajectories, and RHM is the primary domestic prime contractor for both. The FX tailwind is underappreciated: Euro fiscal expansion strengthens EUR while RHM’s DM revenue base drives simultaneous earnings and multiple re-rating.
17. Mr. X and I are doing another interview soon — updating on Iran, but also covering China and Taiwan. Conviction is building that China moves on the island within the next 18 months.
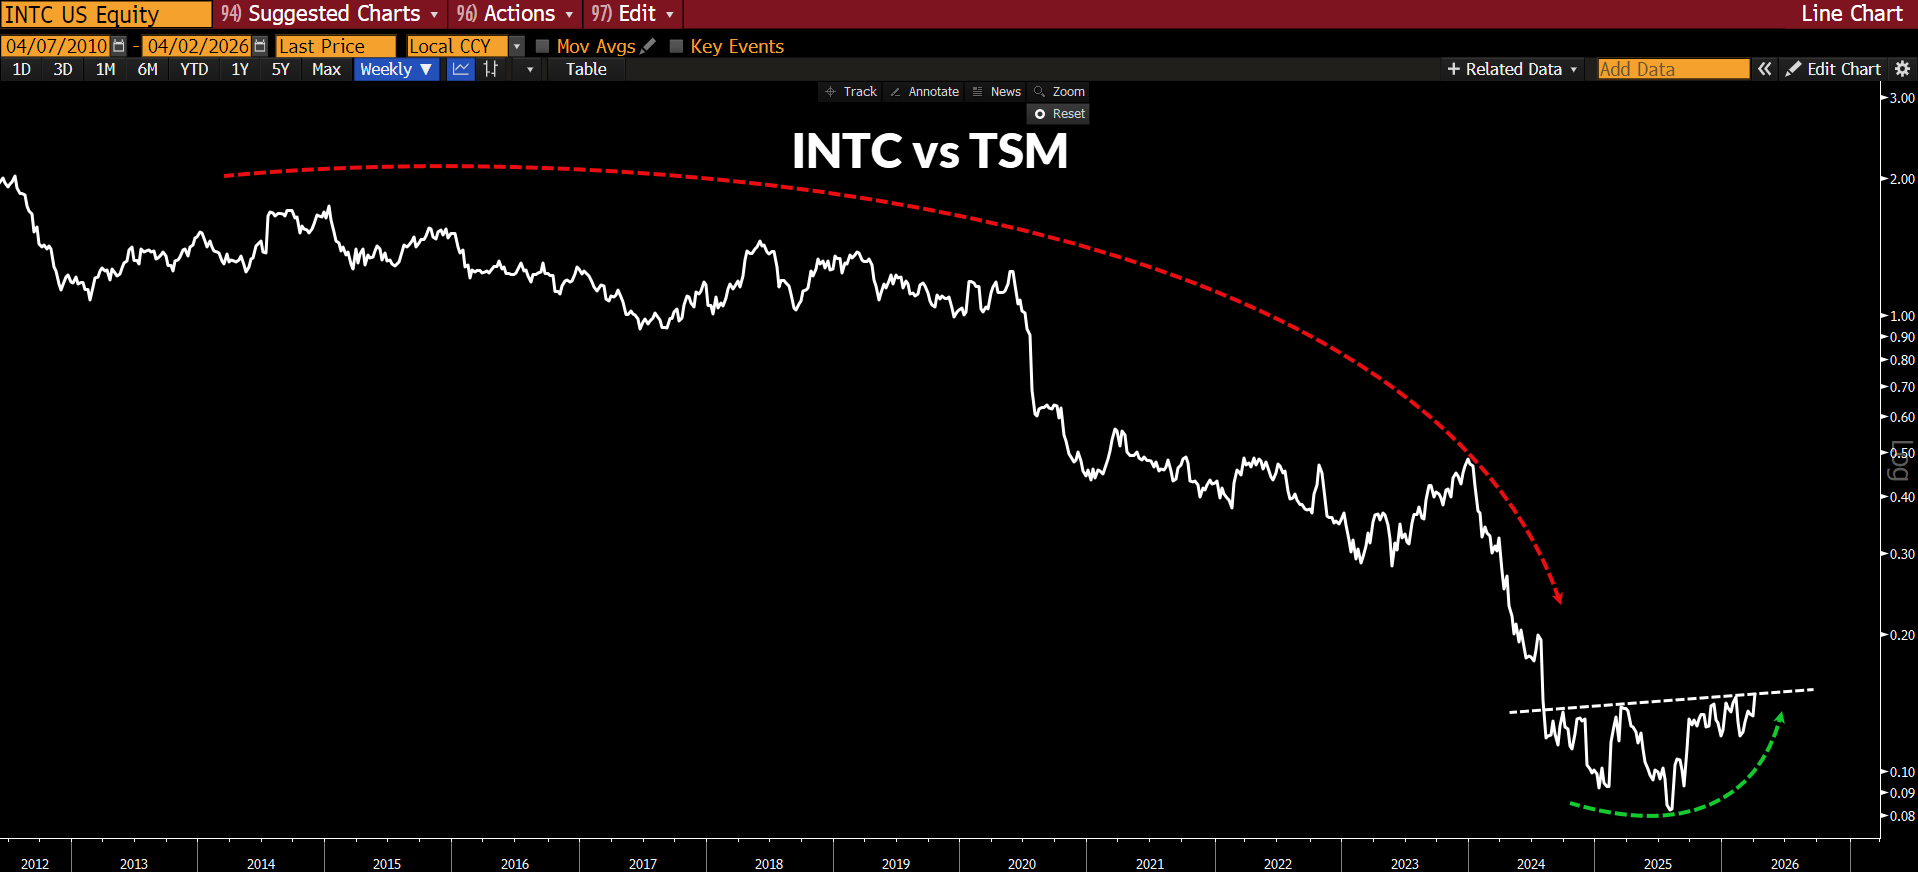
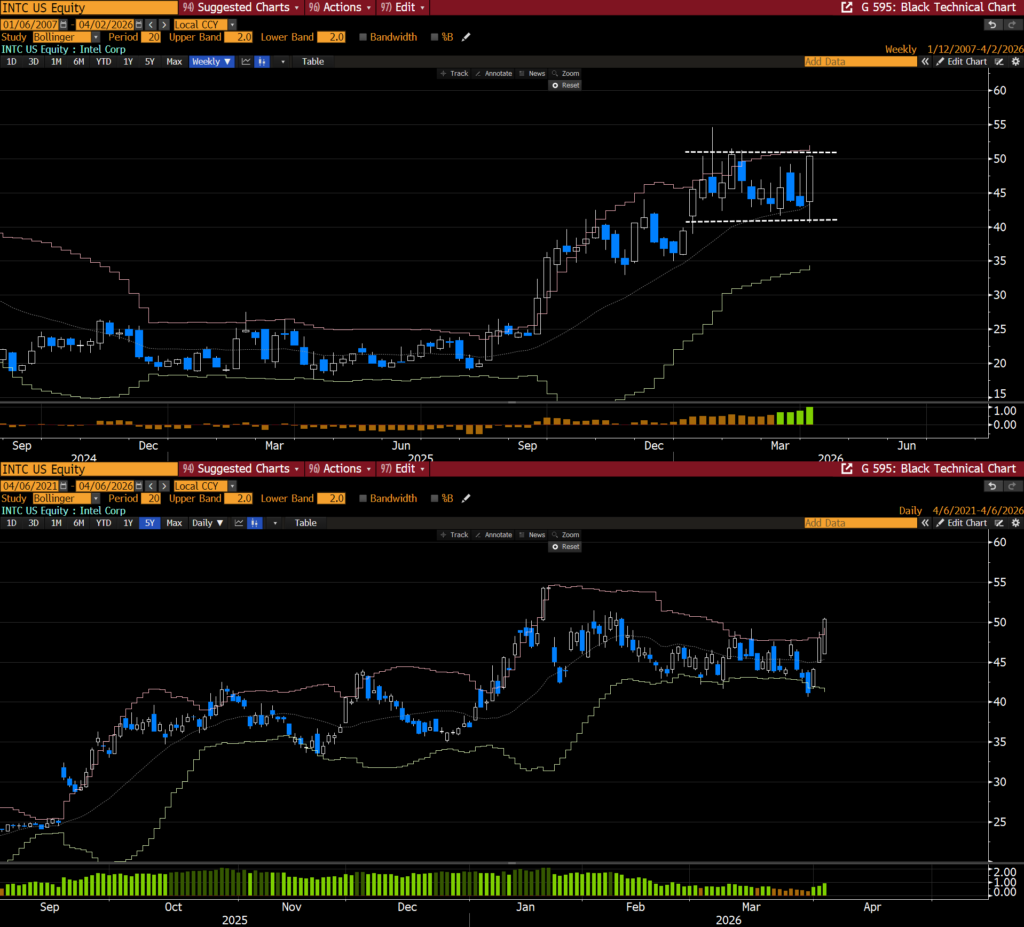
One pair trade I’m considering: long INTC / short TSM. Relative performance looks to be turning after a mostly one-way trade for the past decade. More on this for the Collective soon.
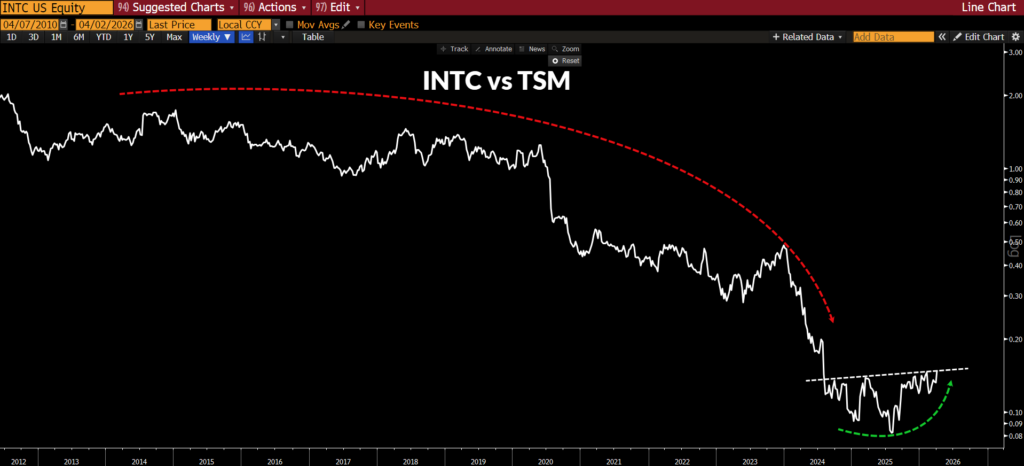
18. INTC on the weekly and daily. Likely adding a small starter long. INTC’s value as an indispensable strategic asset is going to become more self-evident as markets wake up to the fact that the global order is dead and Taiwan is not in our sphear-of-influence…
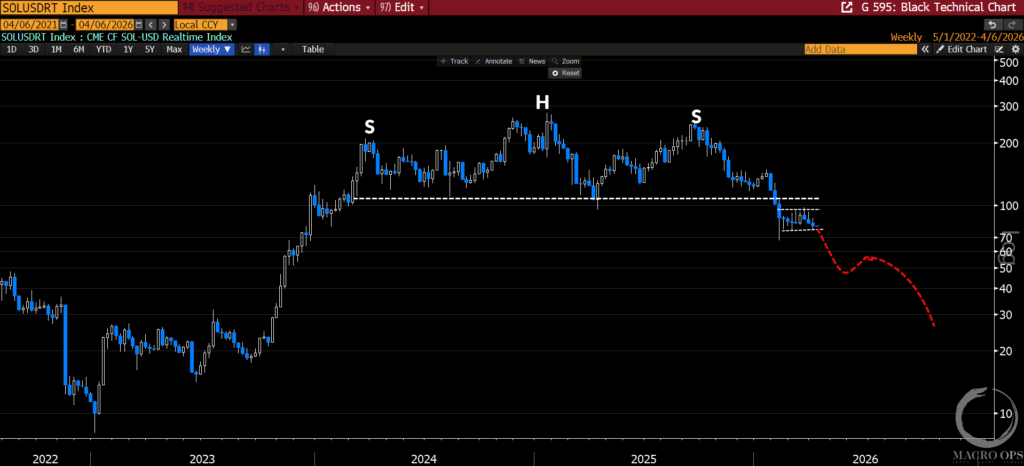
19. Crypto is nearing a make-or-break point. All major pairs compressing in a tight bear flag. The weekly SOLUSD chart shows a large completed multi-year H&S top. My bet is this resolves lower and crypto enters a devastating bear. But we’ll see — as always, we’ll let the tape tip its hand.
Thanks for reading.