It’s time for our February 2026 RS Inflection Report! At the end of each month, I present the top five Industry Thematics based on the RS Composite and RS Inflection Scores/Screeners. Then, I share the best charts / actionable setups across the top three themes for collective research.
The goal is simple. I want to say:
- Here are the strongest thematics over the past year, and here are the best/most actionable setups within those thematics (RS Composite).
- Here are the strongest thematics over the past 1-3 months; maybe they’ll become the next Relative Strength leaders, and here are the best setups within those thematics (RS Inflection).
We’re obsessed with stacking edges at Macro Ops. Specifically, we focus on three primary edges: Technical, Macro/Fundamental, and Sentiment. This is the bedrock of our Trifecta Lens Trading Philosophy.
The trades that show technical confirmation, fundamental conviction, and asymmetric sentiment tend to be the trades that make our year.
Here’s how the RS Inflection Report helps us find these trades.
The report identifies two of our three edges: technical and sentiment. With one report, we filter the market to the industries and thematics that are outperforming their peers (inflecting higher and showing relative strength leadership) and breaking out of long-term bases in sectors and corners the market has either forgotten or left for dead.
Last summer, the RS Inflection alerted us to solar stocks when nobody wanted to touch solar or renewable energy. It allowed us to build a basket in the relative strength leaders in a left-for-dead (but inflecting) thematic and bag a few profitable trades.
Then, in September, the report flagged lithium as the next potential commodity to move. Lithium ETF $LIT is up 40%+ since then.
Again, it’s about stacking edges … finding setups where technicals, fundamentals, and sentiment align to give us a profitable, repeatable pattern for making money in markets.
We share these reports and individual stocks within our Thematic Leaders each month in our Macro Ops Collective.
If you’re interested in joining and learning more about our Trifecta Lens Process, click the link below.
Just a heads up, we’re raising prices soon. Not as a gimmick. We’re keeping the community at a size where it actually works. If you’ve been on the fence, it’s time to jump!
Alright, now onto this month’s RS Inflection Report.
Two weeks ago, I described my relationship with AI tools, the dark path I found myself on, and actionable steps I could take to get the most out of them without offloading the critical-thinking part of my job.
Improving our Trifecta Lens Pulse Reports is a perfect use case for Claude/AI tools, and I’m excited to share the results with you.
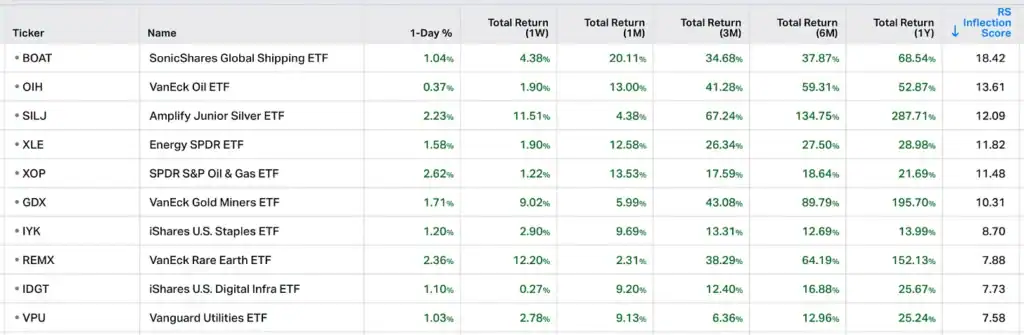
Top Five RS Inflection Leaders Heading Into March
Here are the top five Thematic Leaders as of 02.28.2026:
- Global Shipping (BOAT)
- Oil Services (OIH)
- Silver Junior Miners (SILJ)
- Energy Producers/Explorers (XLE/XOP)
- Gold Miners (GDX)
You can see the full top-ten list below.
The only thing that matters on this list is oil. Oil has inflected sharply over the last two months and is finally flashing the technicals “green light” in our Trifecta Lens Criteria. Funny enough, all that inflecting happened before any of the Iran war news … maybe price is king?
Speaking of price is king, I can’t believe I missed this BOAT trade. Look at the weekly chart below.
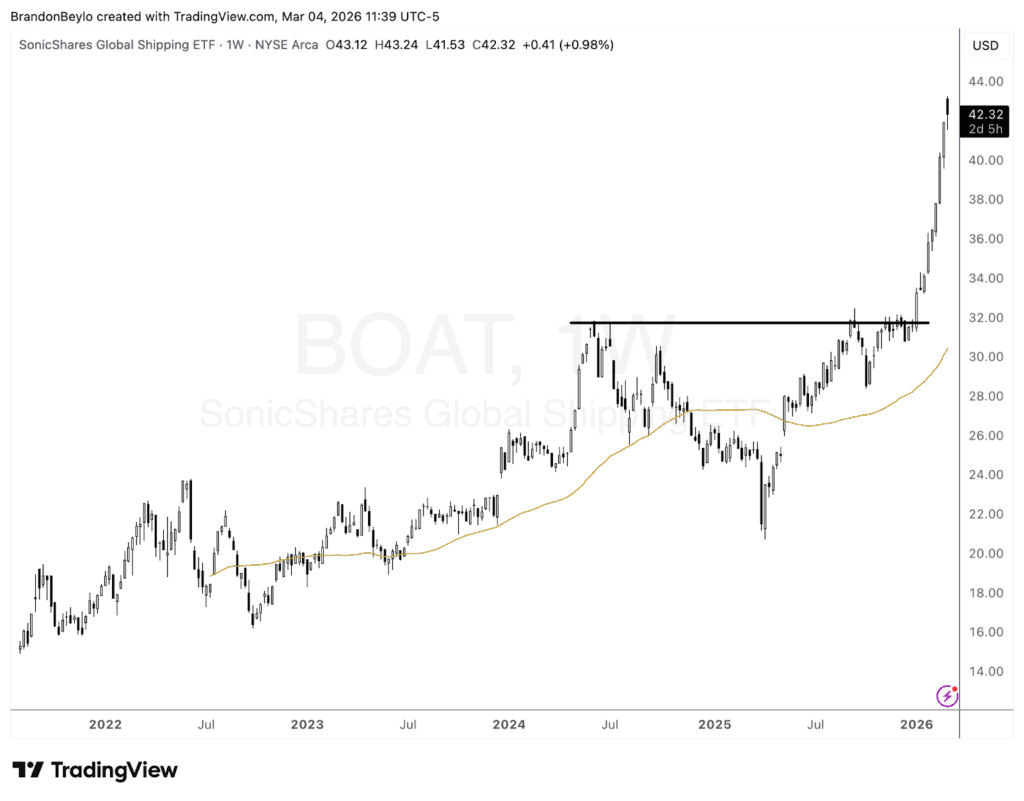
That’s as clean a setup as you could ask for … breaking out from an inverse H&S to new ATHs on a strong weekly bar. The market never stops throwing me “don’t overcomplicate this game” reminders.
Anyways, here’s our current portfolio positioning relative to our thematics (rounded):
- Metals & Mining: 22%
- Oil & Gas: 36%
- Aerospace & Defense: 11%
- Other: 19%
We own the stuff that’s working and inflecting, but I want more oil exposure going forward (I’m thinking 50%+ notional). Check out some of these oil thematic monthly charts.
Here’s OIH.
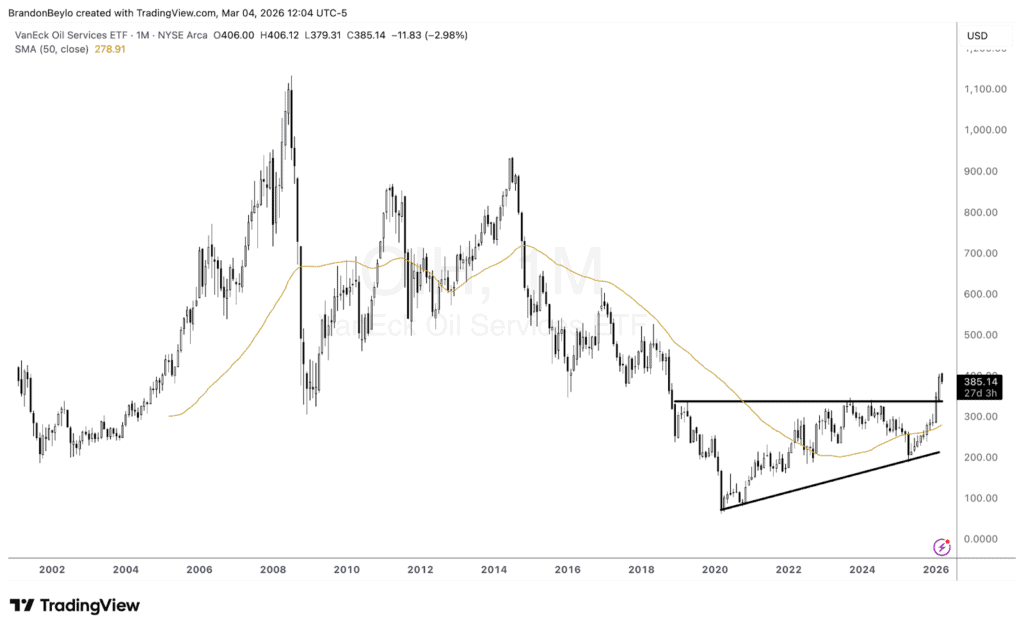
It’s breaking out of a 7-year ascending triangle bottoming pattern. Then there’s XOP (see below).
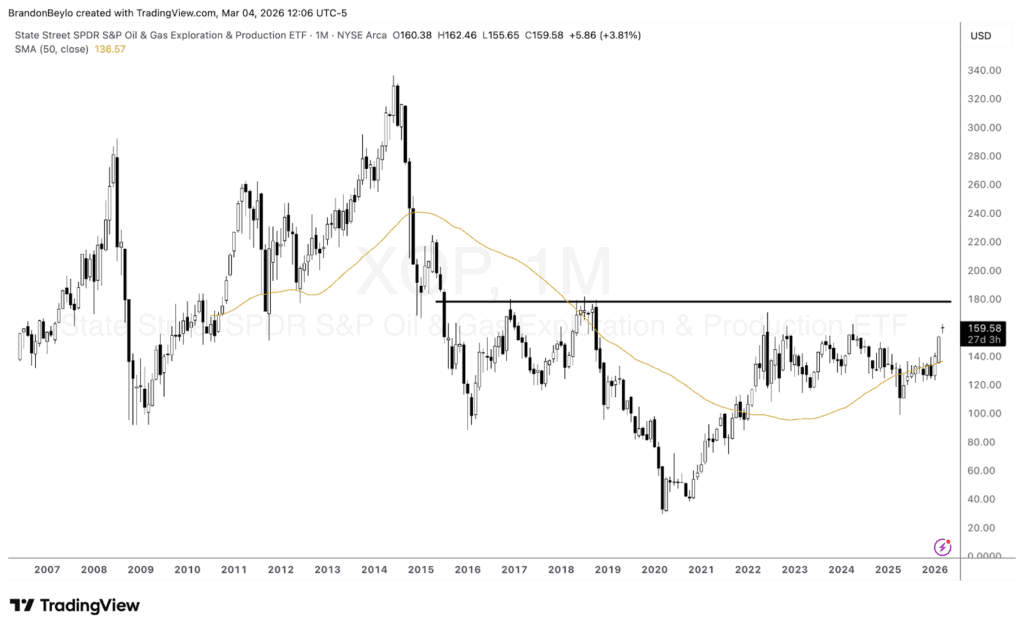
It’s forming an 11YR inverse H&S reversal pattern (with a four-ish-year rectangle-launching pattern). Again, we don’t need to overcomplicate things. Buy inflections with charts that look like XOP and OIH.
Now, about the Claude-assisted RS Inflection Analysis. Let’s explore “under the hood” with our RS Inflection Thematics.
Under The Hood: RS Inflection Screener Analysis
One of the improvements I made in December was adding RS Inflection & Composite Screener Analysis. Now, powered by Claude.
Here’s how it works.
I screen for stocks based on the same RS Inflection and Composite criteria as above. The result is a detailed breakdown of which industries, sectors, and stocks meet that criteria, and most importantly, the changing distribution of industries, sectors, and thematics over time (MoM).
Warning, this will get “data-heavy” real quick. If you’re a data nerd, you’ll love this. If you’re a visual, chart-based Operator, don’t worry, I’ll get you later.
Sector Distribution & MoM Change
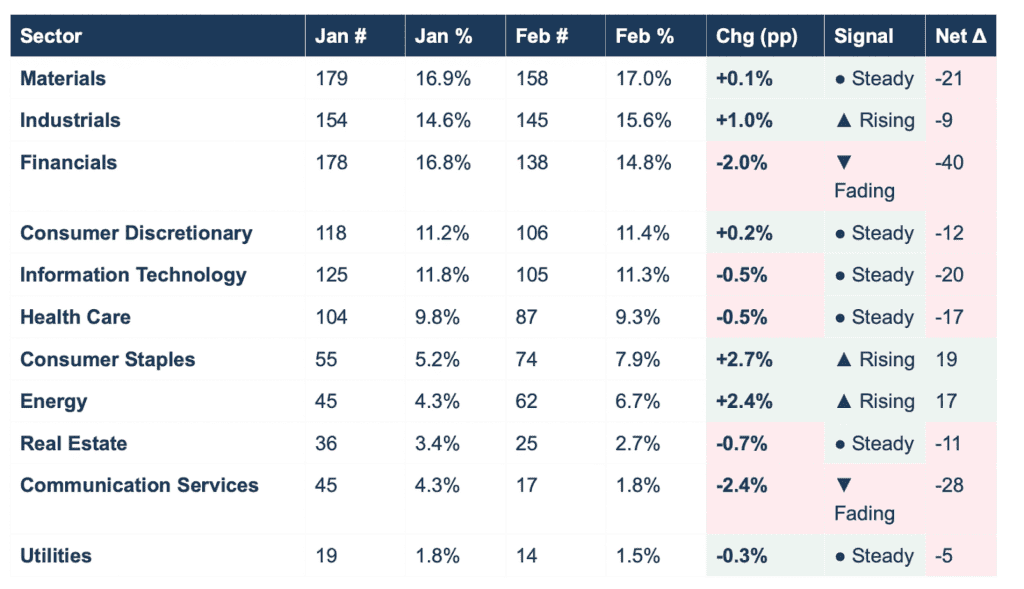
Consumer Staples gained the most share (+2.7%), followed by Energy (+2.4%) and Industrials (+1.0pp). Communication Services (-2.4%) and Financials (-2.0%) saw the largest declines. Materials held steady as the largest sector at ~17%.
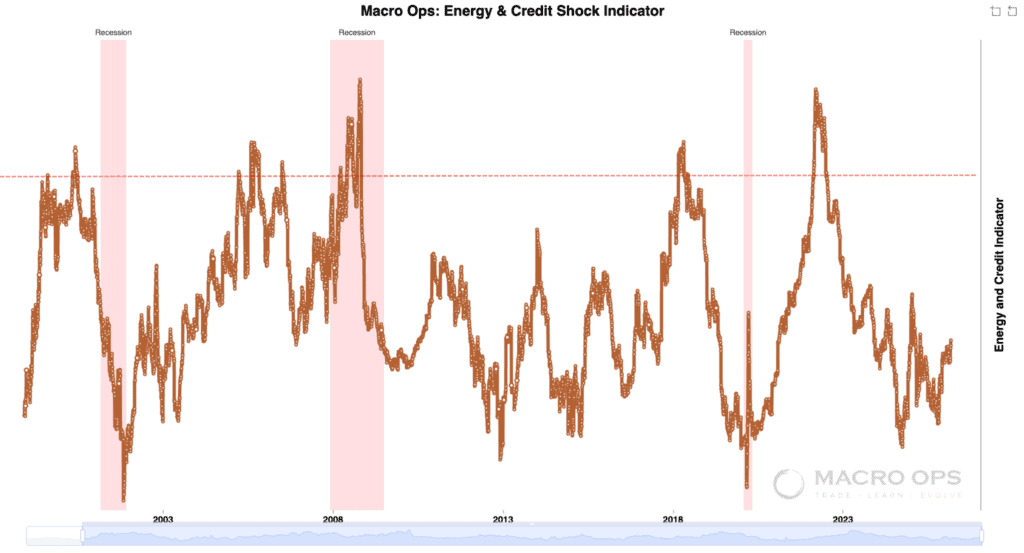
Remember, it’s all about energy.
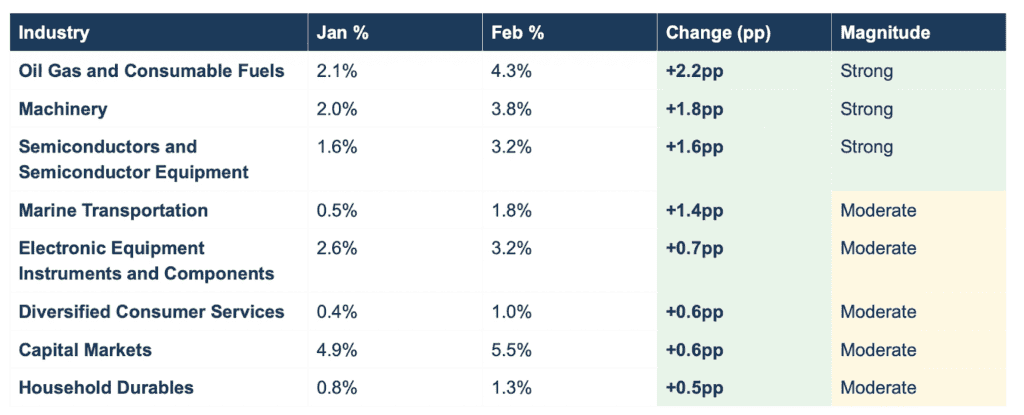
February 2026 Top Industry Rankings
A few notes from this ranking:
- Oil & Gas Consumables gained twelve spots from January and ranked fourth in February’s Top 10 (was 16th).
- Machinery stocks climbed eleven spots to sixth on this month’s list (was 17th).
- Semiconductor & Semiconductor Equipment stocks doubled their share in February, jumping 13 spots from 21st to 8th.
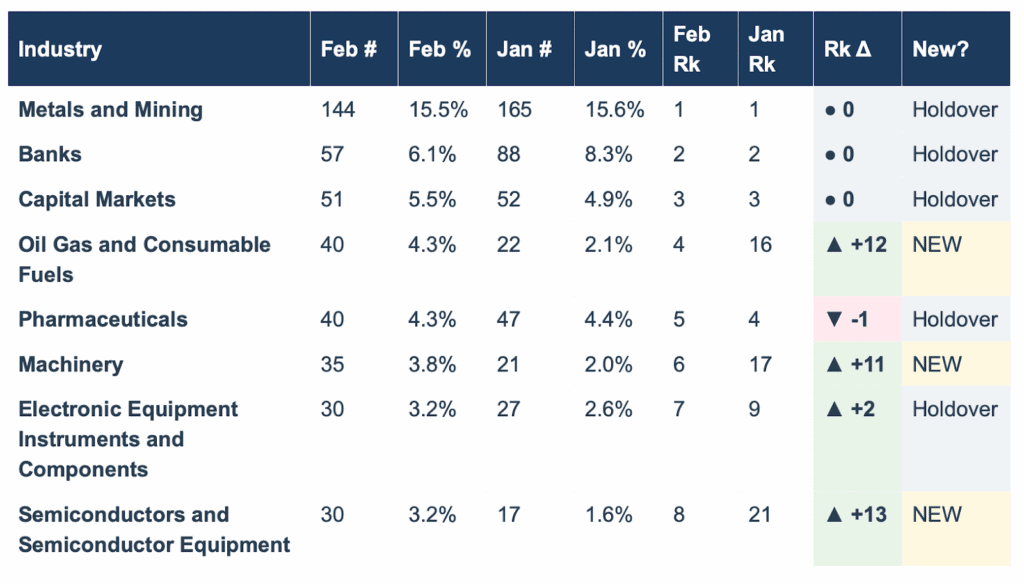
Software, Specialty Retail, and Construction & Engineering exited the Top 10 in February.
Industry Share Movers (% of Screened Results)
We can also view the biggest industry movers as a percentage of their share of the screener results (see below).
Oil and gas, machinery, and semiconductors showed the strongest MoM share growth, with oil and gas doubling its share from January.
Relative Strength Profile: Detecting Inflection Levels
Another interesting analysis exercise is determining the “Inflection Strength” of each thematic or industry. We can find this by measuring the spread between long-term relative strength (1YR) and short-term relative strength (1M/3M). The larger the spread, the stronger the inflection.
Here are February’s results.
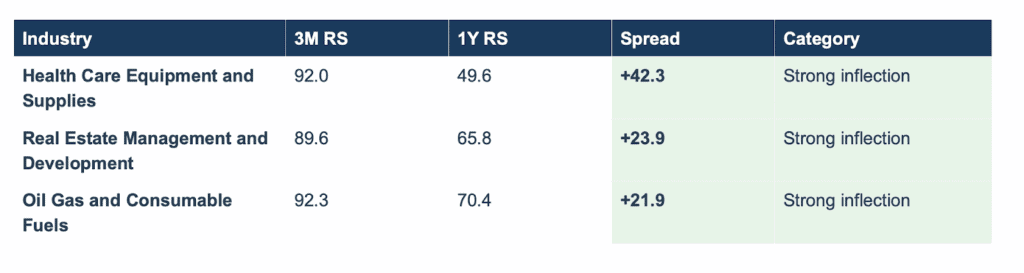
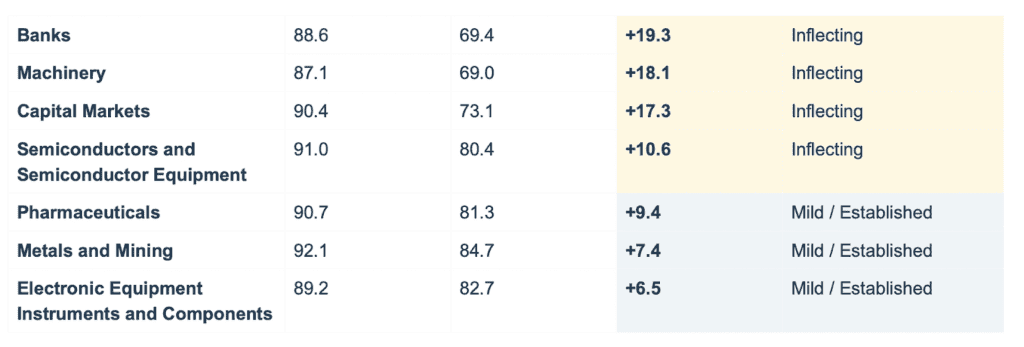
This is the RS Inflection Report in one picture: show me the industries/thematics that have the strongest inflections over the prior month.
Also, the spread doesn’t discriminate against past success. Oil and Gas has a 70 1YR RS score, that’s great. But it still shows up in the top three because its 3M RS score is so high (93). It reminds me of what Druckenmiller always says about conviction (and I’m paraphrasing):
“Sometimes conviction means that the opportunity set is actually a lot bigger (and more profitable) than consensus. So even though I may be with the crowd, I can have conviction that the future will look even better than what everyone else thinks.”
From Data Gathering To Idea Generation
All of this data is nice, but it’s worthless if we don’t turn it into an actionable pipeline for idea generation.
I know I just gave you a lot of information, so here’s how I would use this report to plan your monthly investment research:
- Focus most of your time on the thematics/industries that frequently appear in the top three inflection rankings (Oil and Gas, Metals and Miners, and Machinery stocks this month).
- After that, spend the rest of your time on the Strongest Inflection thematic/industry (i.e., the one with the highest spread). This could be the next RS Composite leader. This month, that’s Health Care Equipment and Supplies.
- Download the RS Inflection Watchlist (here) and use Koyfin’s Lots of Charts function to find the best-looking charts (long-term bases, deep pullbacks finding support, potential breakouts, etc.).
Let’s head to the charts to find this month’s setups.
Oil & Gas/Services: This Month’s Big Thematic
Oil and gas is our biggest thematic focus this month. As such, we’re spending most of the month looking for Trifecta Lens setups to add to our portfolio (and get O&G weighting to 50%+).
Here are a few ideas that warrant further attention.
Tourmaline Oil (TOU.TSX)
TOU is Canada’s largest natural gas producer operating from three main areas: Alberta Deep Basin, NEBC Montney, and Peace River. The stock trades at 7x NTM EBITDA with a 5% dividend yield. There are two things I love about this setup:
- TOU’s monthly chart
- Natural Gas chart
Check out TOU’s monthly chart below.
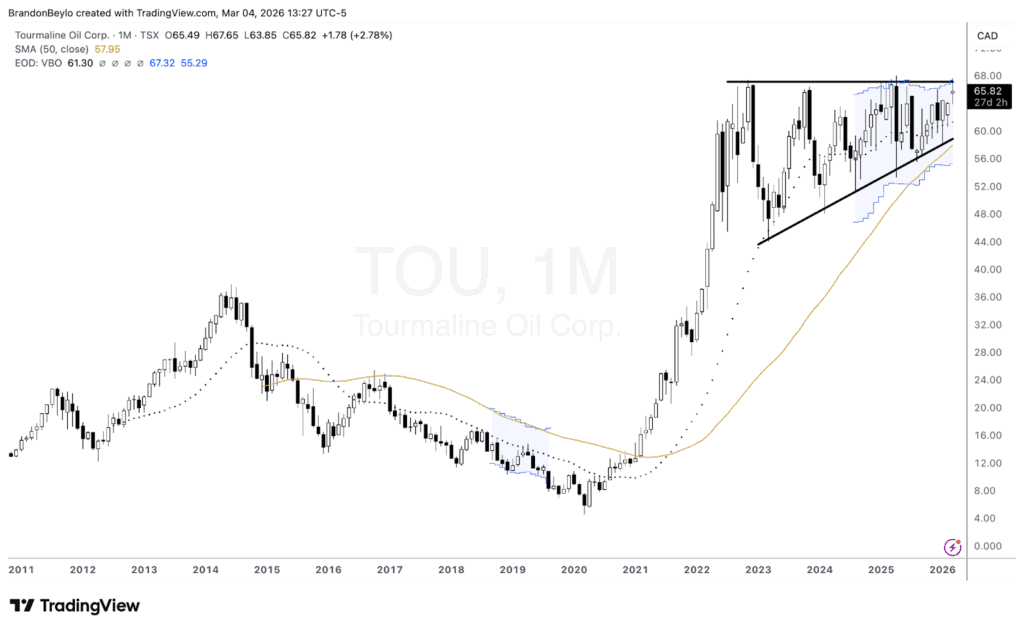
The stock is compressing within a four-year ascending triangle (hugging the 50D). But check out natural gas futures, too (see below).
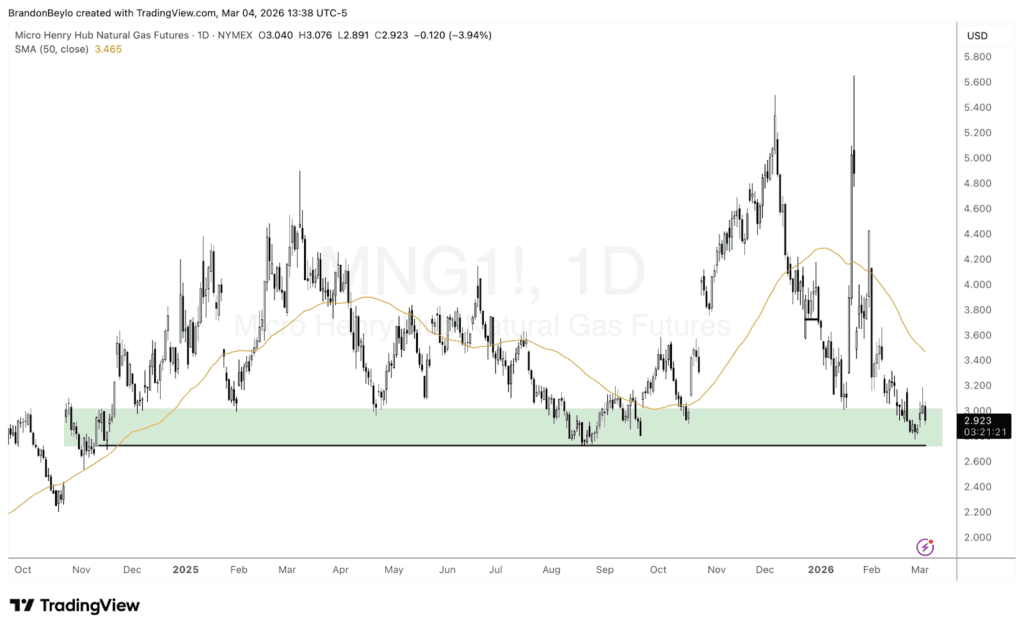
Natural gas is bouncing off 1YR+ support around $3. TOU reports earnings in a week. We’ll see if we get an entry bar post-earnings to go long.
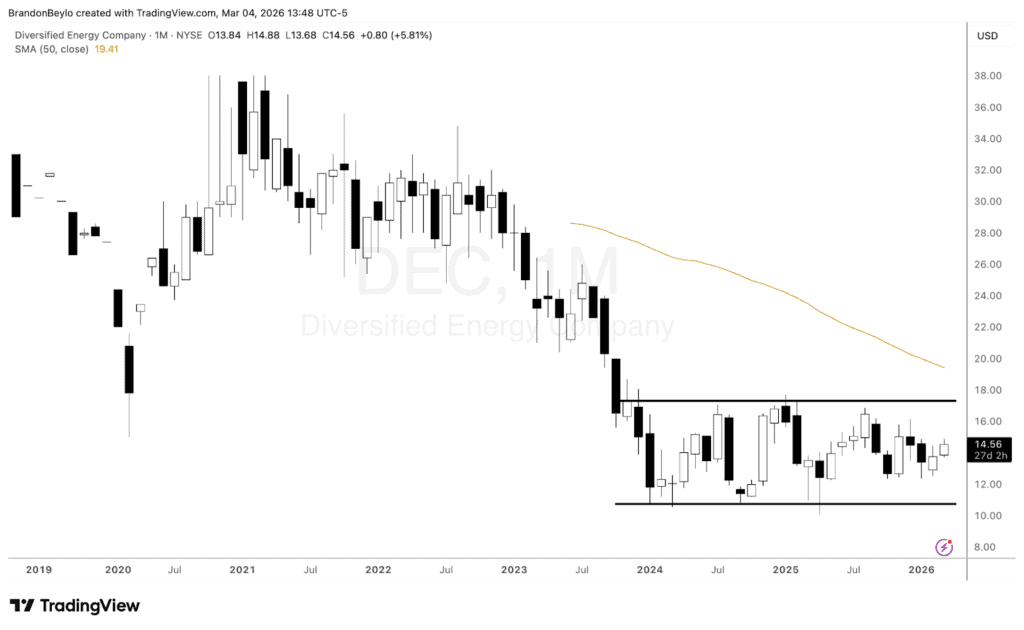
Diversified Energy Company (DEC.NYSE)
DEC is a $1B market cap company that produces, transports, and markets primarily natural gas and natural gas liquids from existing assets in the U.S. Appalachian and Central regions.
It’s one of the cheapest companies in the Energy space, trading at ~1x TBV and 4x LTM FCF.
The stock trades in the middle of a ~2YR rectangle base with increasingly compressed volatility (see below).
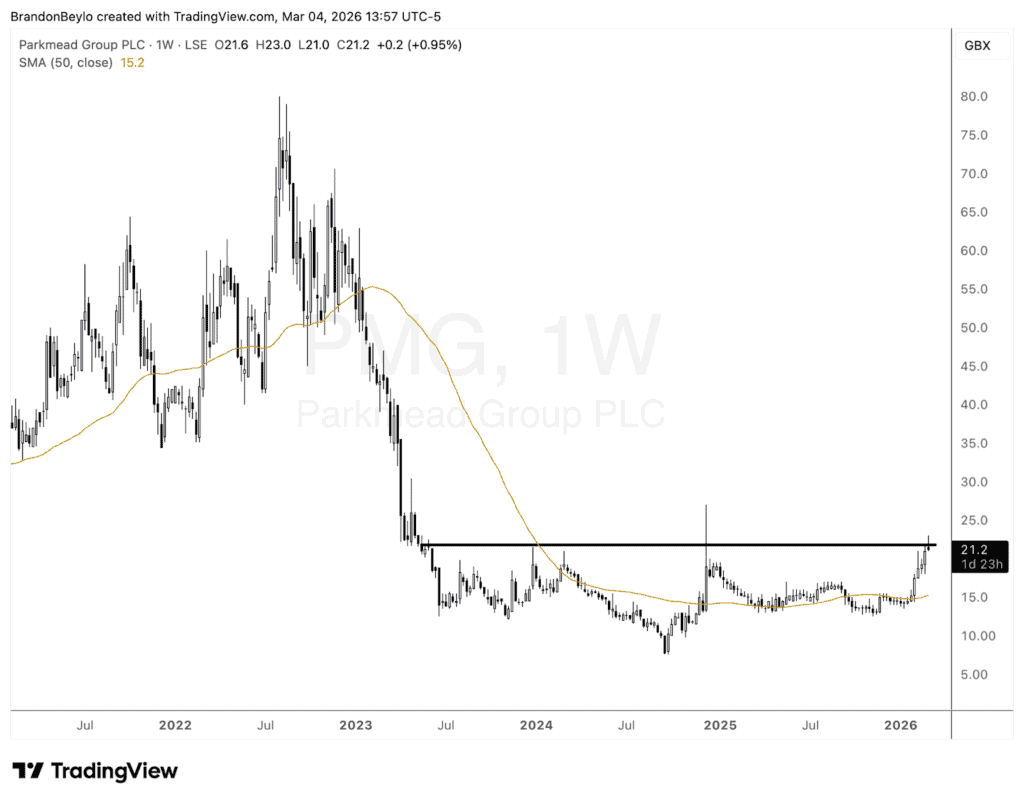
Parkmead Group (PMG.LSE)
PMG is for those who love London-based, left-for-dead, micro-cap companies (does that person actually exist?).
The company trades for a $33M market cap with $16M in net cash (50% of MC) and no debt. Historically, the company had a mix of exploration, development, and renewables assets in the UK and the Netherlands.
At today’s price, you’re getting the operating company for $16M in cash and 0.9x book value. Who knows how much book value is actually worth? But the stock is bouncing around support as energy/natural gas enters an upcycle.
Healthcare: Strongest MoM Inflection
Healthcare is eighth in our RS Inflection Sector Ranking and had the strongest inflection within its sub-industry (Equipment and Supplies).
This is another reason I love the RS Inflection Report. I haven’t touched healthcare this year. The only connection I have with healthcare stocks is hearing Druckenmiller call healthcare and biotech “the best use case out there of AI.”
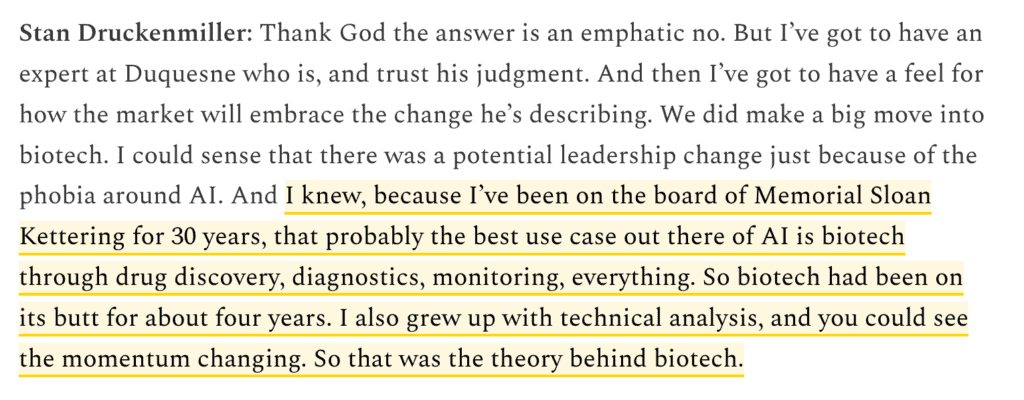
I don’t know … if it’s good enough for Druck, it’s good enough for me. Here are a few interesting names in the healthcare/biotech thematic.
Legend Biotech Corporation (LEGN)
LEGN is a $3.4B market-cap company that discovers, develops, manufactures, and commercializes novel cell therapies, primarily for oncology. According to Koyfin, its lead product candidate is ciltacabtagene autoleucel (cilta-cel), a chimeric antigen receptor (CAR-T) therapy for the treatment of multiple myeloma (MM).
The company also has a portfolio of earlier-stage autologous CAR-T product candidates targeting various cancers, including Non-Hodgkin Lymphoma (NHL), acute lymphoblastic leukemia, gastric cancer, esophageal cancer, pancreatic cancer, colorectal cancer, hepatocellular carcinoma, small cell lung cancer, and non-small cell lung cancer.
The stock is down ~50% since its 2021 IPO. Bombed-out biotech trading near its lows, what’s to like? A lot, actually.
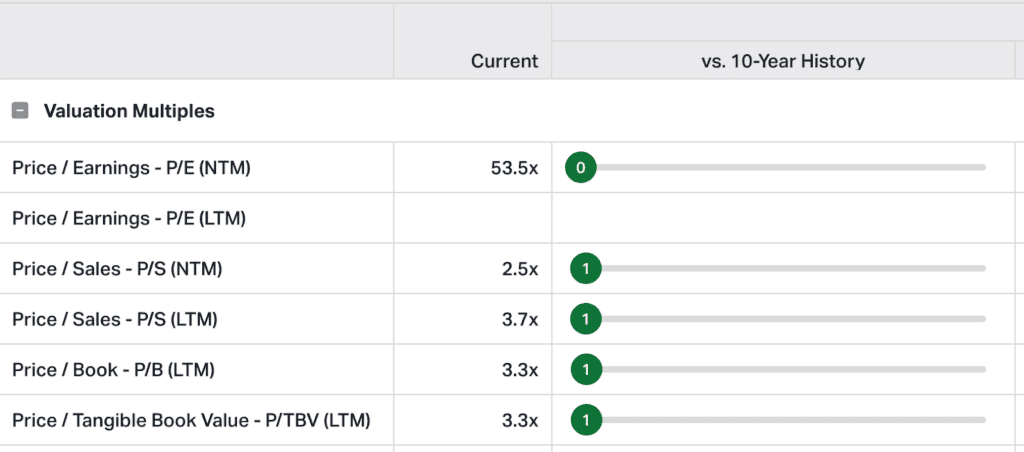
LEGN trades at the cheapest level in its 10-year history at 2.5x NTM Sales and 54x earnings (at least it has earnings!).
Now look under the hood. Since 2021, LEGN has grown revenue from $69M to $909M, increased gross profit from -$245M to +$133M, and reduced net losses from ~$400M to $240M.
Everything about the business has improved except the share price (see below).
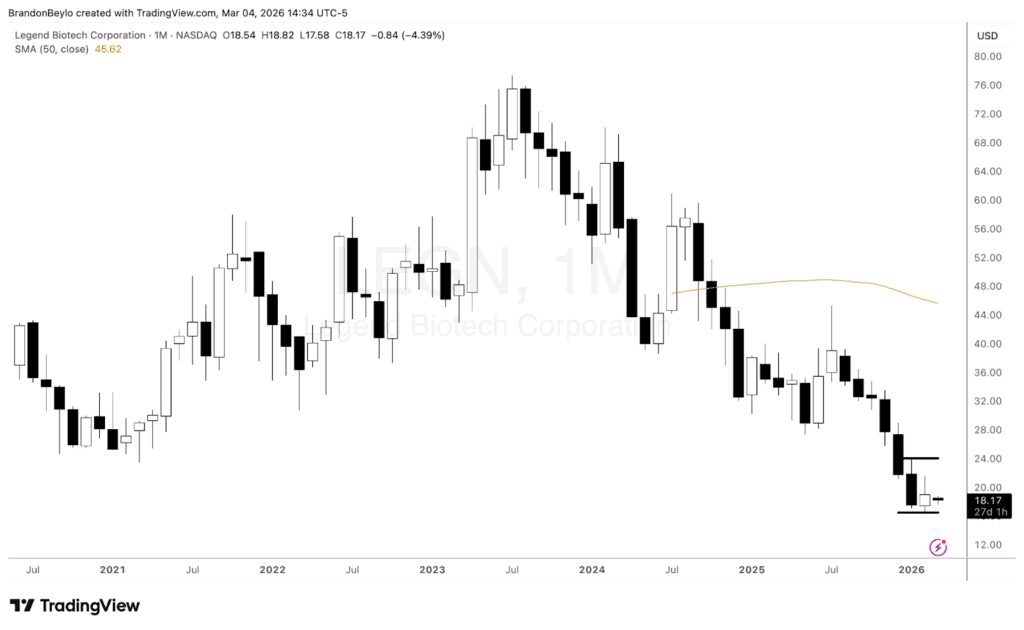
The company reports earnings in six days. I have an alert set for a breakout above its January 2026 highs, signaling a mean-reversion long setup.
OrthoPediatrics Corp (KIDS)
Going back to Druck’s comments on AI-winners within healthcare/biotech, I wonder if orthopediatrics would fall into that category. My high-level thesis is that AI will enable better, cheaper, and more anatomically aligned prosthetics and deformity correction products (KIDS’s core market).
Additionally, there could be an element of “brand trust” within this orthopedic segment. Take bike helmets, for example. Does everyone wear MIPS helmets because they’re the best product on the market? Probably. But could the reason also be simply that everyone else wears MIPS helmets?
I wrote about MIPS’s economic moat here.
Who knows. Maybe parents feel more comfortable with a “KIDS-specific prosthetic or deformity device” than other products.
That said, the company appears to be inflecting as it bounces off all-time lows. Here’s a snippet from the latest earnings report.
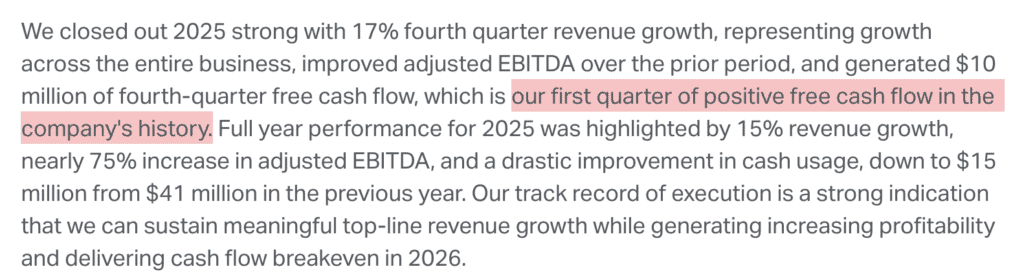
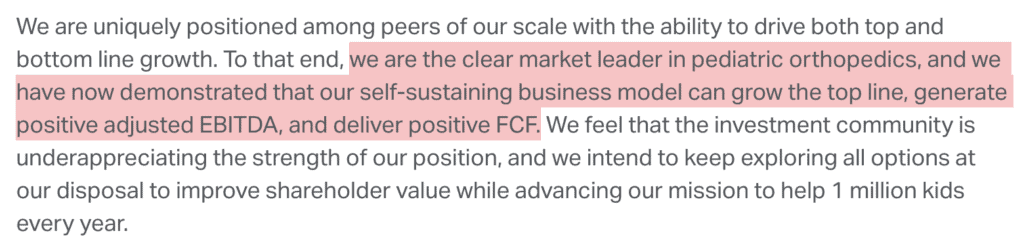
The business is inflecting positively, while the stock remains at all-time lows and is at its most fundamentally cheap. KIDS trades at 2x NTM EV/Sales and 3x gross profits. This is the same company that grew revenue by 15% YoY while generating positive FCF for the first time in the company’s history.
Since its inception, KIDS has traded at an average EV/Sales of ~6x. The stock is a double if it trades within a 1std range around 3.5x current sales.
Check out the monthly chart.
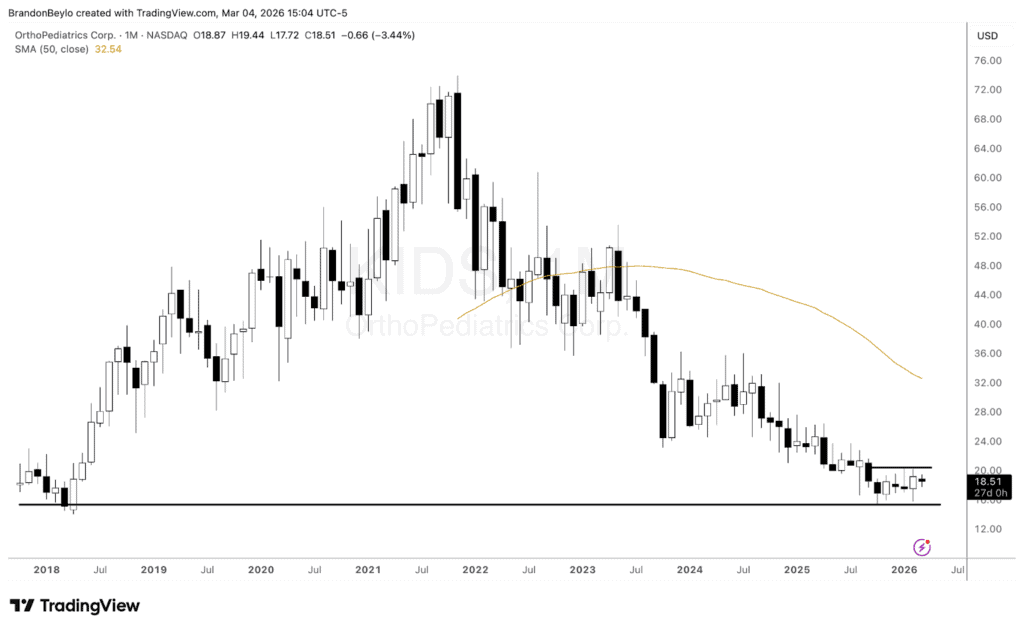
This is a stock that’s been left for dead at the exact moment its fundamentals are inflecting higher … not to mention the potential AI benefits along the way. You have a clear R/R setup to buy above this consolidation, with a stop below the all-time lows.
That’s all for this week.
If you’re interested in joining and learning more about our Trifecta Lens Process, click the link below.
Again, we’re raising prices soon. Not as a gimmick. We’re keeping the community at a size where it actually works, not to mention a few new tools, products, and in-person events that get us pumped. If you’ve been on the fence, it’s time to jump!