For the second installment of our Economic Indicators Series, we’ll be reviewing the retail sales number.
Sure, it isn’t as fun to talk about as the next 10-bagger, but retail sales offer valuable insights into the health of the economy. This indicator, in conjunction with others, can alert us to potential bear markets or dip-buying opportunities. Keep in mind that there’s NEVER a holy grail in trading or investing. Instead, indicators help us better define the probabilities of a specific scenario playing out. They paint a contextual picture. They do not simply print an answer.
The U.S. Census Bureau releases the retail sales report on the second week of every month. The report’s numbers are created from questionnaires mailed to approximately 4,700 randomly selected firms from the larger Monthly Retail Trade Survey (MRTS).
The month-over-month (MoM) change in retail sales is reported alongside the year-over-year (YoY) change. The Census Bureau also publishes the number Ex-autos, which removes auto sales due to their high prices and volatility.
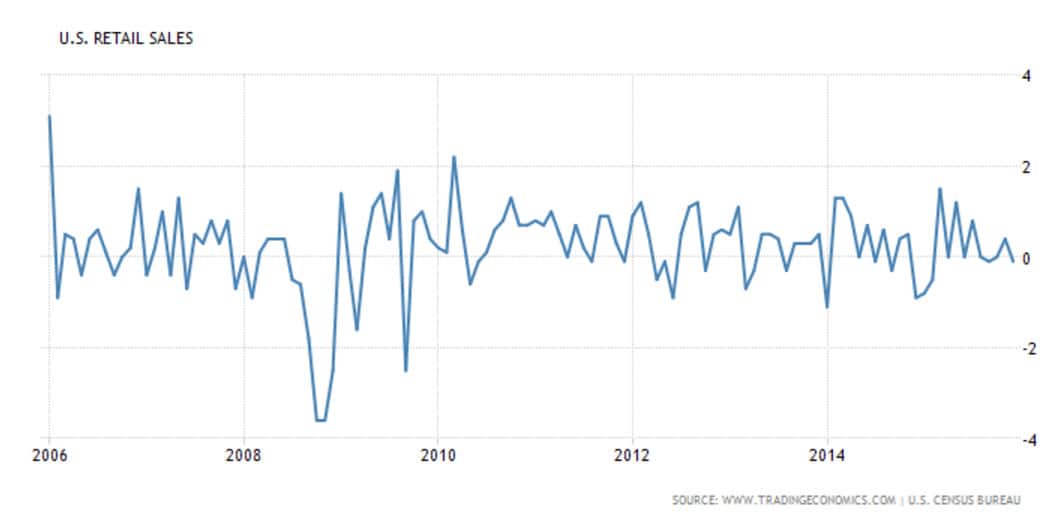
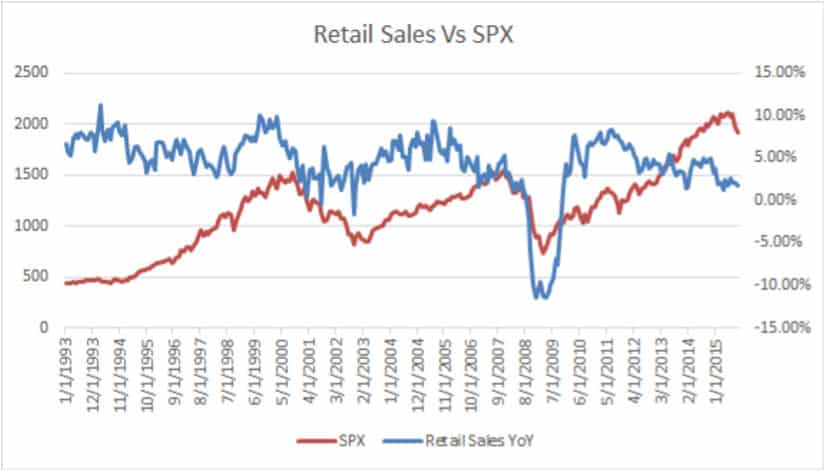
We feel the MoM numbers produce a noisy data set. As you can tell by the graph below, they don’t offer much insight.
But the YoY data trends better which makes it easier to draw conclusions from:
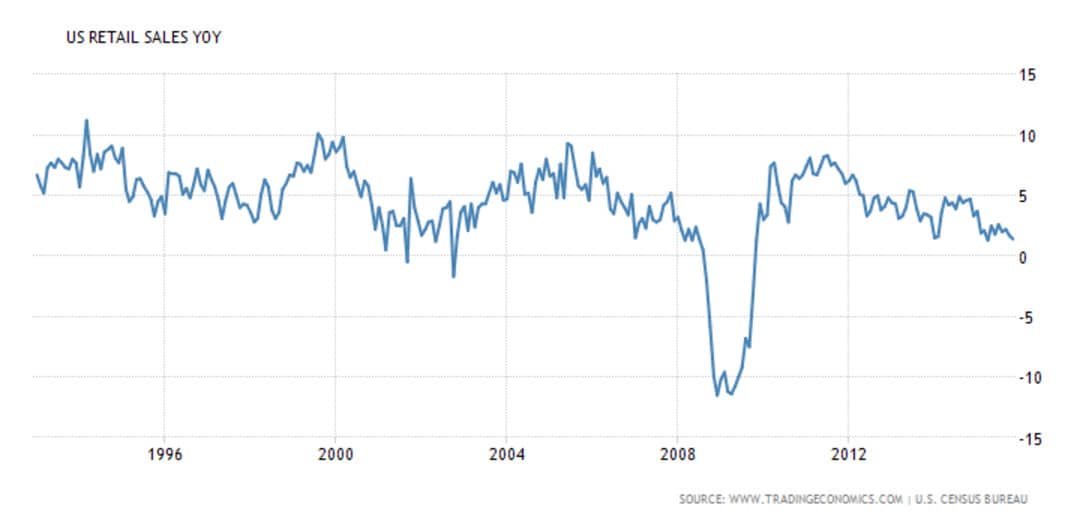
A decline in YoY retail sales usually signals a decline in the health of the American consumer. A downward trend or a print below 0 should sound your recession alarm.
For stock pickers, the report also includes more specific data on individual industries. These sections are helpful to determine if your stocks are relatively strong or weak within the retail sector.
A snapshot of the report below shows an example of this breakdown.
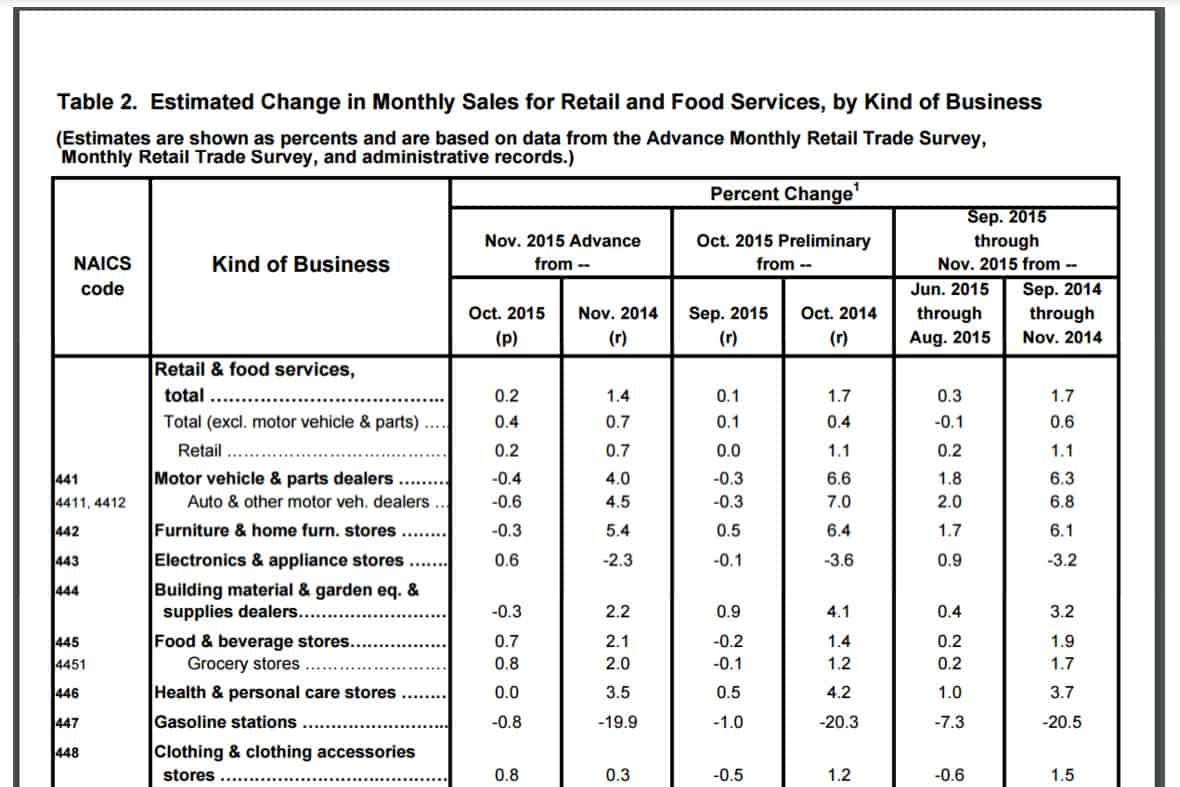
The first row — “Retail & food services, total” — lists the headline numbers. This example shows a 0.2% MoM change and 1.4% YoY change. The second row lists the number “Ex-autos.”
The other rows give quality insight into the exact breakdown of retail activity. Autos, food, and gas are always the most volatile, so larger month-to-month swings should be expected.
Trader’s Takeaway
The purpose of the Economic Indicators Series is not only to learn what various indicators mean, but also how they can make us money. As investors who trade real money with our own research, we always need to find actionable takeaways from our data analysis.
In this study, we created a YoY retail sales time series. We used the grand total of all industries including autos and food services for the calculation. (The number corresponding to the first row of the report shown above.)
From there, like our ISM study, we calculated the 12-month returns of the S&P 500 index after each data release. In other words, we looked at the retail sales number for a particular month and then calculated whether the S&P 500 finished higher or lower at the end of the following 12 months.
The study focused on finding whether low retail sales numbers could signal the start of a bear market or recession. Looking at the graph below, we decided to test what happened to the market when the YoY retail sales number was between 3% and -3%. The available data stretched back to 1993. You can see the data plot below. Our results follow.

We found that out of the 39 occurrences, the market closed in the negative one year later 27 times. This means that if retail sales are between 3% and -3%, the S&P 500 will be lower 12 months later 69% of the time!
We also evaluated extreme negative readings to see if they would alert us to “oversold” conditions. We predicted they could signal a cheap market prime for a bounce.

We once again saw confirming results. Out of 13 occurrences of retail sales under -3%, the market closed positive one year later 12 times. Extreme negative readings of the retail sales number indicate that the market will bounce in the next 12-months 92% of the time!
The market moves cyclically with the booms and busts of the business cycle. Retail sales appears to be a valuable indicator to help see which part of the cycle we’re headed into.