Time is the dominant factor in gambling. Risk and time are opposite sides of the same coin, for if there were no tomorrow there would be no risk. Time transforms risk, and the nature of risk is shaped by the time horizon: the future is the playing field. ~ Peter Bernstein, “Against The Gods”
–
In this week’s Dirty Dozen [CHART PACK], we talk 2020 secular trends, record streaks of pessimism, improving hard data, bad regimes and big pictures, EURUSD a bit long in the tooth, and a speculative potash play, plus more…
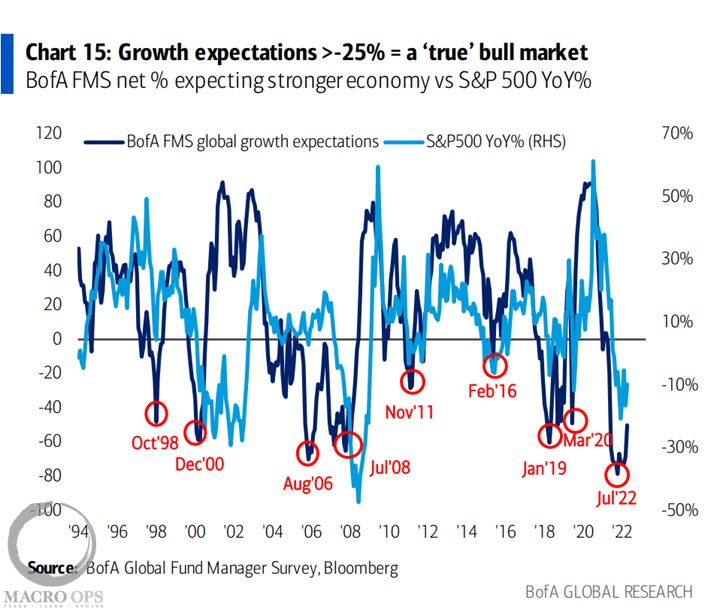
- 2020 Secular Trends via BofA’s Flow Show… (highlights by me)
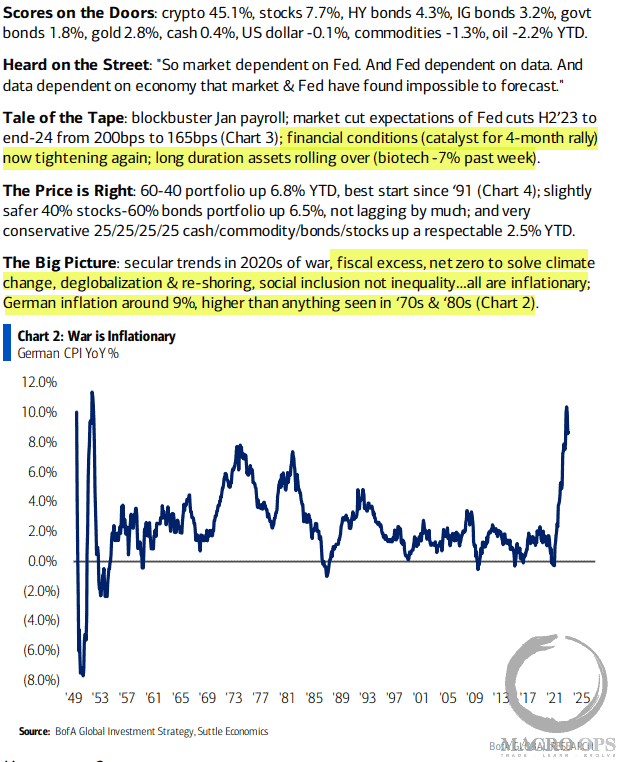
- Something that everyone knows isn’t worth anything…
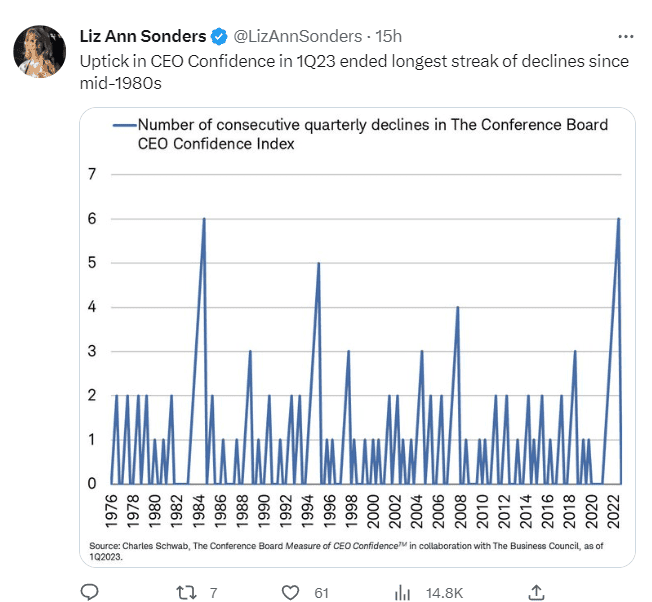
- Lacking Confidence: Last week, CEO Confidence ended its longest streak of declines in nearly four decades.
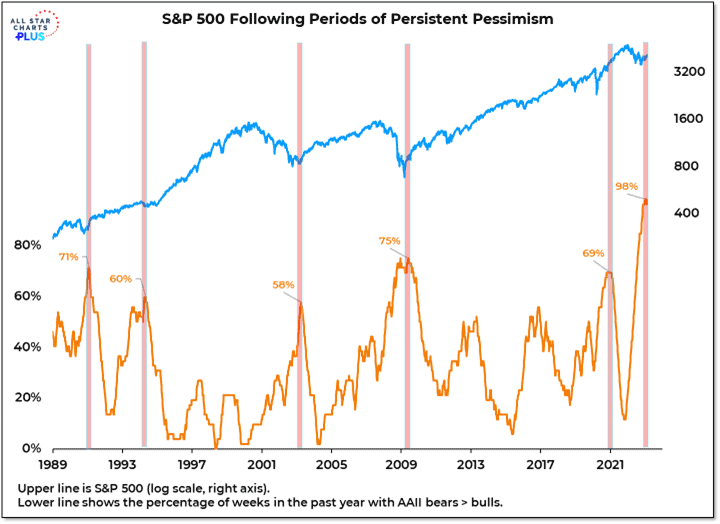
- Bears everywhere: While AAII bears > bulls survey ended its longest streak of pessimism on record… (chart via All Star Charts)
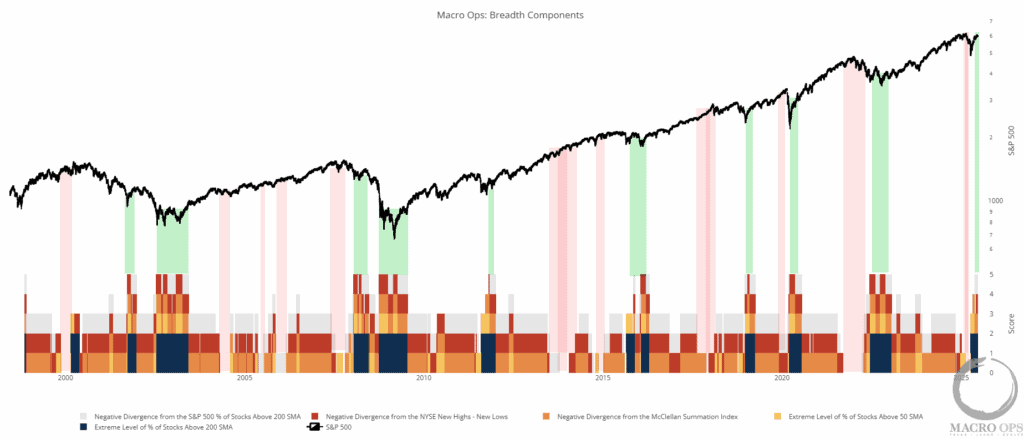
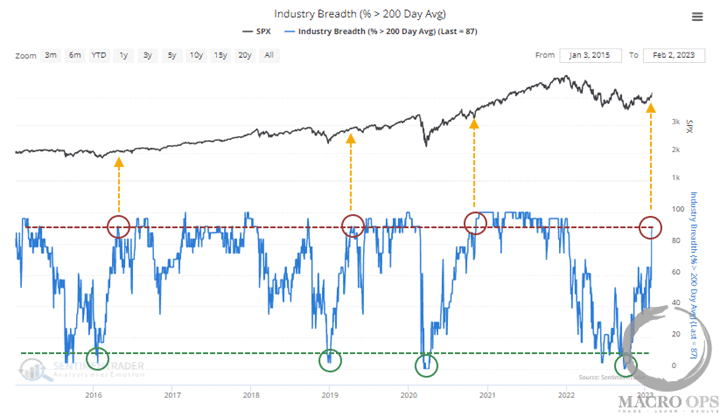
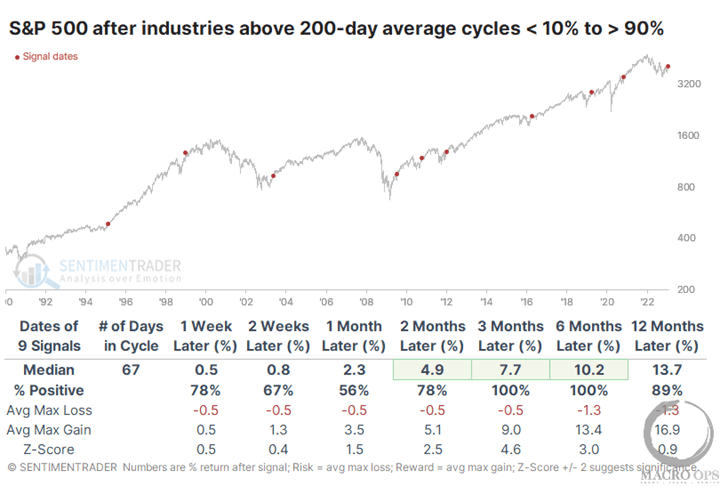
- But, as we’ve been writing since October, things have been starting to become less bad. Here’s a chart showing the Industry Breadth (% > 200-day avg) back above 90% (chart from SentimenTrader).
- 100% odds: Here’s the market’s historical returns following similar trough-to-peak turnarounds, again via ST. Not too shabby…
- One of our contrarian calls over the last six months + is that the bears were getting ahead of themselves with the recessionary calls. They were putting too much weight on classical leading indicators without applying the necessary context to understand how this time is actually different, at least a little.
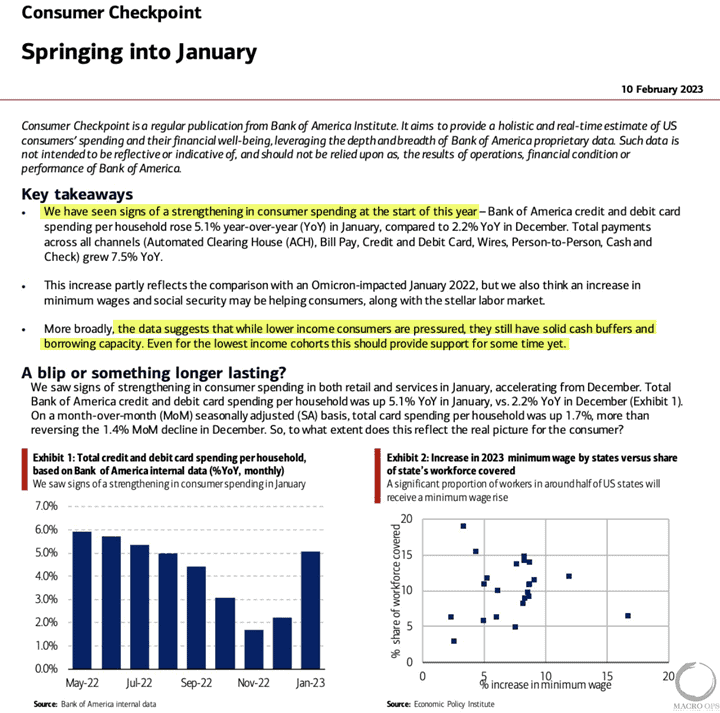
A recession is still coming but that won’t be until later this year. Strong household balance sheets and normalizing supply chains ensure the US econ will prove more resilient than the bears predict. And so far, the data is bearing this out. Here’s the latest consumer spending data via BofA with highlights by me (not recessionary).
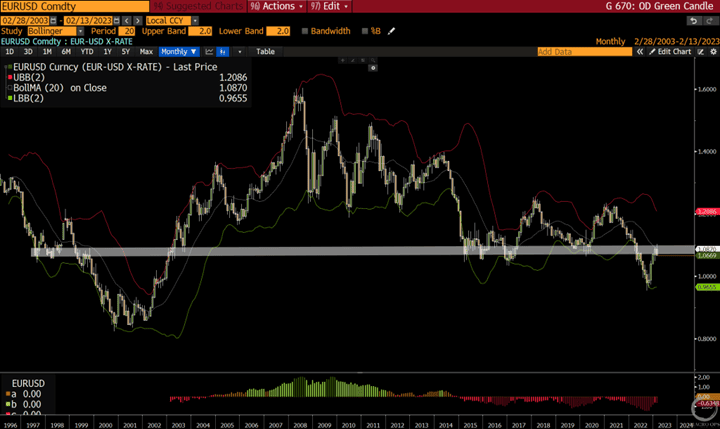
- We’ve been long EURUSD for the last few months but have been taking profits since the start of the year as EURUSD was up against this large supply/resistance zone (chart below is a monthly).
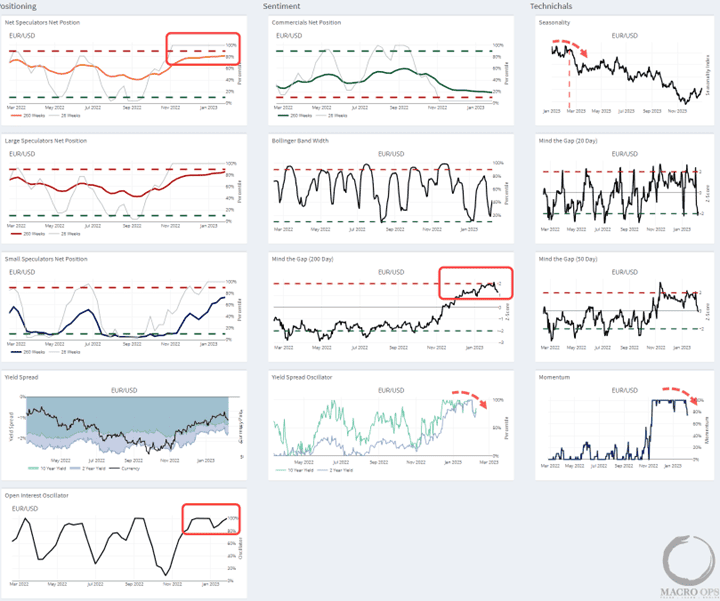
- The multi-chart view tab on our HUD shows Net Spec positioning has gotten crowded (orange line) while our Open Interest Oscillator (bottom left chart) recently hit 100%, showing lots of speculative interest. These types of conditions typically coincide with and/or form intermediate tops.
Plus, it’s coming off 2std above its 200dma (very overbought) and it’s about to enter its weakest period of seasonality for the year. Lastly, Yield spread momentum has turned over, which nearly always leads price.
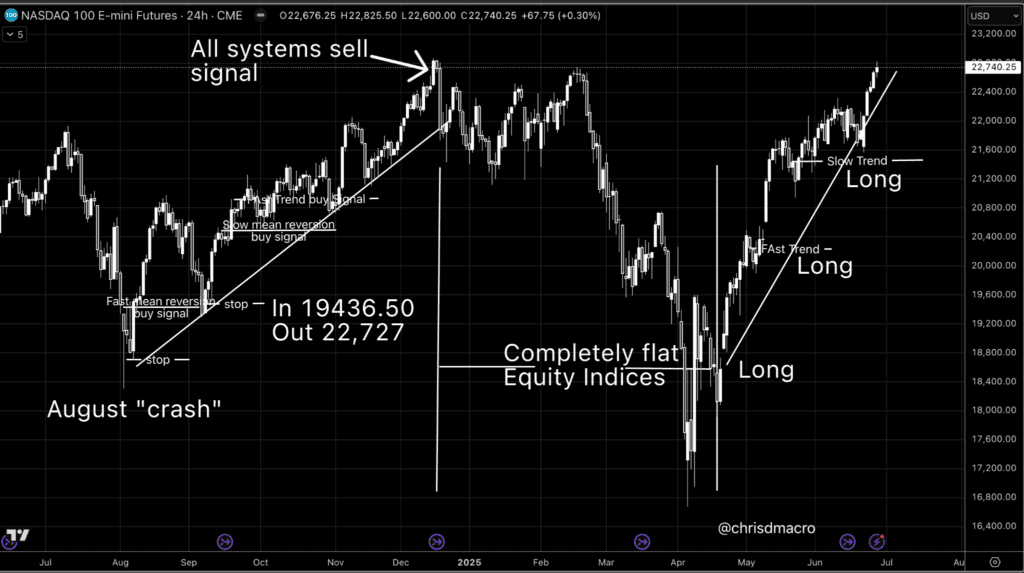
- We’ve been bullish equities since we called for a tradeable bear market rally in mid-October. That position has been playing out so far and we continue to expect higher prices over the interim.
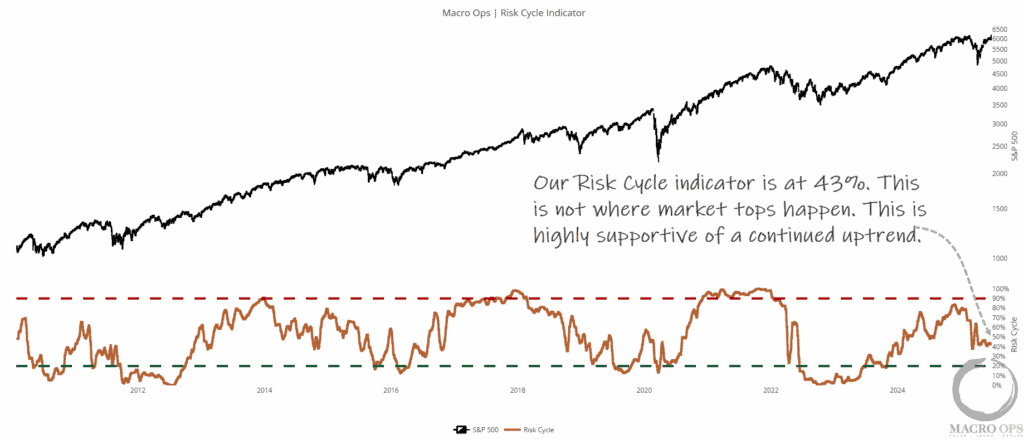
But… it’s important to step back and look at where we are, so we don’t lose sight of what type of environment we’re operating in, which right now isn’t a great one.
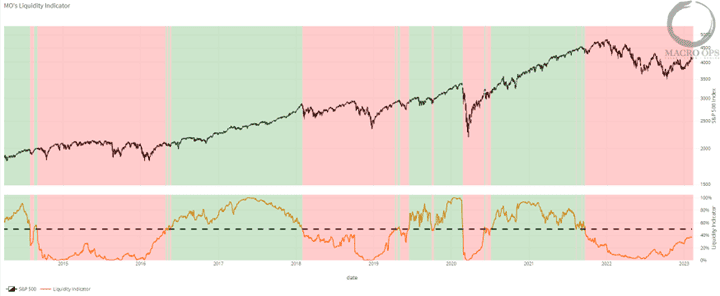
Our Composite Liquidity Indicator is still very much in the red. Risk assets don’t do well for long, in these zones.
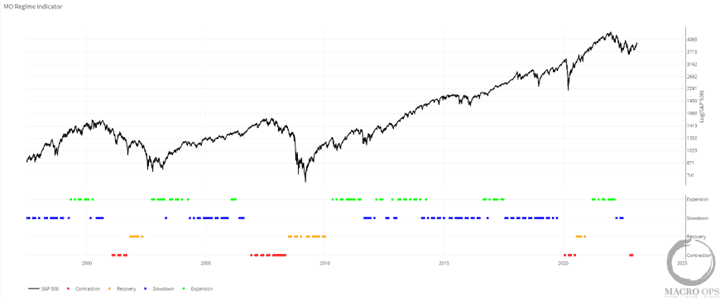
- While our Macro Regime Indicator is still in Contractionary Regime, which is the worst returning regime for stocks (though it’s the best for one for gold).
So while we continue to play this bear market rally. Let’s not forget that it is a bear market rally. The thing that will kill it is the thing that kills most countertrend rallies, sentiment/positioning running into deteriorating liquidity. In this case, rising yields.
Let’s see how quickly yields rise and sentiment flips bullish then.
- In my note over the weekend to Collective members, I shared my thoughts on recent developments in the Russo-Ukraine war and why the conflict was about to escalate, significantly.
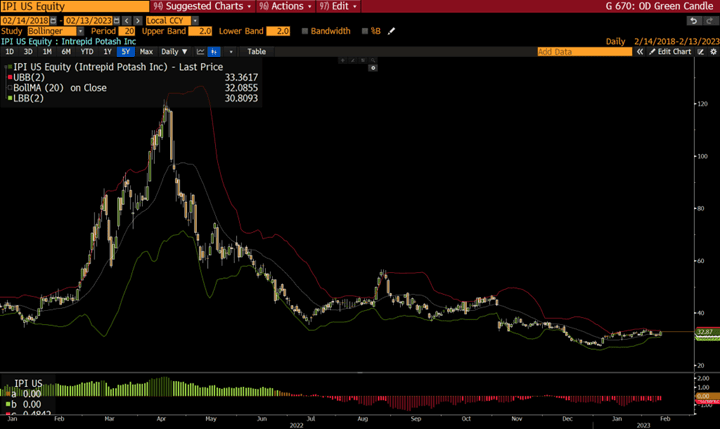
Anyways, there are a number of ways to play this fact, which I discussed in the note. But one parallel and more speculative trade I’m considering is long Intrepid Potash (IPI).
IPI is a small US-based Potash producer with a call option on Permian basin water rights. The company has a solid balance sheet. The stock trades at 9x FCF. And it has a tiny 9mn share float.
Thanks for reading.
Stay frosty and keep your head on a swivel.