You can’t build in a feedback or reactive model, because you don’t know what to model. And if you do know — by the time you know — the odds are the market has changed. That is the whole point of what makes a trader successful — he can see things in ways most others do not, anticipate in ways others cannot, and then change his behavior when he starts to see others catching on. ~ Richard Bookstaber
In this week’s Dirty Dozen [CHART PACK] we go over the technical and positioning outlook for oil, then dive into the Mexican Peso and look at its potential reversal, before finally going through some bear porn and historic pessimism in utilities, plus more…
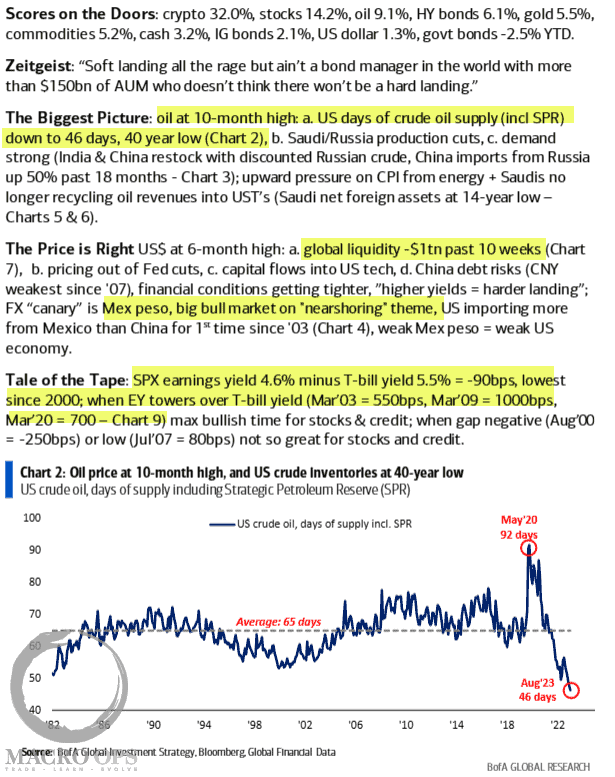
1. BofA’s latest Flow Show summary with highlights by me.
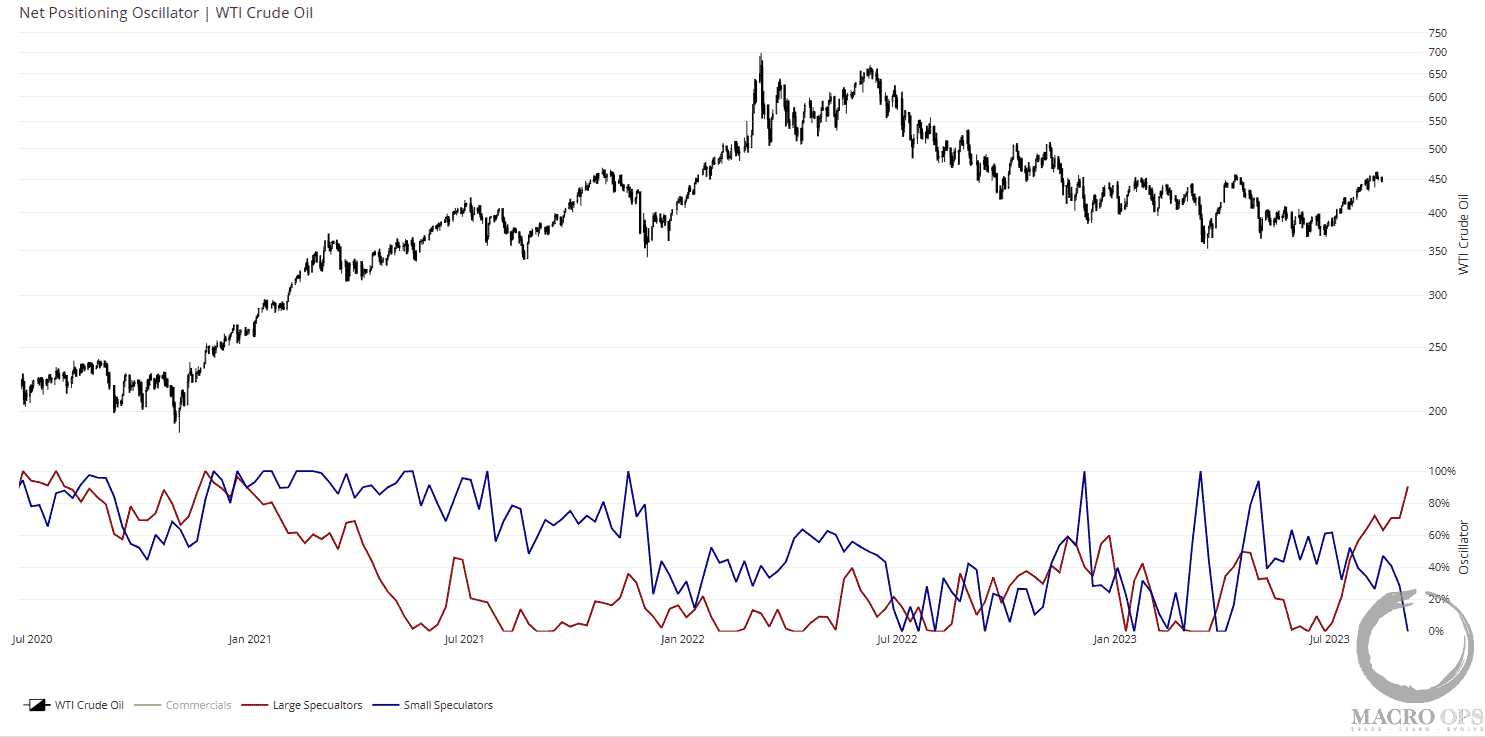
2. We highlighted the bullish setup in crude before its major breakout back in early July (link here) and then again two weeks ago here.This one has played out nicely since but the tape is now 2std above its midline so we should expect a pullback or some consolidation as the forces of mean reversion do their work.
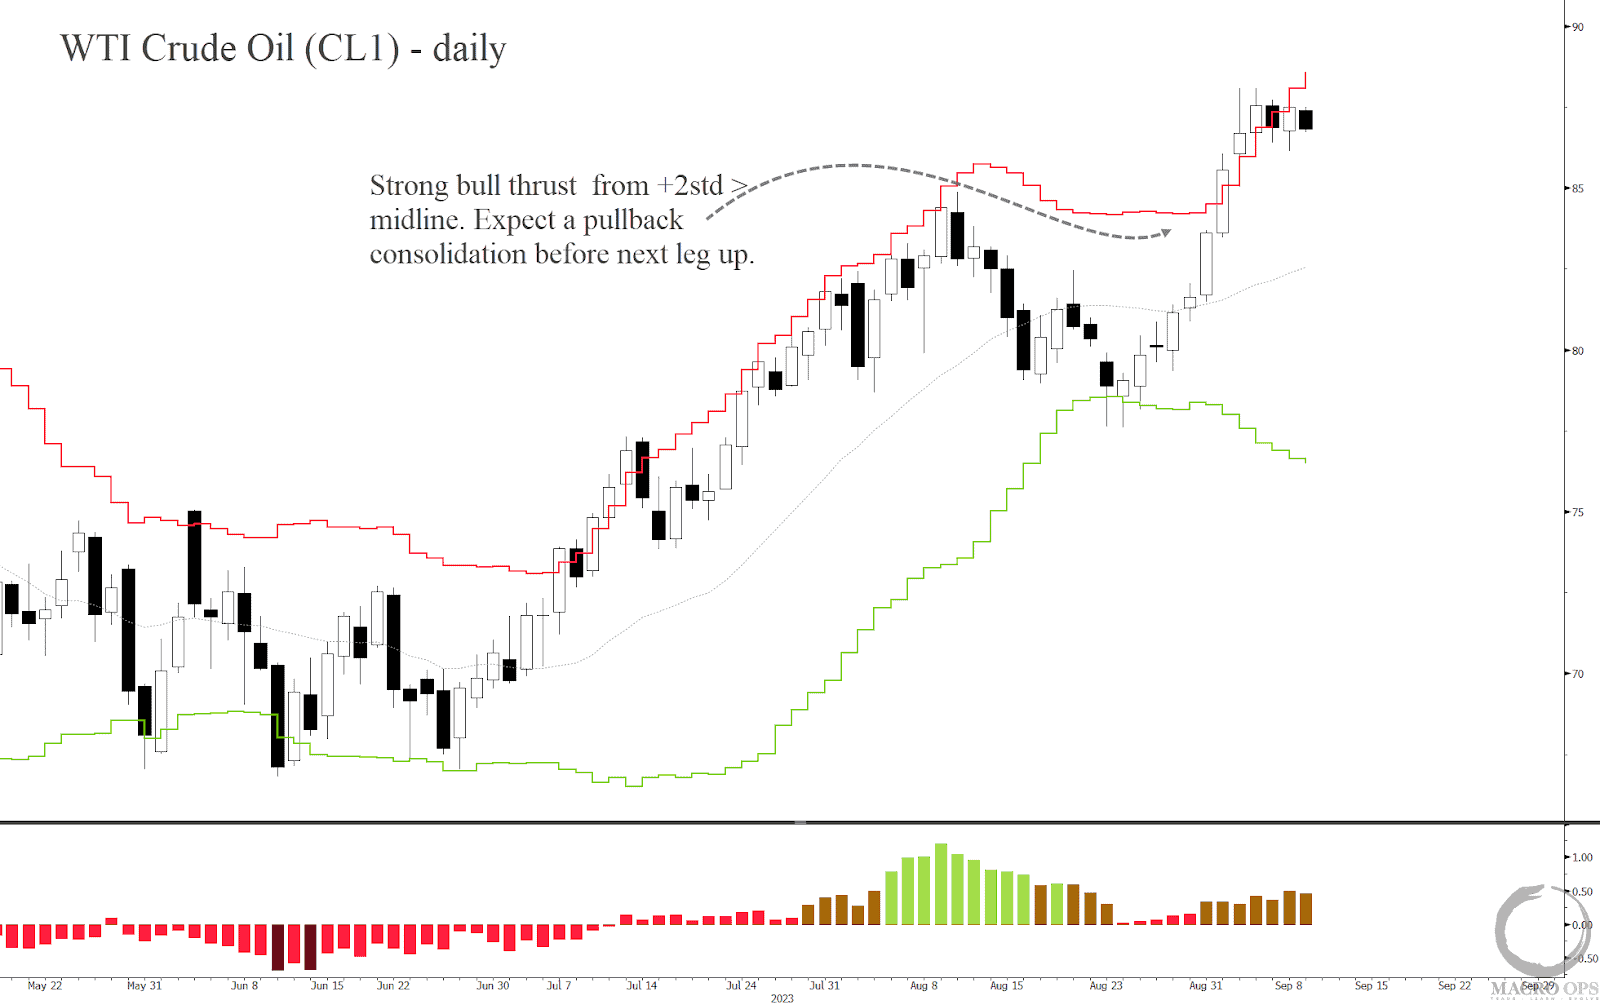
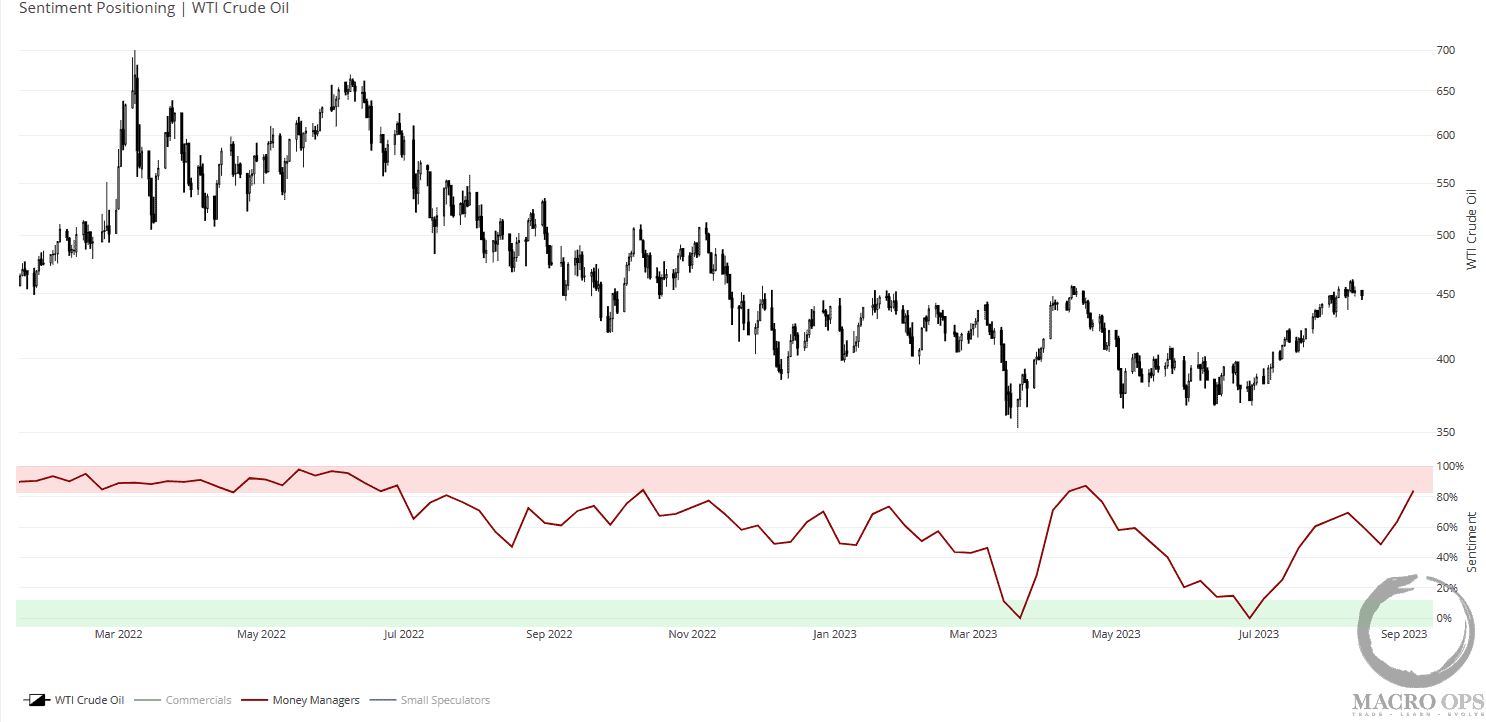
3. Bigger picture we are less bullish on crude than we were three months ago. The mainreason is that positioning and sentiment have flipped from very bearish to bullish. Both large and small specs are long with large specs above their 90th 1yr percentile. We measure asset manager sentiment in a novel way and that has flipped from giving a buy signal back in July to a sell signal last week.
Also, I occasionally check in on the financial news TV throughout the week for a quick sentiment read, and energy equities along with buying the dip in tech/AI, seem to be the consensus “safe bets”.
So while I expect trend and momentum to carry oil higher over the next few weeks after a brief dip, we’re going to start paring back our energy exposure here at MO.
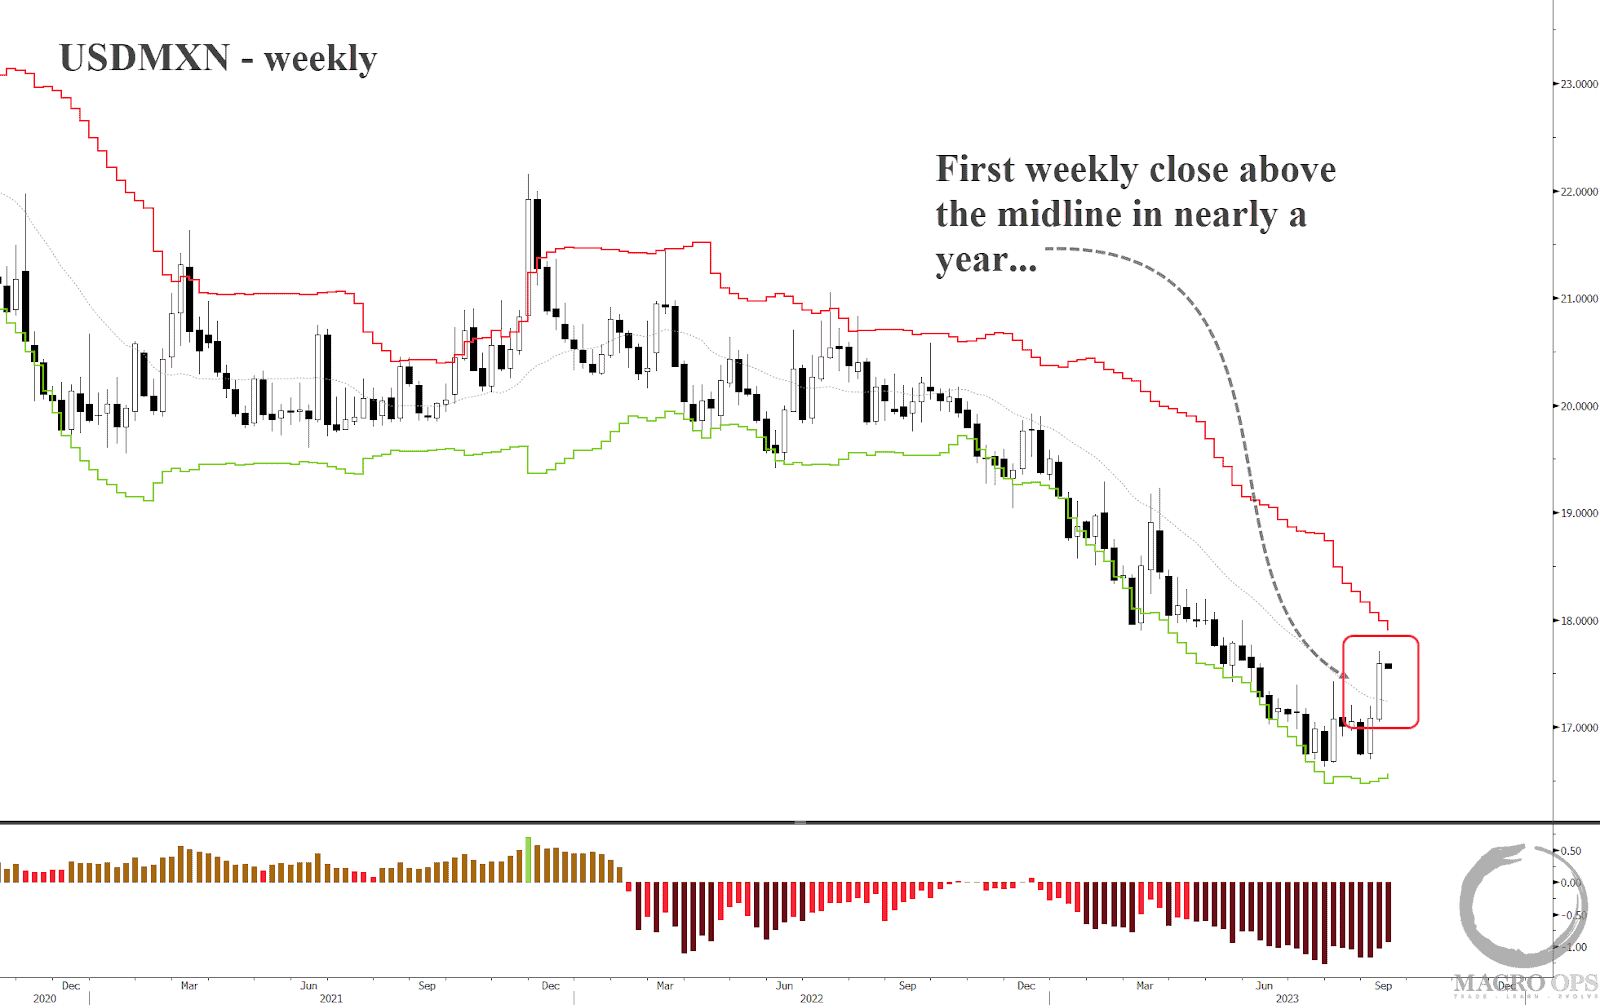
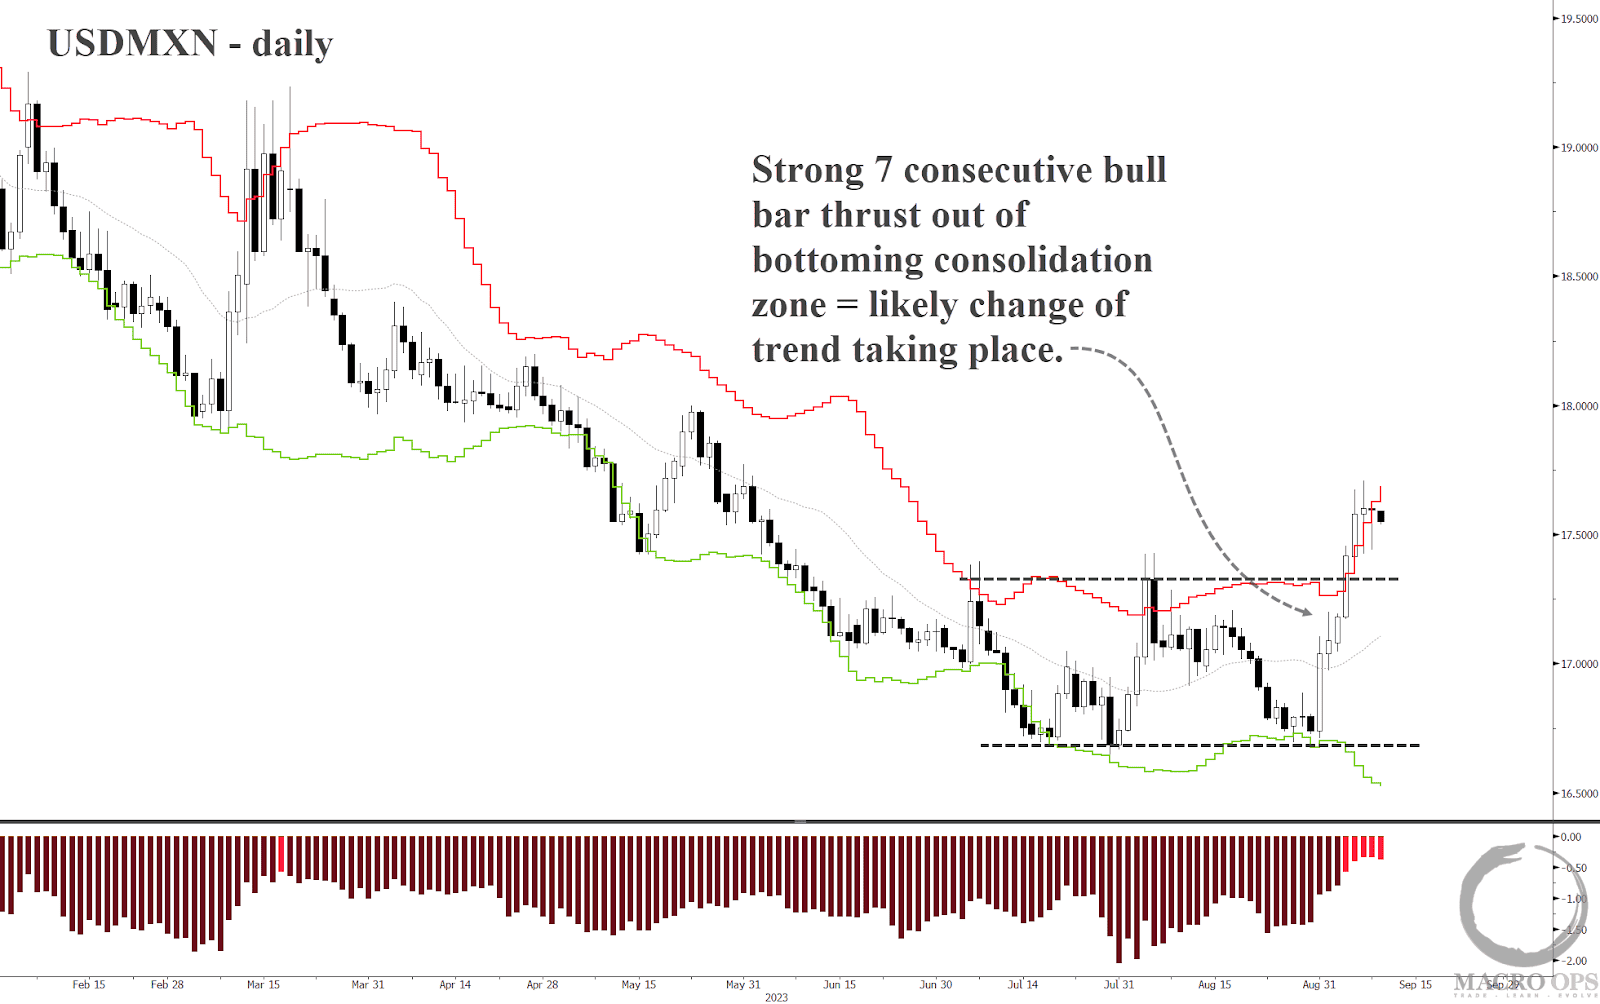
4. The USDMXN has finally put in a weekly close above its BB midline.
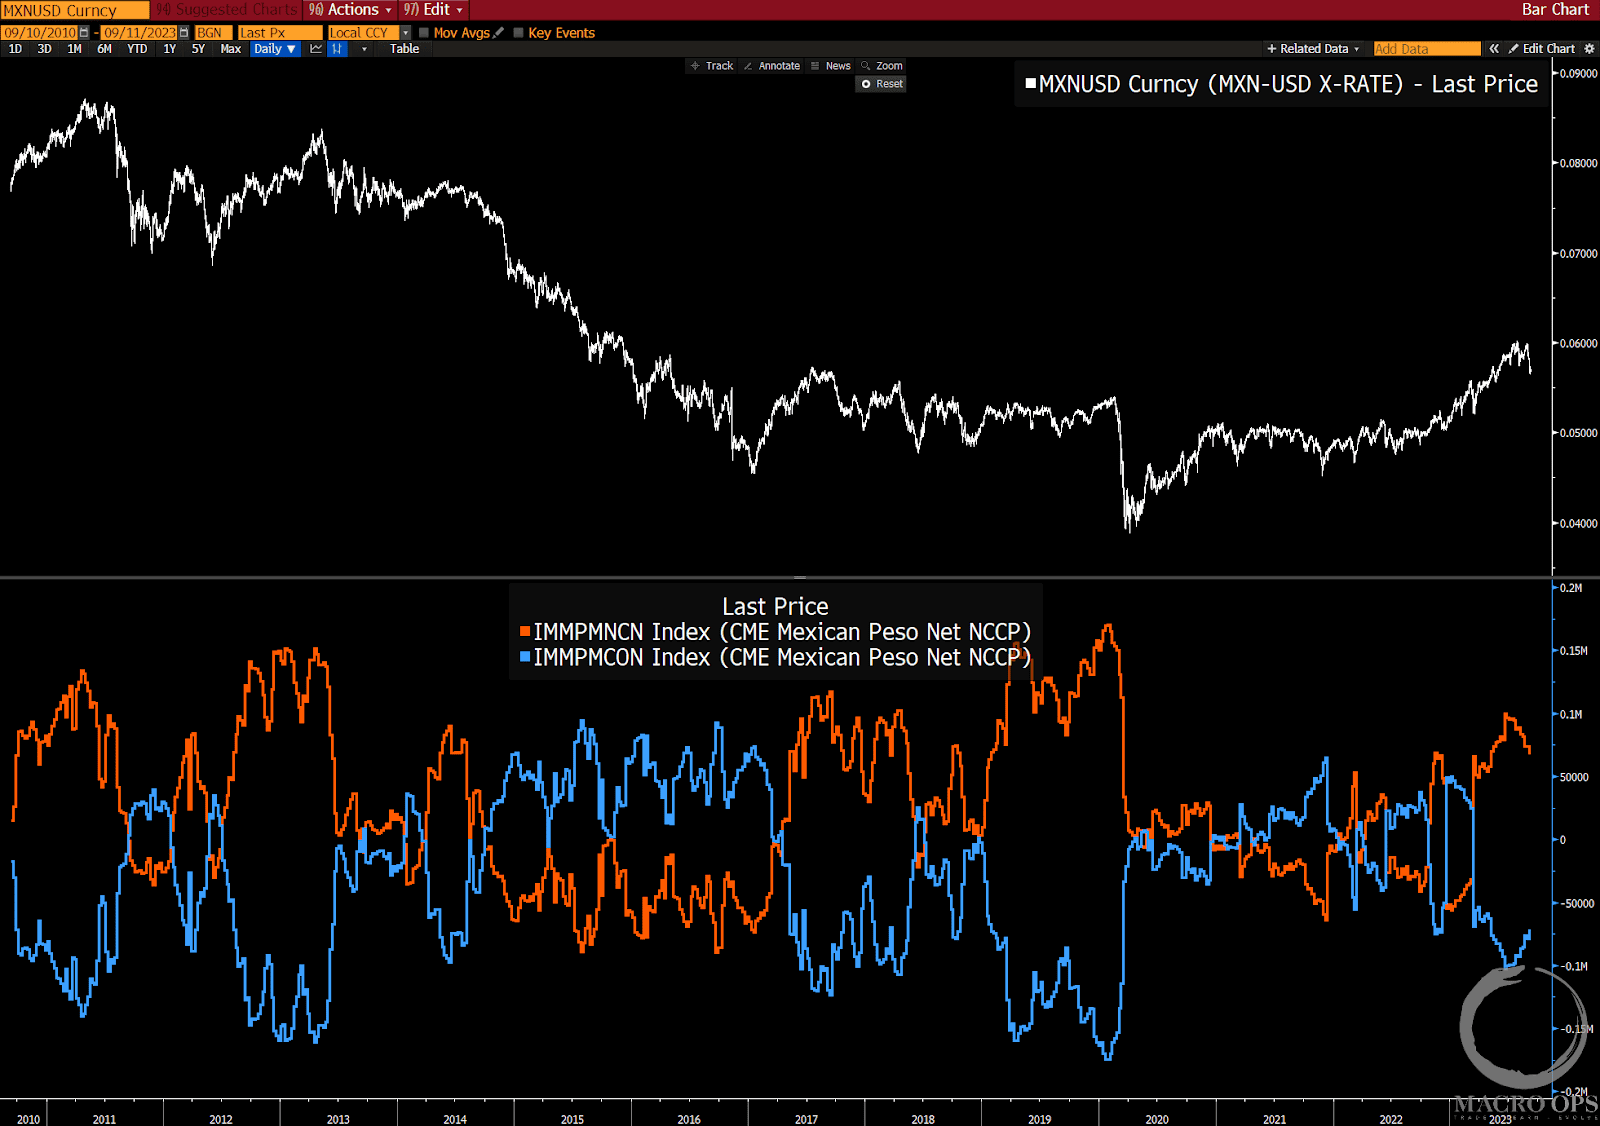
5. Net specs (orange line) are crowded long the peso.
6. The daily chart shows the setup. We have a strong seven consecutive bull bar thrust out from a bottoming rectangle pattern. This means odds favor a change of trend is taking place. USDMXN is often a good canary of inbound risk-off for the broader market, so maybe that’s what this is starting to sniff out here.
It’s extended from the midline but we’ll be buyers on a pullback or consolidation giving us a technical inflection point to nest in a stop.
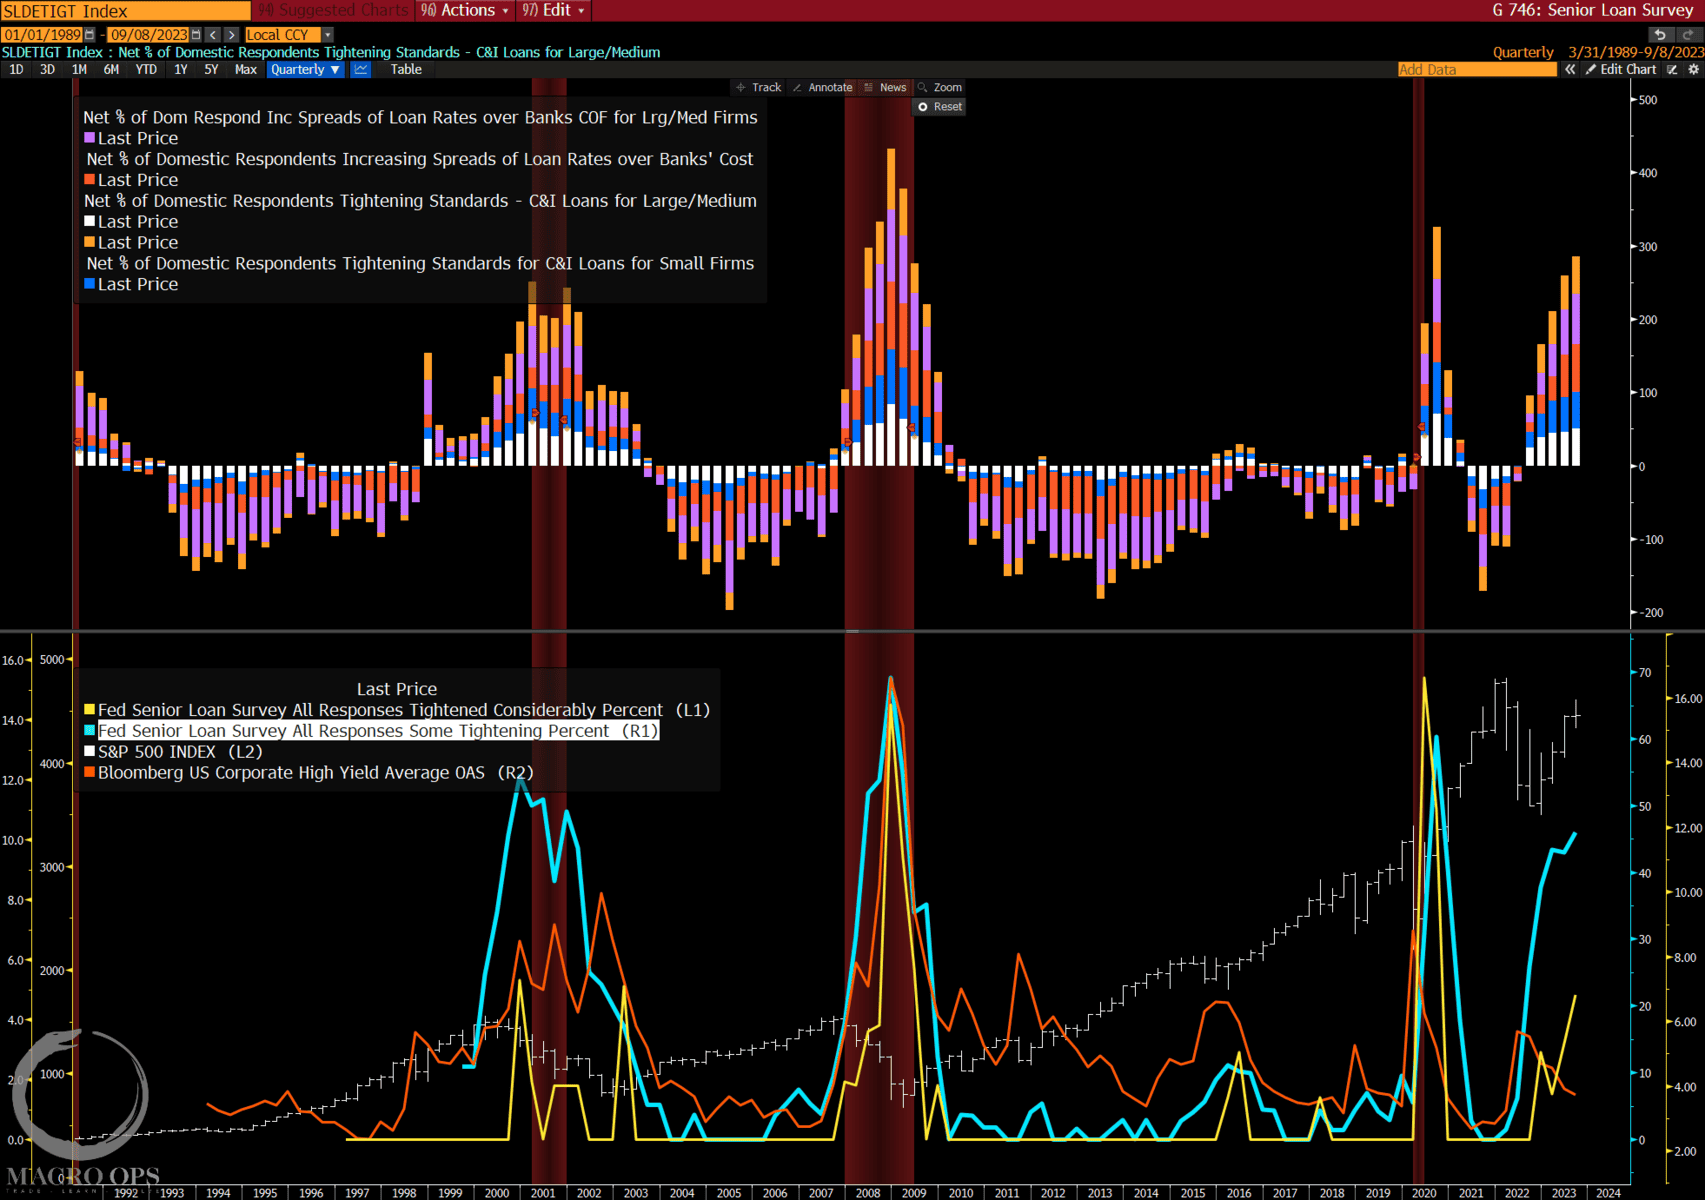
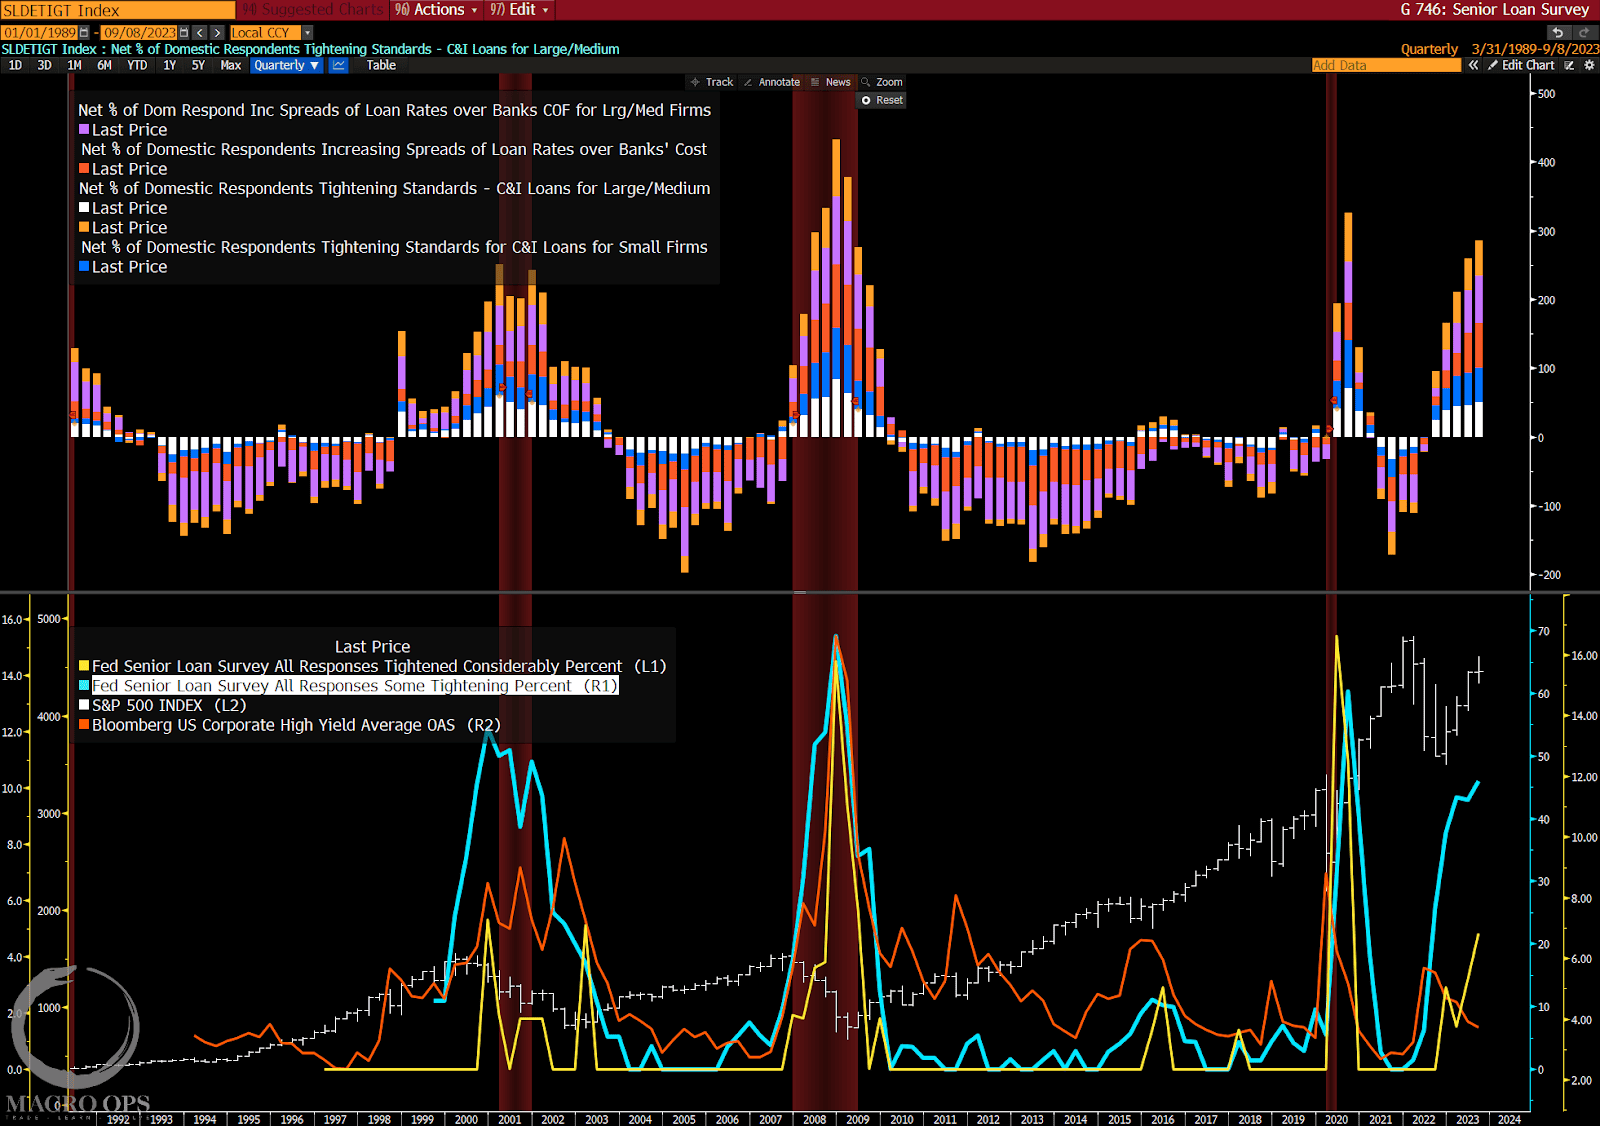
7. The disconnect between Senior Loan Officer (SLO) surveys and HY spreads continues to widen. My base case all year has been that we’ll see the US enter recession near the end of the year. Maybe that gets pushed back to Q1, I don’t know. Ultimately we’ll trade the tape. But seems to me that we’ll be entering 2024 with a sentiment and macro backdrop that’s the mirror image of what we started 23’ with.
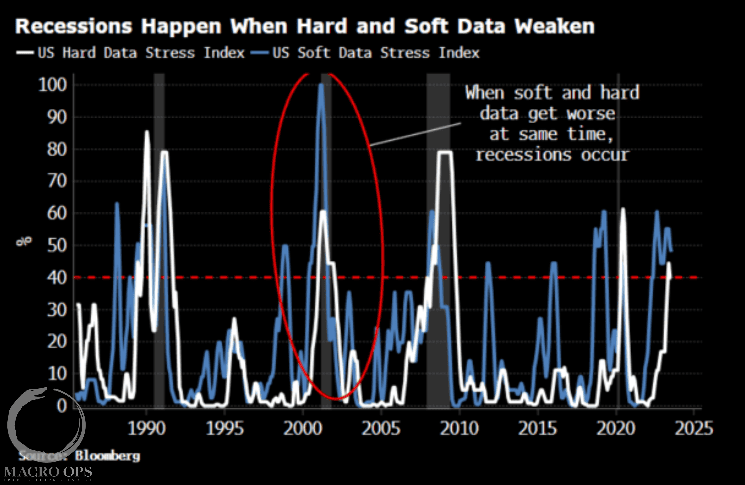
8. And because I’m seeing a lot more people talking about no landing / strong growth, which seems to be the consensus forming, I’m going to start talking the bear side a bit more around here.
This chart is from BBG’s Simon White. It shows the US Hard and Soft Data Stress Indices, which are both at levels that have preceded recessions in the past.
On a side note I can’t find either of these on BBG. If you know the ticker for these (maybe they’re custom?), please let me know.
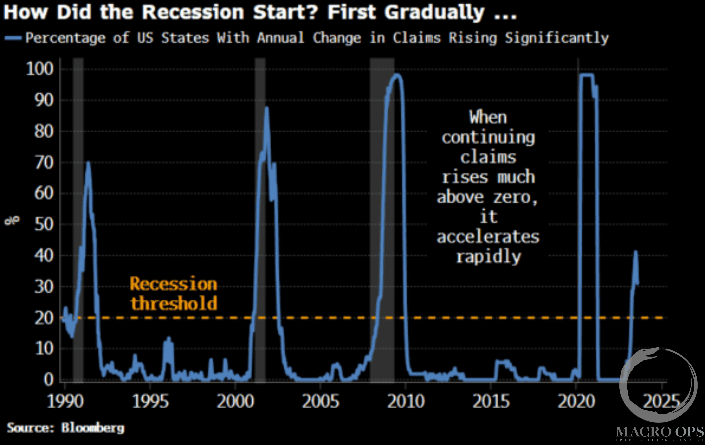
9. Another one from Simon showing the percentage of states with rising claims. Again, this looks like what we typically see in the quarters leading up to a recession. I’m definitely not suggesting we’re in a recession now. That’s certainly not the case. Just saying that the leads we track suggest one is likely around the turn of this year and the popular narrative has become completely dismissive of that possibility.
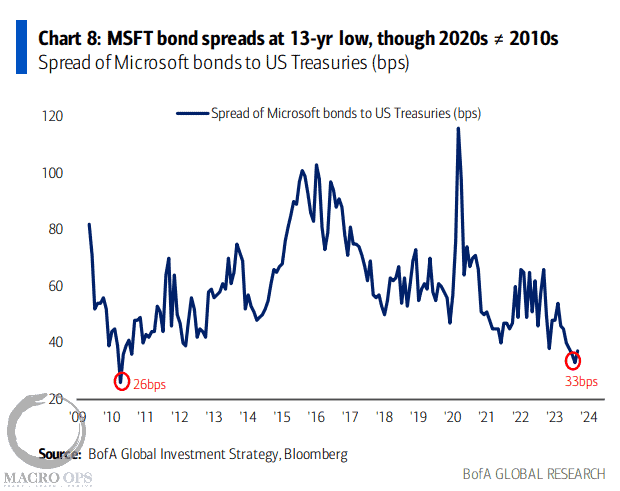
10. 33bps spread to Treasuries… when the best possible future has been priced in it leaves the door open for a lot of disappointment.
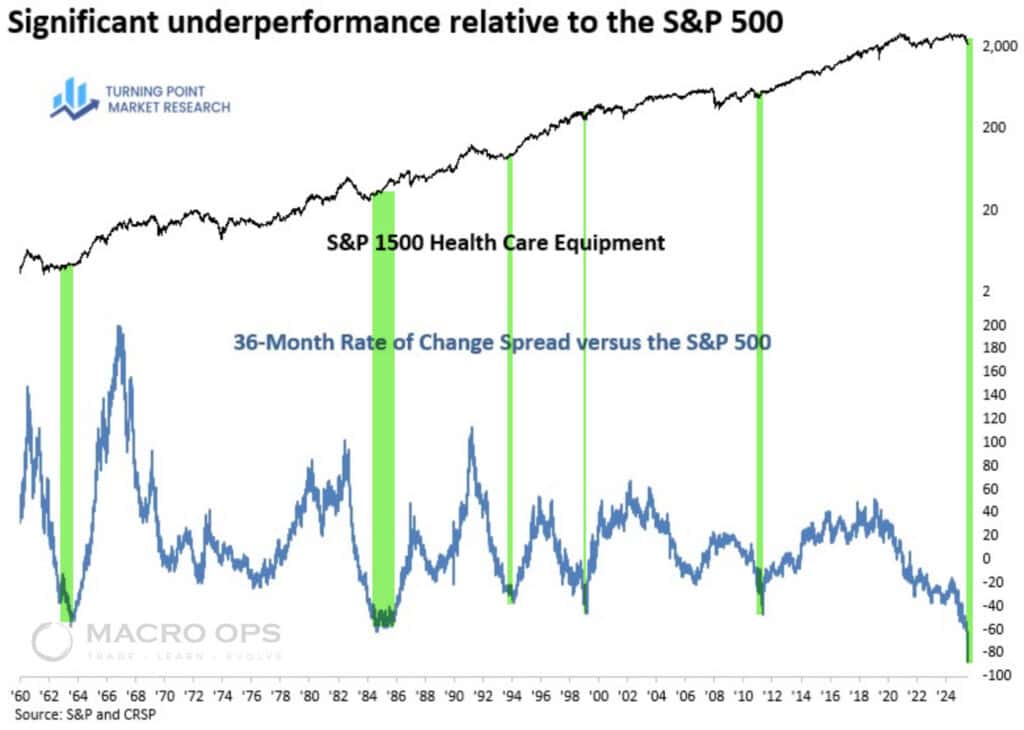
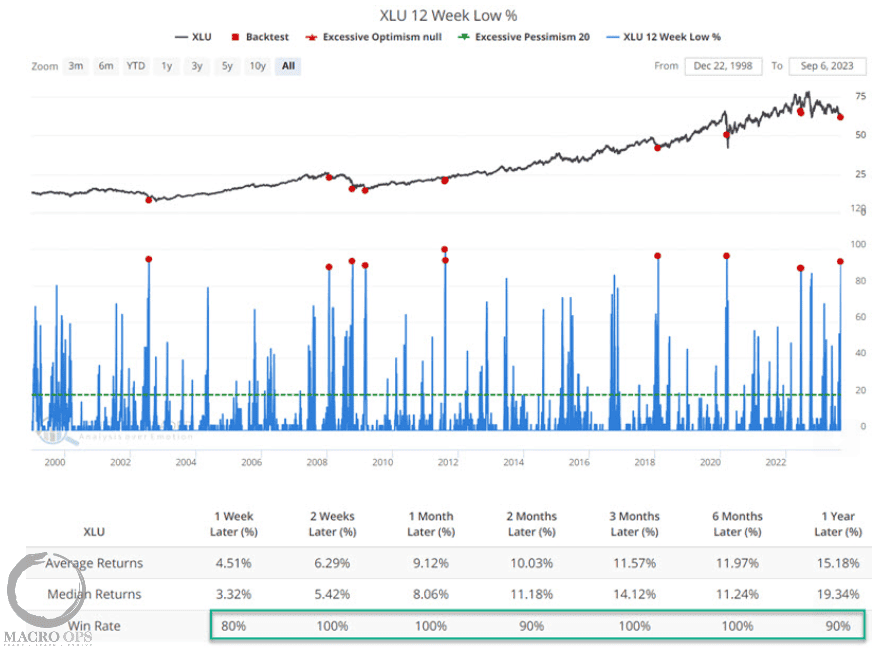
11. From SentimenTrader: “As the name implies, the XLU 12-Week Low % indicator shows the percentage of stocks in that exchange-traded fund currently trading at a 12-week low…Jay also showed that our calculation of correlation among companies in the sector is reversing lower from an extremely high level. After similar behavior, the sector showed exceptional 12-month returns.”
.
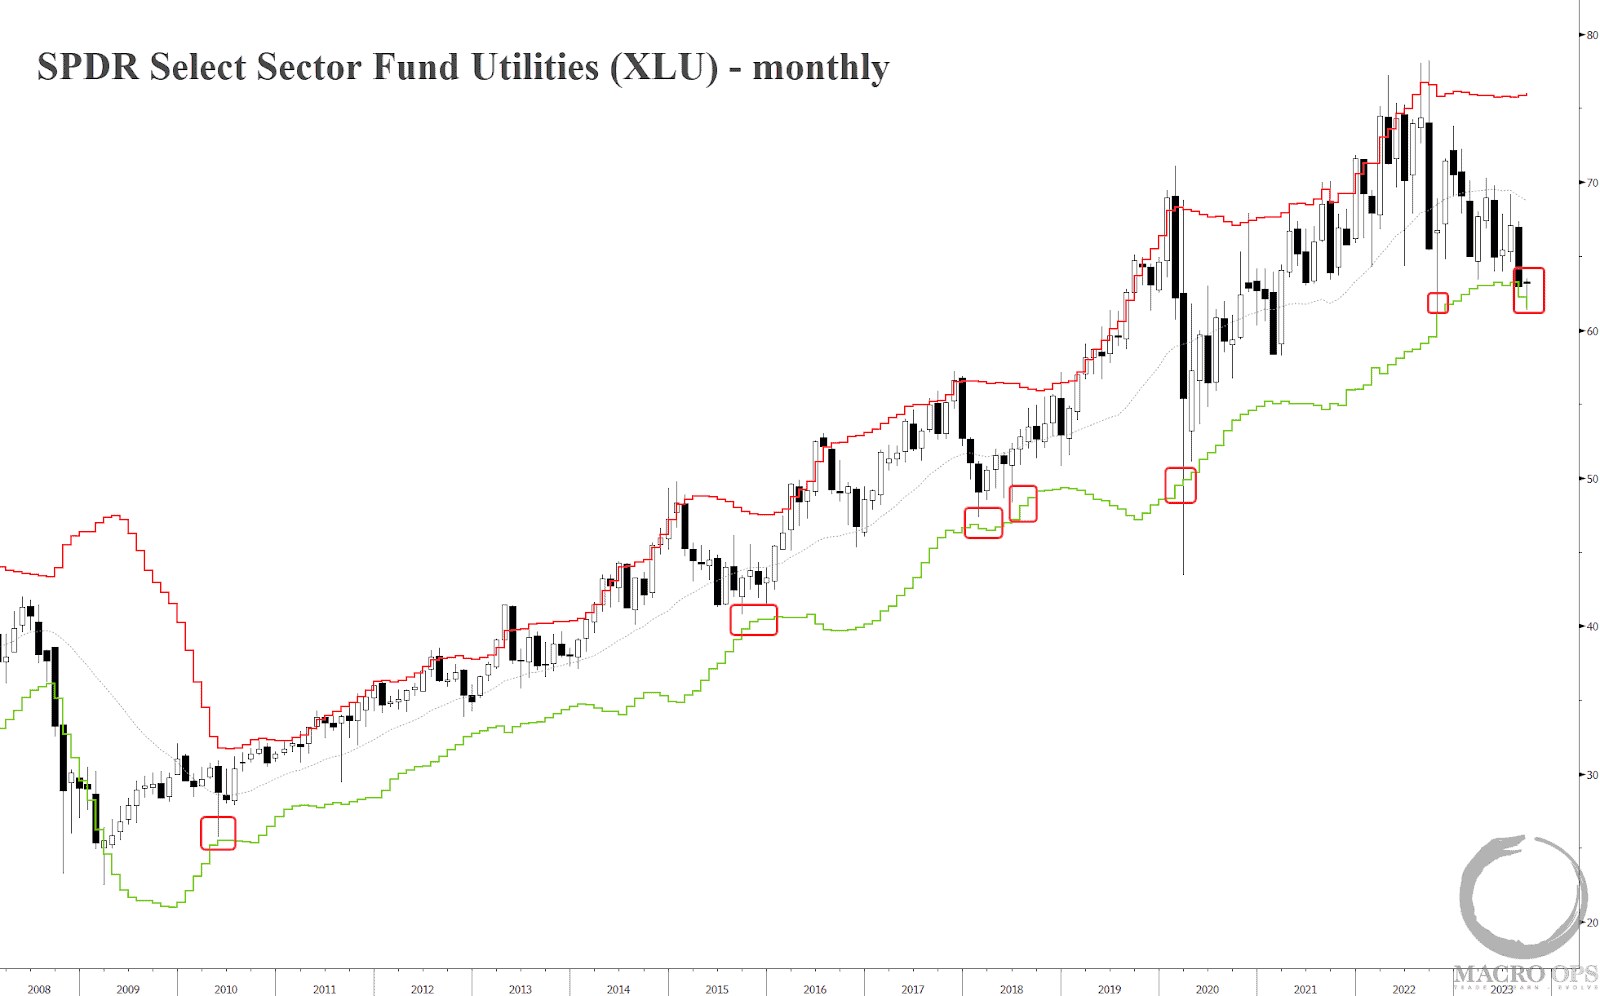
12. I’m not advocating buying XLU here, just pointing out something worth keeping an eye on. Utes are down at their monthly band. This band has acted as a reversal point every single time since this bull market started back in 2009.
Thanks for reading.