“At the end of the day, if you have more discipline and bigger balls, you are probably going to win, because other people do not.” ~ via Inside The House Of Money
Summary: SPX, QQQ, and RTY are currently operating within Bull Volatile regimes. Such volatility regimes often precede market tops, but their presence alone does not signal an imminent top. Instead, this environment suggests larger swings in both directions. The longer-term outlook for equities remains bullish through year-end, supported by robust breadth, favorable liquidity, constructive technicals, and positive positioning and sentiment. However, expect periodic pullbacks of 4–7% as part of the process. Although the labor market is gradually easing, recession risks remain overblown for now since job conditions are not yet recessionary. Key events this week include NFP revisions on Tuesday, PPI on Wednesday, CPI on Thursday, and the Michigan inflation expectations data Friday.
***The MO port is up +28.5% ytd, and we’re not seeing a shortage of great opportunities in this market. If you’d like to join me, the MO team, and our Collective of sharp, supportive investors and traders as we navigate these markets, then click the link below. I look forward to seeing you in the group.***
Join The Collective
1. Recession talk is resurfacing after last week’s weak jobs print (22k vs. 75k expected) and the unemployment rate ticking up to 4.3%, which was in line with forecasts.
I’ll publish a report this week outlining why labor market fears may be overstated. In short, net migration has turned negative for the first time in decades over the last six months. This development complicates the Fed’s view of labor dynamics, because the monthly job creation needed to keep unemployment steady is set to drop significantly—from 140,000–180,000 in 2024 to only 10,000–40,000 by the end of 2025. As such, the latest soft payroll prints should be understood in this context. That’s not to say the jobs market is booming, just that it might not be as weak as the recent data revisions would indicate
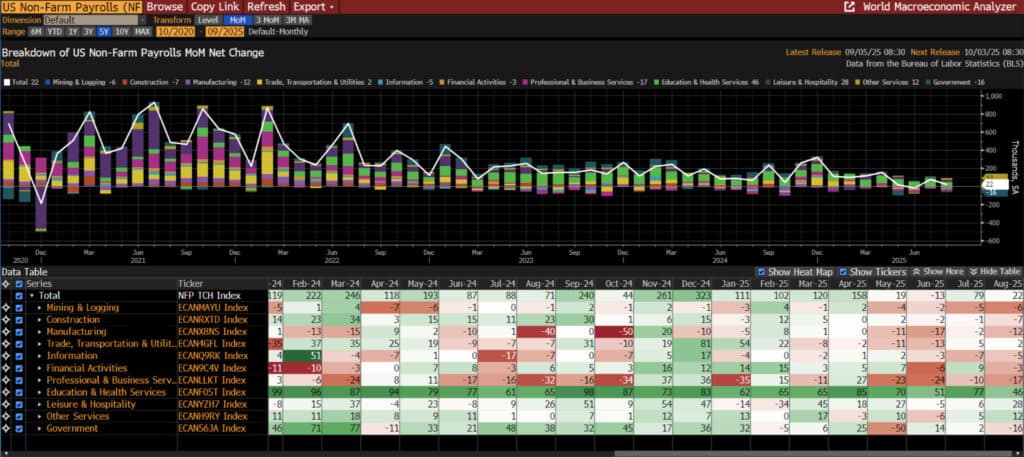
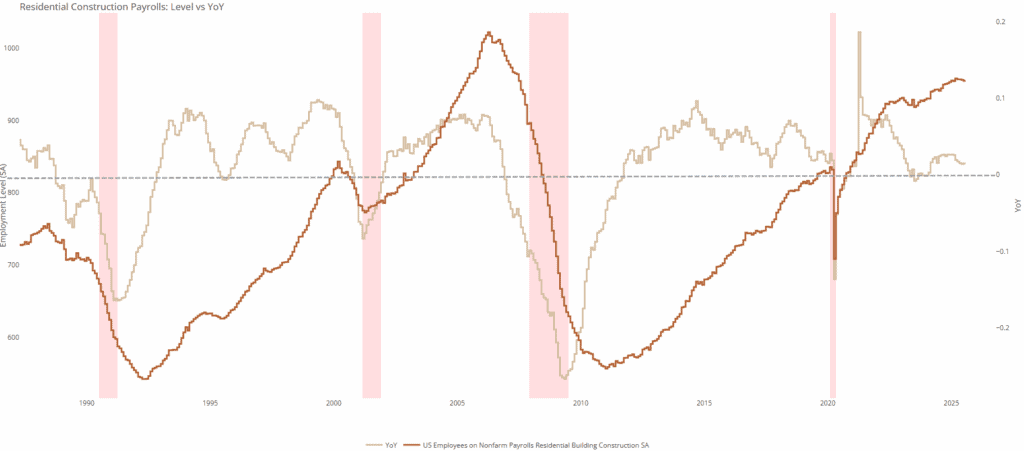
2. One of our preferred leading indicators is residential construction payrolls. Both the nominal and year-over-year figures remain positive, signaling no signs of a recessionary deterioration in the labor market. It’s worth emphasizing that residential construction is among the most cyclical and rate-sensitive sectors in the economy, making its resilience particularly noteworthy
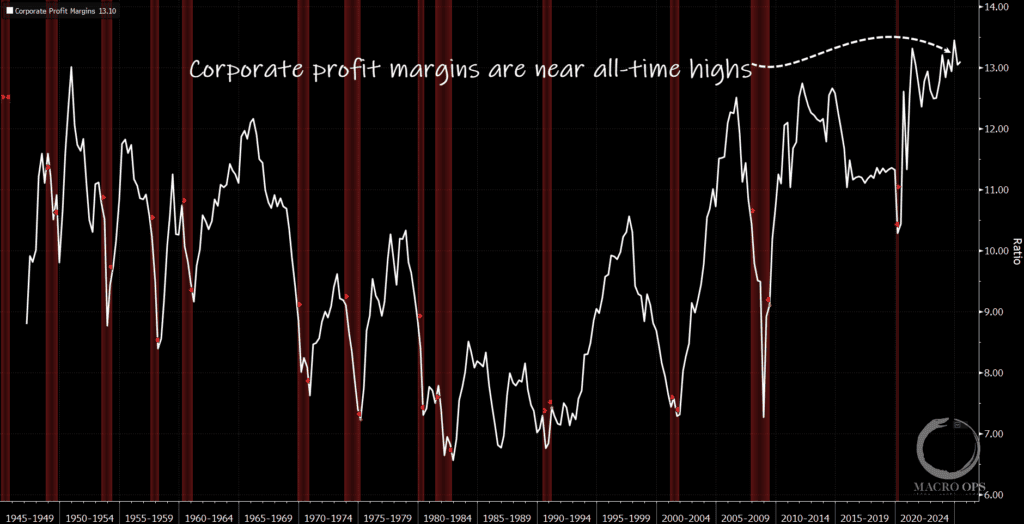
3. The truth is that while the labor market is indeed cooling, it is still nowhere near a recessionary collapse. The pace is slowing—lending support to the “no fire, no hire” theme. Record-high profit margins are enabling firms to hold onto employees and wait out the current uncertainty stemming from recent Trump trade policies and to see where Fed policy is headed.
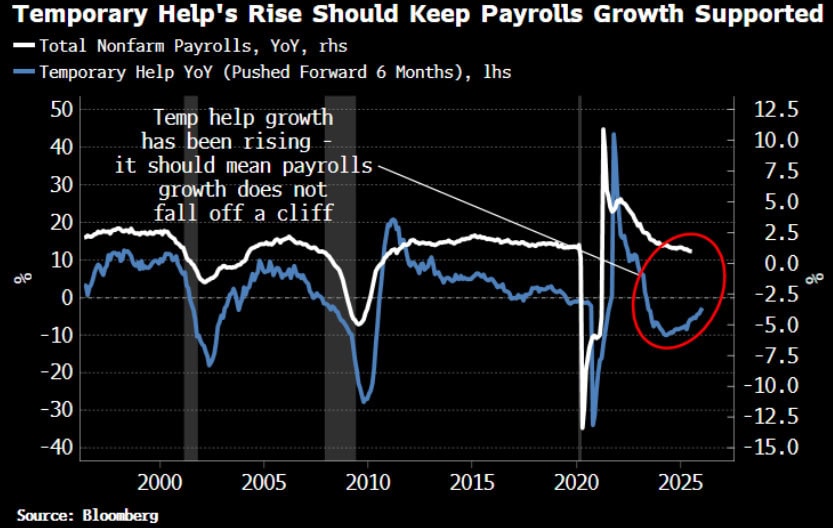
4. BBG’s Simon White shows that the contraction in YoY Temporary Help (a good lead on labor health) has bottomed out.
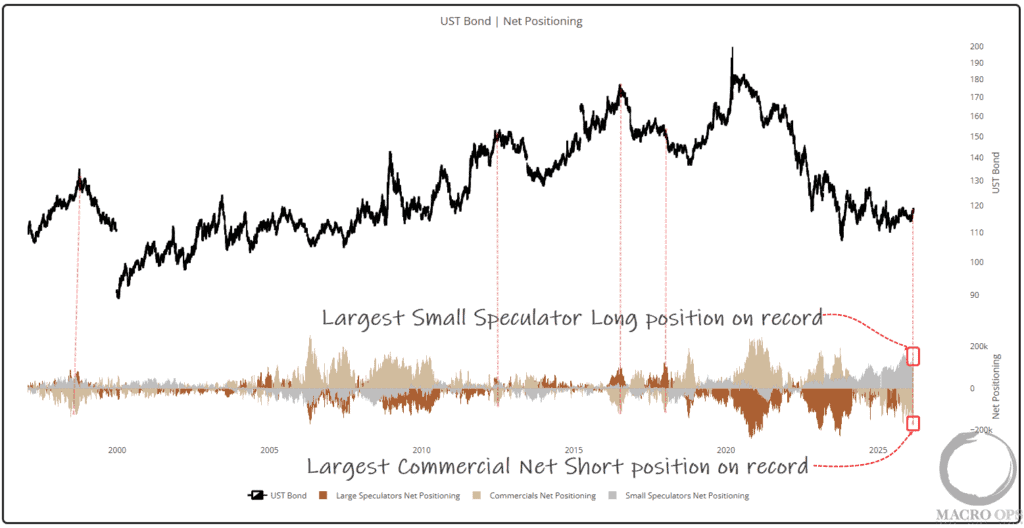
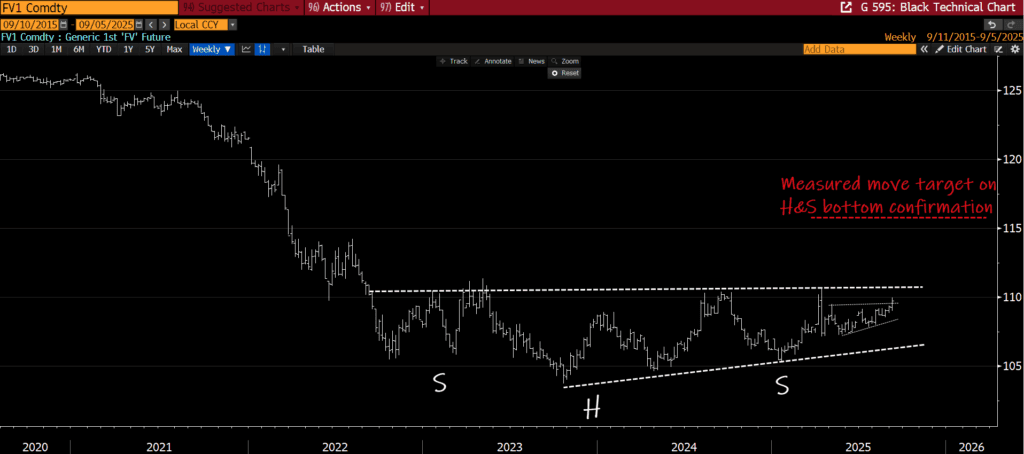
5. Here’s the setup in 5-year UST futures: prices have formed a large compression regime and an inverted head & shoulders base that has been building for nearly four years. Last week saw a breakout from a smaller compression within that range. This is a substantial technical pattern and suggests significant trend is coming. We’re currently long 2s and will look to add on further confirmation of the breakout
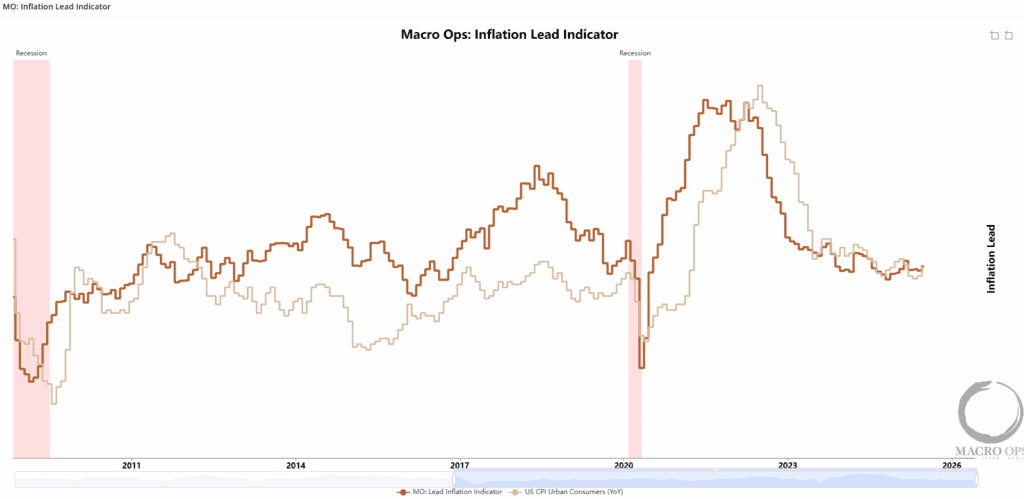
6. This trade, like the broader markets, will be primarily driven by this week’s CPI and PPI data as investors position ahead of the Fed meeting next week. Our Inflation Lead indicator signals that disinflationary pressures have stopped but does not yet point to a pronounced inflation surge on the horizon
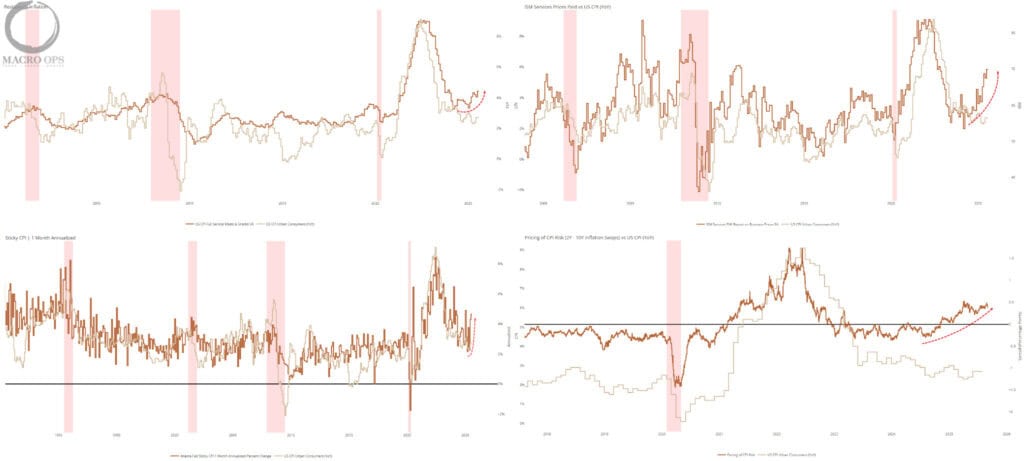
7. However, we’re seeing other inflation leads begin to diverge higher, such as Restaurant Inflation, ISM Prices Paid, Sticky CPI, and 2-10yr inflation swaps.
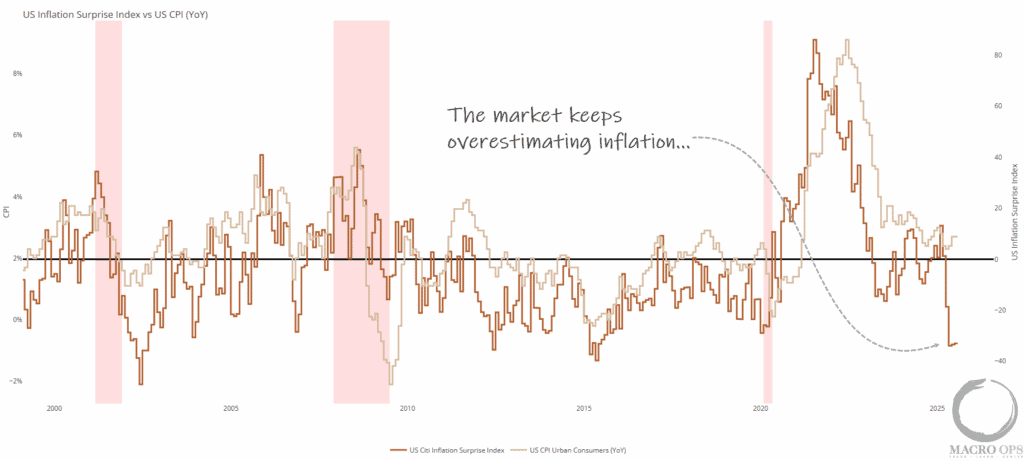
8. We should maintain an open mind regarding inflation, given the numerous factors in play. However, it is worth noting that inflation data has consistently come in below expectations throughout the past year
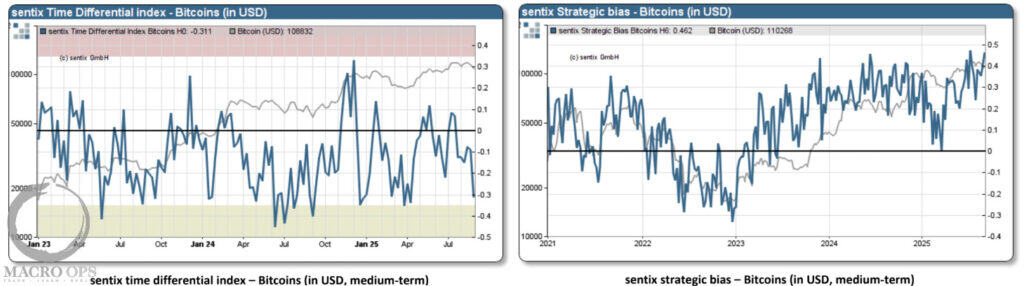
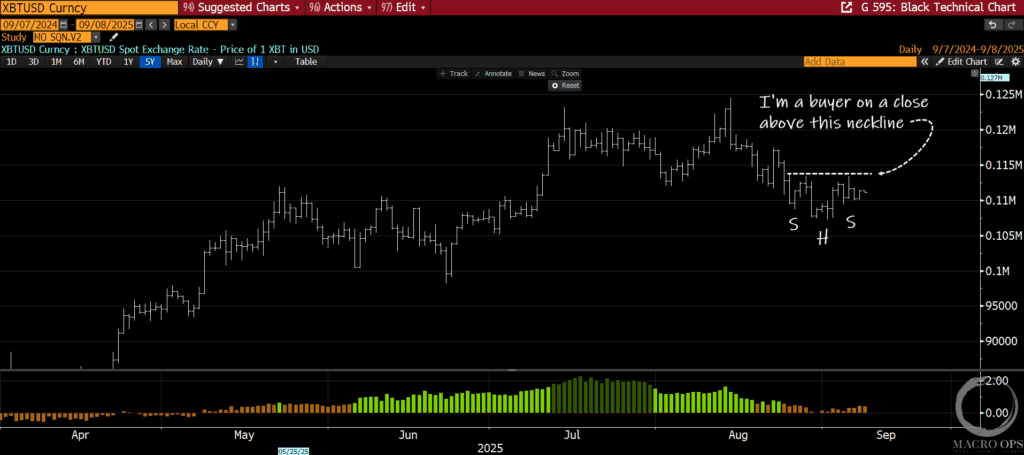
9. The Sentix data shows that sentiment is set for a renewed bullish advance in BTCUSD. Their Time Differential index has triggered a buy signal while Strategic Bias is strong and trending higher.
10. Here’s the daily BTC chart showing a possible inverted H&S bottom. I’d be looking to buy/add on a close above this neckline.
11. I have no clear view on the near-term market direction over the coming weeks. Price action will hinge on incoming inflation data and the Fed’s communications. My strategic bias remains bullish into year-end, and I’d look to add to SPX longs on a daily close above last Friday’s high.
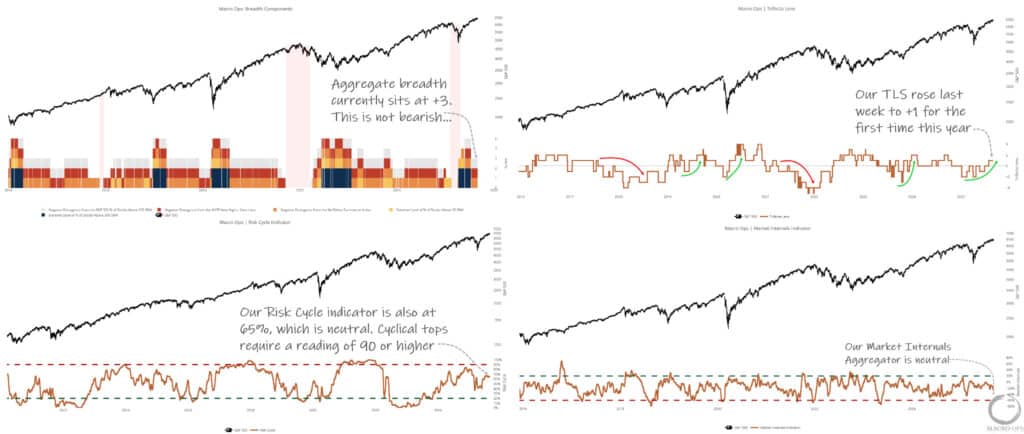
Breadth remains robust and supportive of a bullish trend. Our Risk Cycle Indicator sits firmly in neutral, reflecting subdued investor enthusiasm — a positive sign. Market internals continue to look constructive. Notably, our Trifecta Lens Score, which aggregates all key market signals, climbed to +1 last week for the first time this year.
While a breakdown and selloff remains a possibility, any weakness should be shallow and represent a buying opportunity
Join The Collective
Thanks for reading.