“Early in life, I had noticed that no event is ever correctly reported in a newspaper.” ~ George Orwell (h/t Jesse Stine)
Good morning!
In this week’s Dirty Dozen [CHART PACK] we take a look at the conflicting data of horrid breadth and new all-time highs and then dive into similar past instances to see what the forward returns looked like. We discuss the buyback outlook and low costs of capital, go through the latest earnings guidance and margin trends, and finally end with a long setup in crypto. Plus more…
Let’s dive in.
***click charts to enlarge***
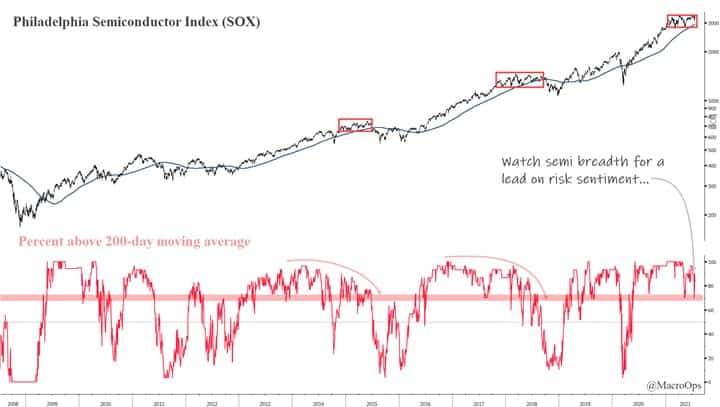
- The semiconductor index is nearing the top of its 7-month sideways trading range. Semis are typically a good lens on general risk sentiment and often provide a lead on the broader market.
This is why I’m watching not just its price but also its breadth. A continued deterioration in its breadth profile will tip us off that there’s more market volatility ahead. Conversely, if we see semis breakout to the upside here we’ll want to see breadth confirm.
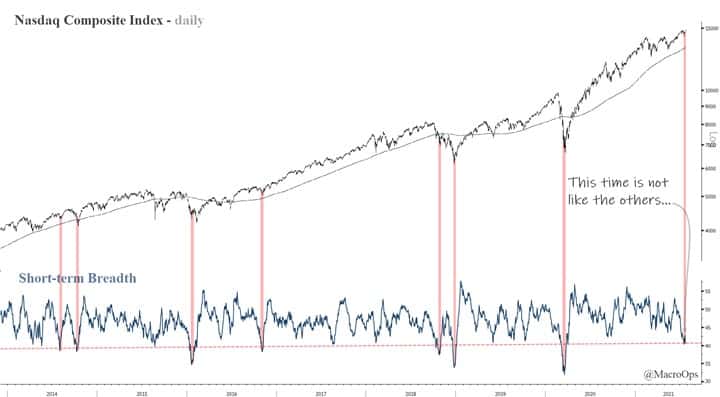
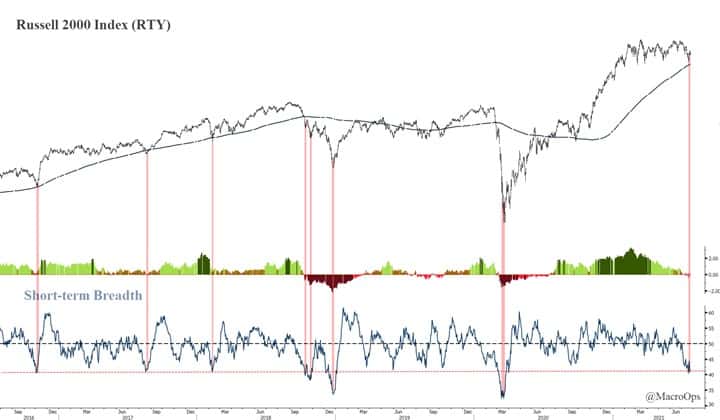
- Qs closed at all-time highs on Friday but breadth hasn’t followed the tape. It’s at levels that typically come after larger corrections, not all-time highs.
- We see a similar situation in small caps, where breadth is also incredibly weak and at levels that typically coincide with bottoms following larger corrections.
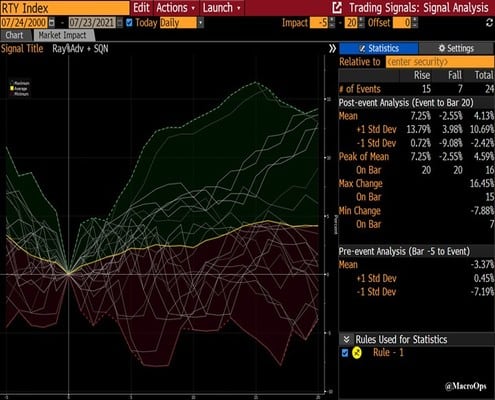
- I ran a backtest to look at past instances where breadth was this weak but the index was still above its 200-day moving average. Yellow dots below mark past occurrences.
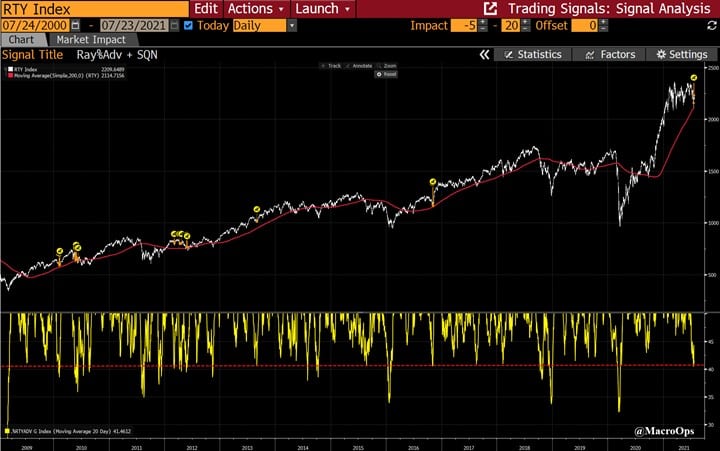
- Interestingly, this tends to be a positive signal. Out of 22 instances, 68% saw positive returns over the following 20 trading days with an average return of 7.25%.

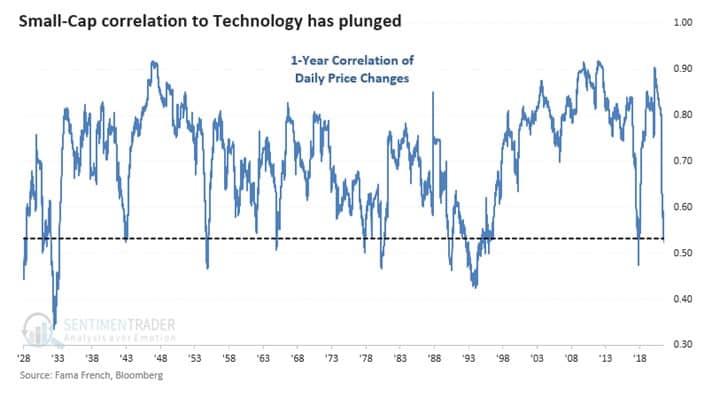
- SentimenTrader recently shared this chart showing the correlation between small-caps and technology has plunged to levels only seen one other time over the past twenty years.
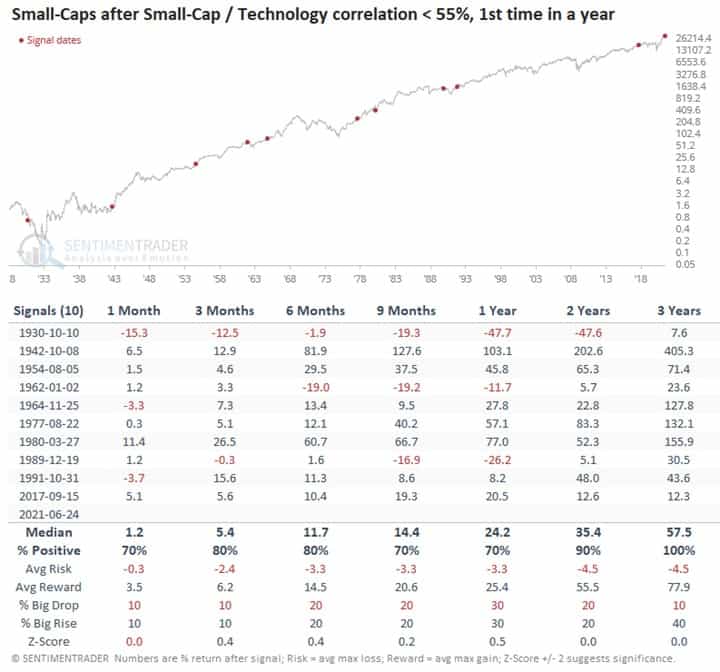
- Their backtest shows that this also tends to be on average a bullish signal. 70% of past occurrences over the last 90-years saw positive returns over the following month, and 80% over the next 2 and 3 months.
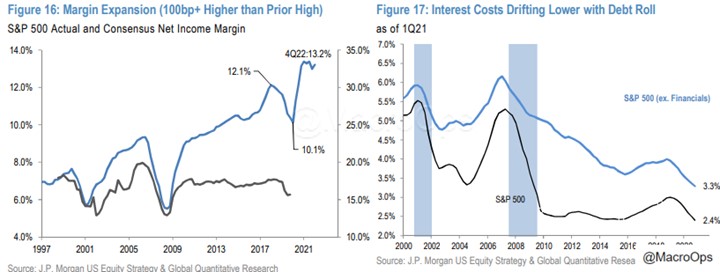
- We’re still clearly in an early to mid-cycle market. And there are plenty of strong tailwinds to keep driving things higher over the next couple of years. Buybacks being one of them. These charts from JPM show that our Most Important Fundamental is alive and well… (charts via JPM)

- In addition, planned CAPEX is at its highest level in decades — CAPEX is a critical component of earnings growth as per the Levy-Kalecki equation. This is supported by an easy Fed policy which is keeping interests costs low for US corporates (charts via JPM).

- This graph from GS shows sector valuation relative to the market and its past.

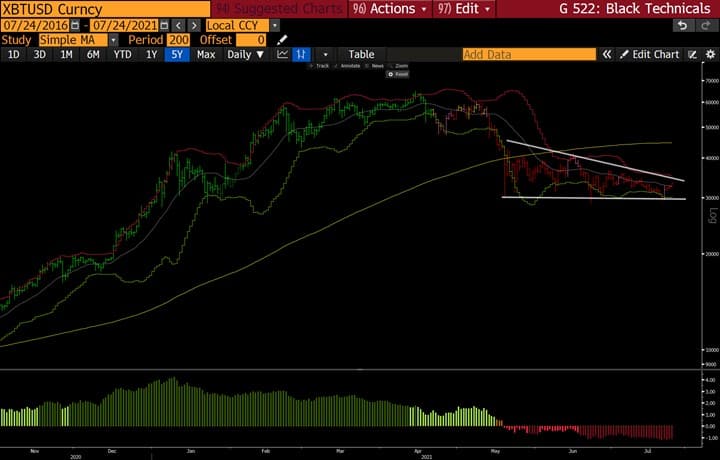
- 11. It looks to me like Bitcoin, and likely crypto in general has put in a tradeable bottom. BTCUSD has had every chance to break down but hasn’t. Its 30k significant level has held. I started buying a small position this past week.
Like all things trading-related, this is a weakly held opinion. I’d gladly change my mind should the price reverse and break lower here.
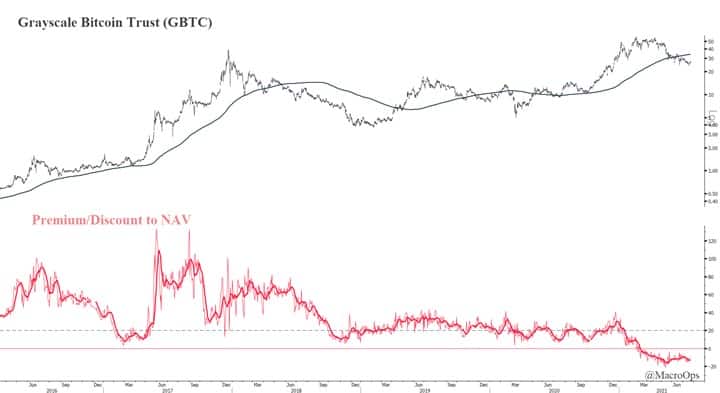
- If you don’t have access to a crypto exchange, GBTC continues to trade at an incredibly steep discount to NAV.
Thanks for reading.
Stay safe out there and keep your head on a swivel.