“Every limitation has its value, but a limitation that requires persistent effort entails a cost of too much energy. When, however, the limitation is a natural one (as, for example, the limitation by which water flows only downhill), it necessarily leads to success, for then it means a saving of energy. The energy that otherwise would be consumed in a vain struggle with the object is applied wholly to the benefit of the matter in hand, and success is assured.” ~ THE I CHING, CHINA, CIRCA EIGHTH CENTURY B.C.
Good morning!
In this week’s Dirty Dozen [CHART PACK] we go through the latest Global Fund Manager Survey and see where all the crowded trades are… We then discuss the evidence for an extended breather in the popular reflation trade. And end with a look at a bearish setup in oil and a long in the dollar, plus more…
Let’s dive in.
***click charts to enlarge***
- The latest BofAML Global Fund Manager Survey is out. Here are the highlights.
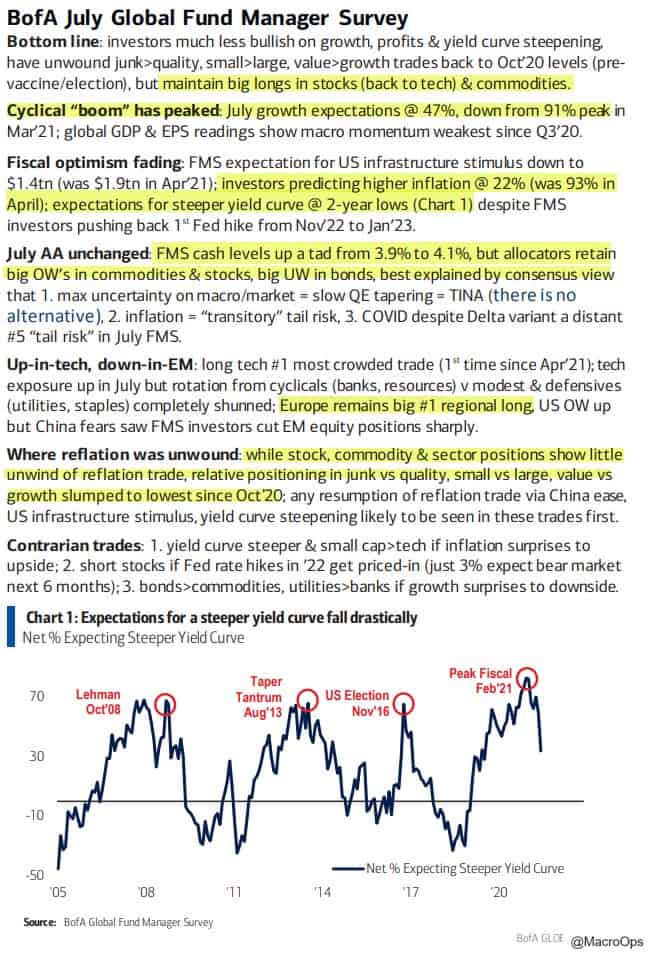
- And the charts of the month…

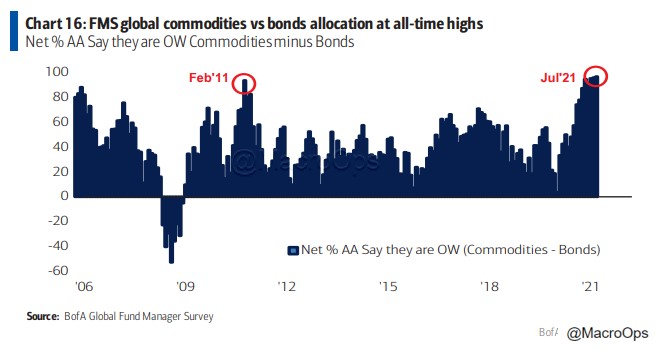
- Here’s my personal favorite. Global commodities vs bond allocation are at all-time highs. Just above the previous highs made on February 11’. Let’s discuss why this is important.
- The next few charts are from @MrBlonde_macro who’s become one of my favorite new follows on the twitters.
This one shows that the year-over-year gains in industrial commodities are likely nearing their limits.
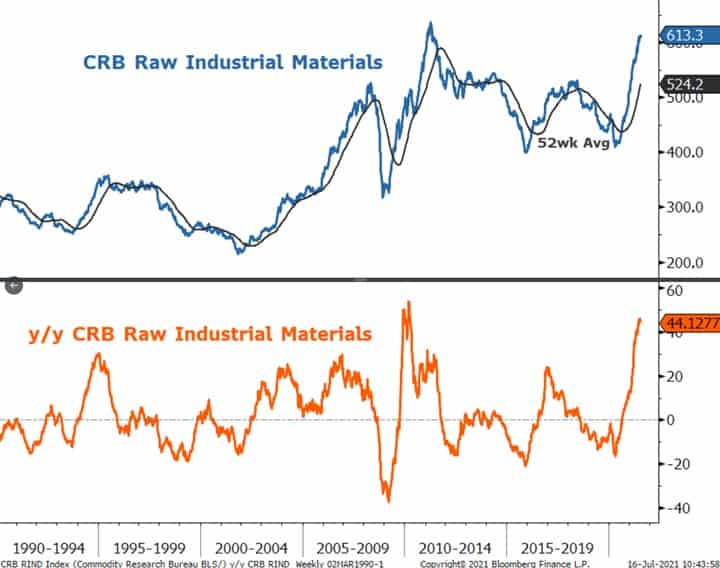
- This stretched trend and crowded positioning in commodities and reflationary assets are running into the realities of peak growth, — not to mention the growing concerns around the Delta variant.
This chart from @MrBlonde_macro shows the cumulative returns of Cyclicals vs Defensive in various growth regimes, using the ISM as proxy. Currently, the ISM is above 50 and falling which puts us in the second worse regime for cyclicals on a relative basis (shown by the grey line below).
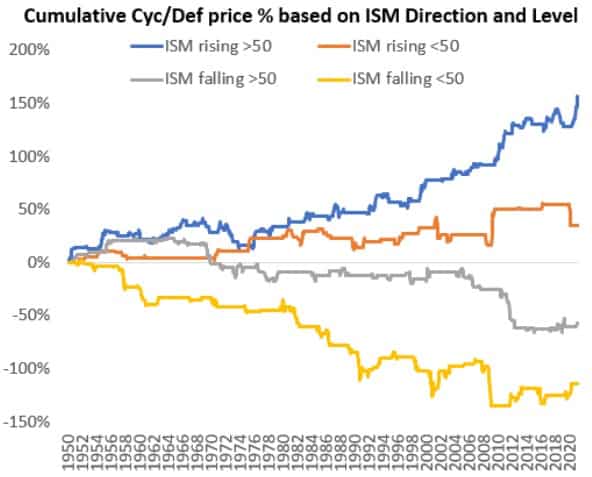
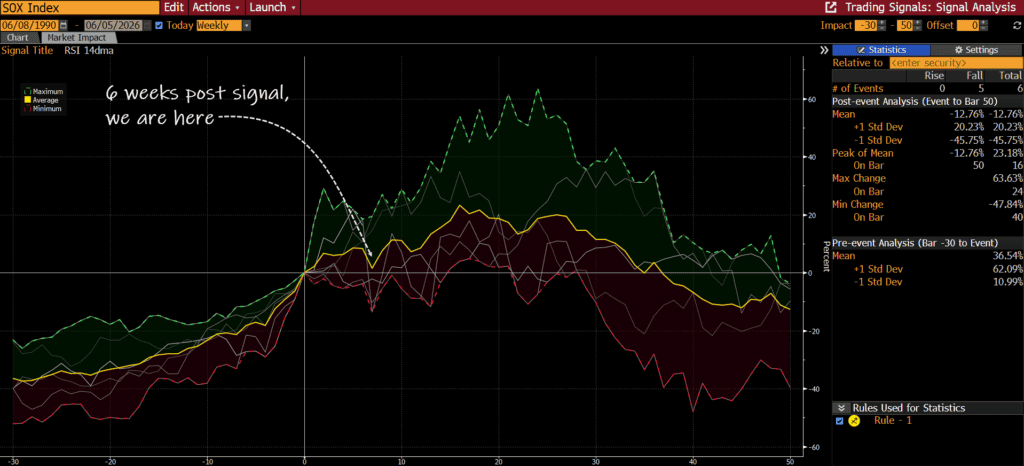
- And reversion should be expected following such a large positive deviation. Again, chart via @MrBlonde_macro.

- If markets are signaling the start of broader risk-off (which we think they are). Then crude should follow XOP back towards its averages (chart via @MrBlonde_macro)
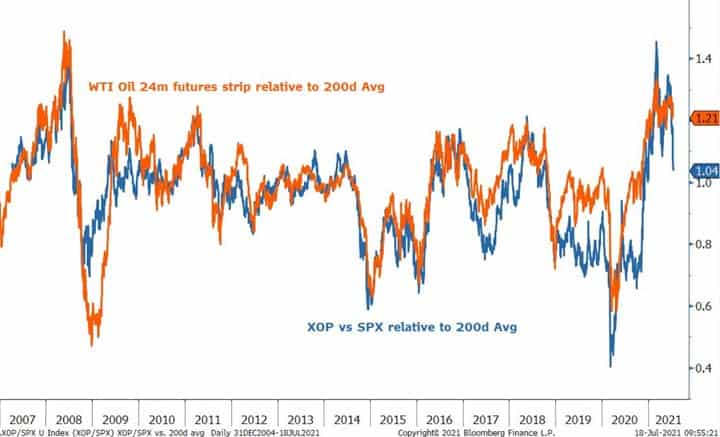
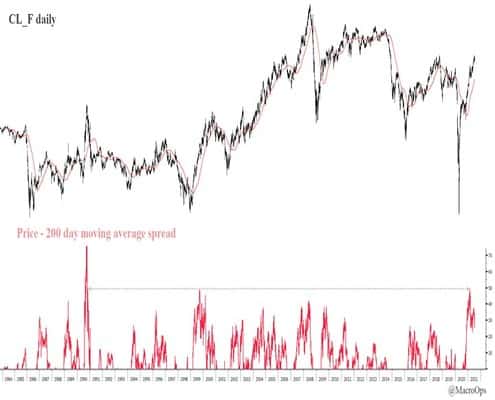
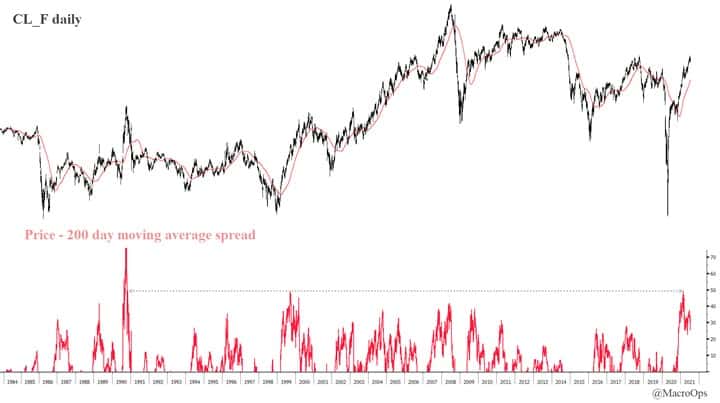
- Seeing as how crude’s deviation from its 200-day moving average is the widest it’s been in 30+ years, we should expect some catching down ahead…
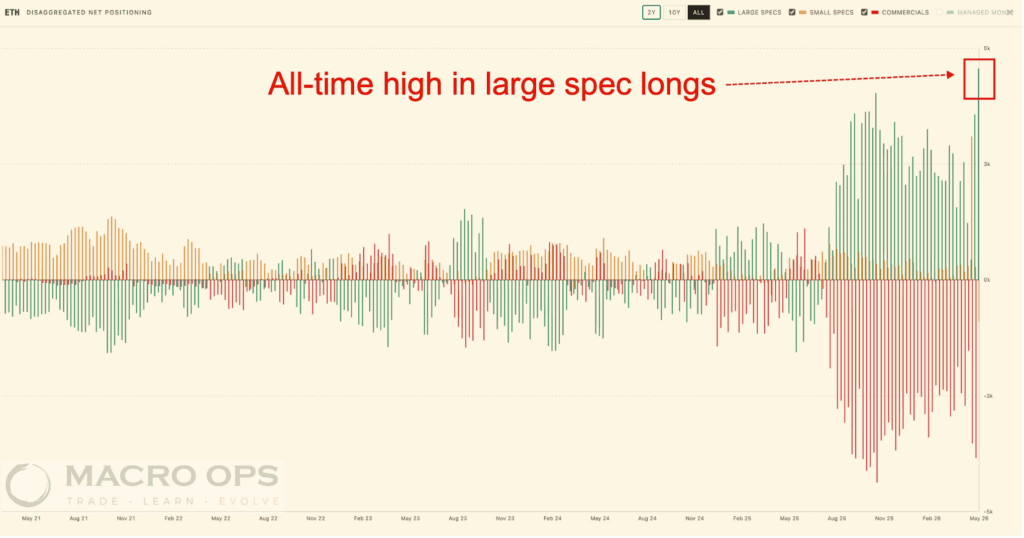
- There’s plenty of kindle for this bearish reversal too. Small spec net longs are coming off their 98th percentile.
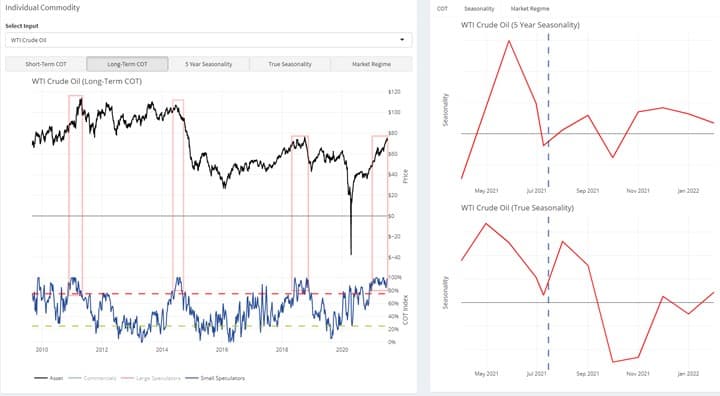
- And its Time Spread is diverging lower…

- Plus… if we see continued risk-off here and some length gets taken out of the crowded reflation trade, then the bullish action in the USD should pick up steam. Citi’s FX Pain Index shows the pain trade is clearly up for the dollar…

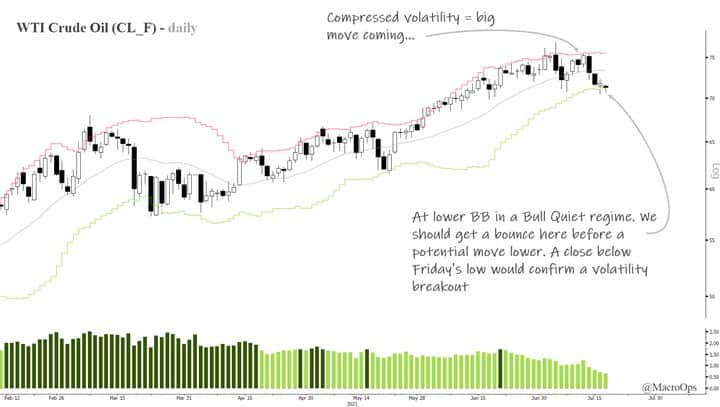
- Looking at the nearest month’s futures contract on crude, we can see that it’s at its lower Bollinger Band. Odds are we get a bounce here before we see a break to the downside. However, if we get a daily close below Friday’s low then the odds flip in favor of bearish follow-through. Oil is coming out of a fairly coiled range which means there’s decent gas for a swift move.
If you enjoy reading these Dirty Dozens each week then please feel free to share them on the Twitters, forward them to a friend, or translate them via smoke signal, etc… Every bit helps us get our name out there.
Thanks for reading.
Stay safe out there and keep your head on a swivel.