The following is an excerpt from our Macro Intelligence Report (MIR). If you’d like to learn more about the MIR, click here.
Over the next 12-18 months we expect the US market to outperform the rest of the world as we head into the final stages of this economic expansion.
Once a quarter we like to review our US macro indicators to see if they confirm or reject our primary macro thesis. Here are the latest readings.
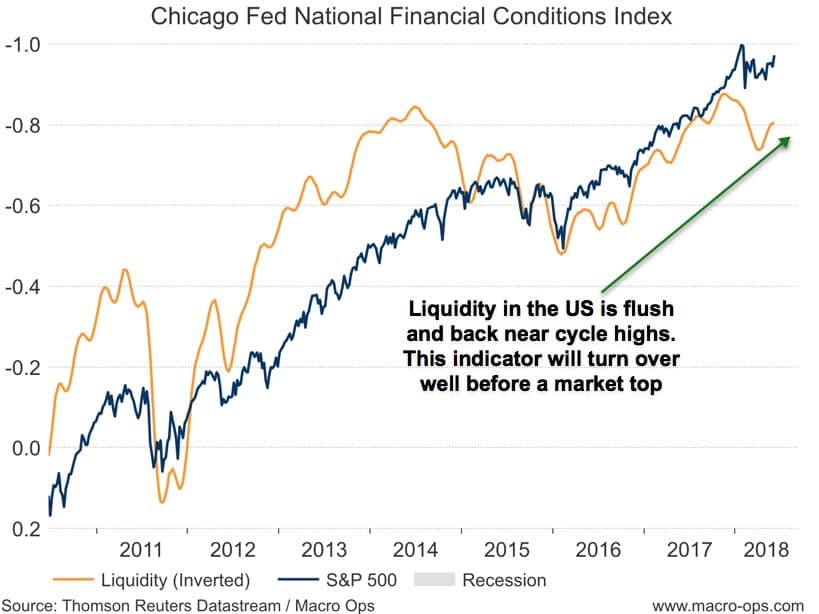
Liquidity: US liquidity is near its cycle highs (meaning, it’s extremely loose). This is very bullish US risk assets and should prevent emerging markets from going into full-blown crisis mode. This indicator will turn over well before this bull market ends.
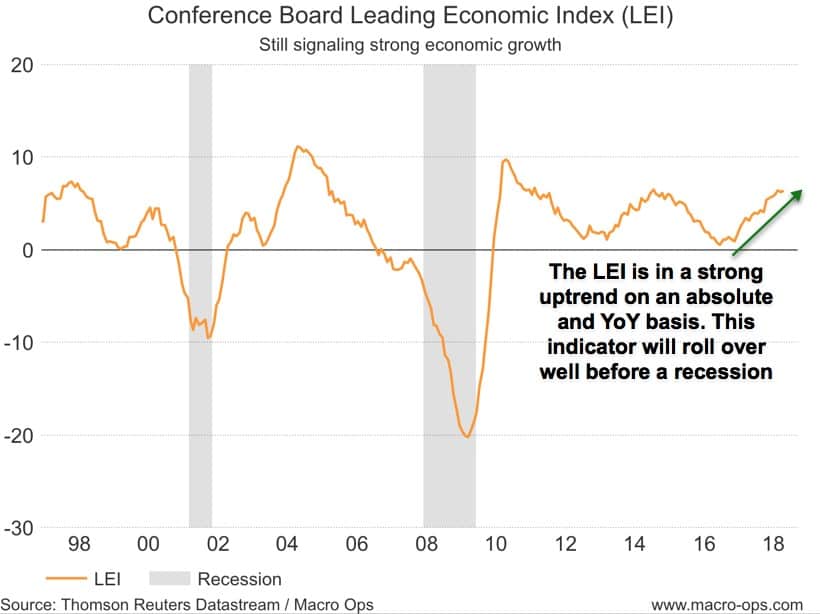
LEI (Leading Economic Index): The Conference Board LEI, which tracks a basket of US economic indicators, is still in a strong uptrend on both an absolute and YoY basis. This indicator will roll over well before we enter a recession.
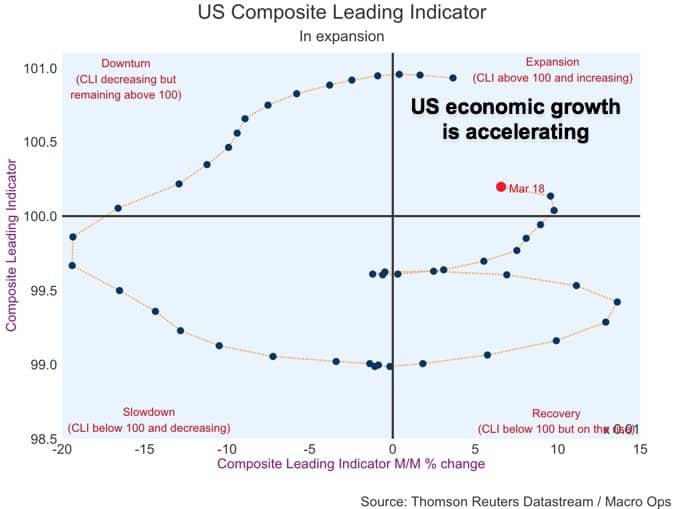
CLI (Composite Leading Indicator): Our US composite leading indicator shows the US economy is in an accelerating expansion which should continue into the end of the year.
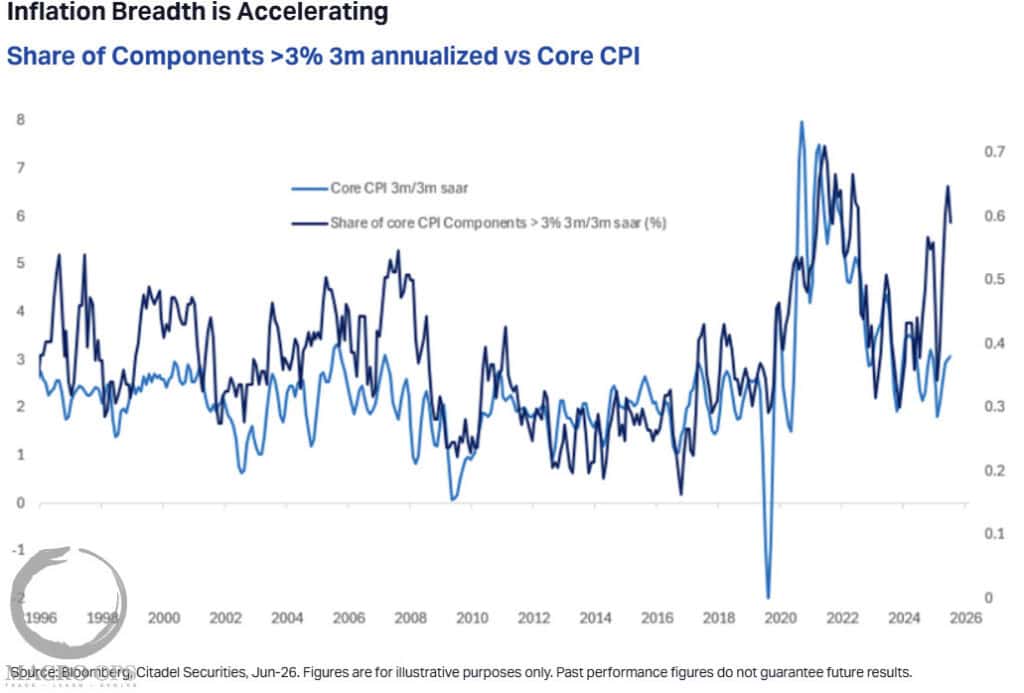
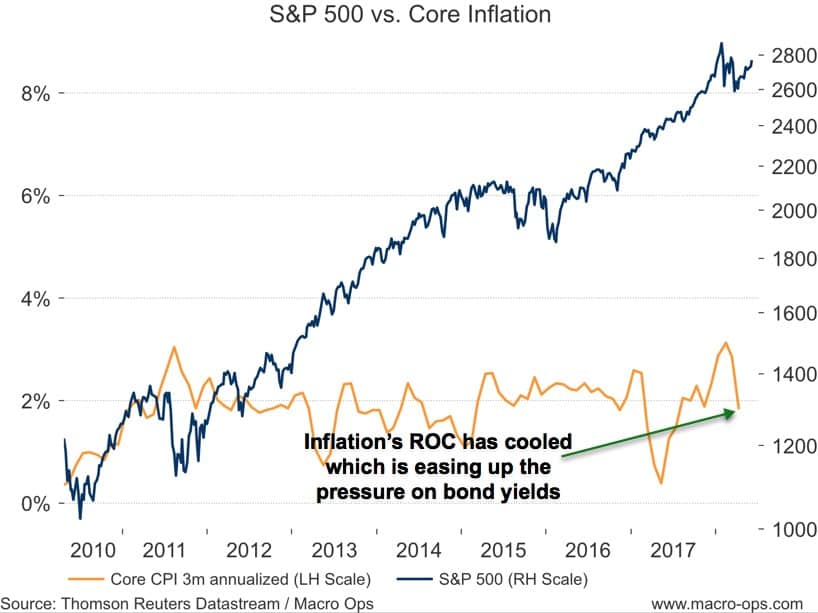
Inflation ROC: The 3-month annualized core inflation rate has come down from its Jan/Feb highs, which sent interest rates shooting up. A slower change in inflation eases up pressure on yields and is bullish for stocks.
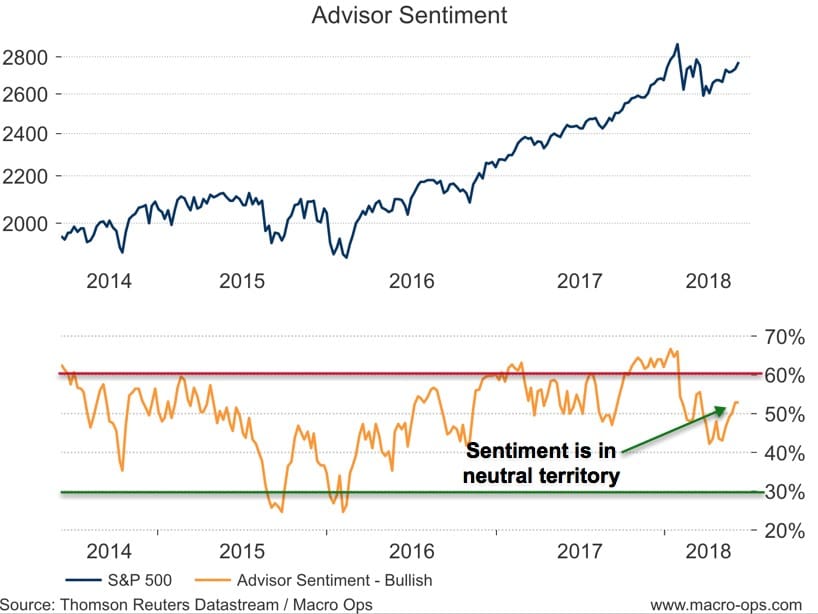
Advisor Sentiment: Advisor sentiment has reset from its excessively bullish Jan/Feb highs and is now giving a neutral reading. This is supportive of stocks moving higher.
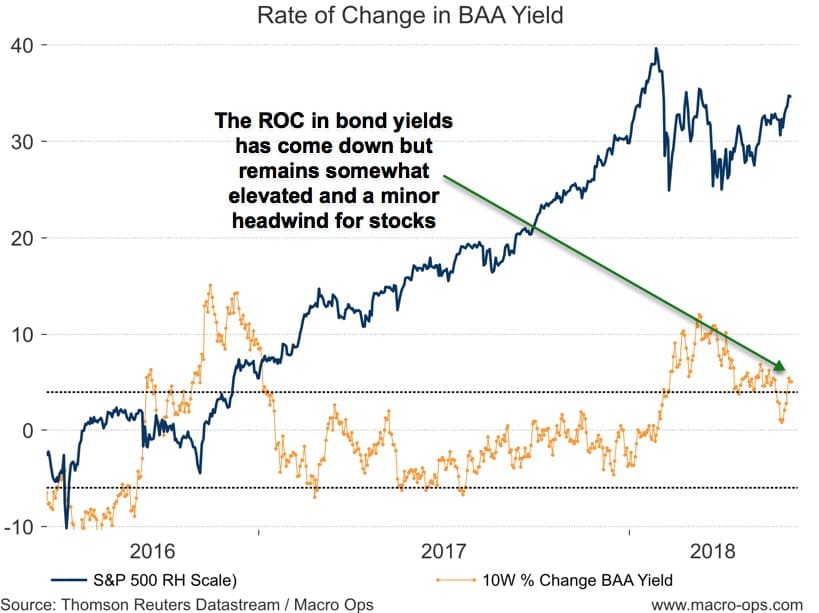
BAA Yield ROC: The rate of change in yields has come down from its highs at the start of the year but it still remains elevated. This indicator is in neutral/headwind territory for stocks.
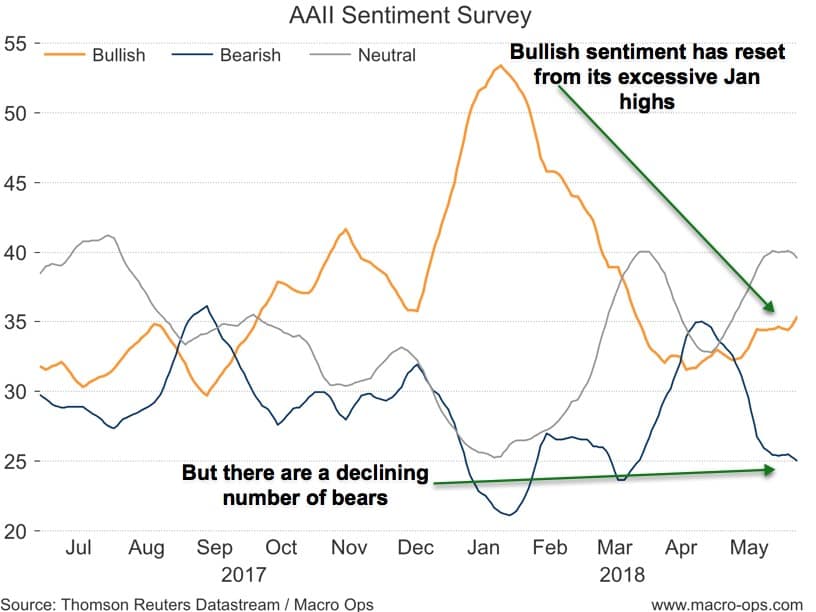
AAII Sentiment Survey: Bullish sentiment has completely reset since the beginning of the year and is now supportive of stocks moving higher.
S&P 50-day MA Spread: The percentage of SPX stocks above their 50-day moving averages is in overbought territory. It can and probably will move higher from here but we should be on the lookout for a pullback in the next few weeks as the short-term trend is becoming extended (chart via Bespoke).

Summary: The US economy is strong and growth is accelerating. All our leading economic indicators are giving positive readings making the odds of a recession in the next 12-months extremely low. Liquidity is still flush which is supportive of the broader trend higher in stocks. Market sentiment has reset from its highs reached at the start of the year. All this means that the primary bullish trend in US stocks is supported by the data and the primary path of least resistance remains up.
However, over the short-term, the trend is overbought and the ROC in yields is elevated. This makes the market more susceptible to a selloff over the next few weeks. A selloff would reset both of these and give us a good opportunity to add risk. There are numerous catalysts that could spark a selloff this week ahead. We have CPI and DPRK Summit on the 12th, the FOMC meeting on the 13th, and June OpX on the 15th.
The above was an excerpt from our Macro Intelligence Report (MIR). If you’d like to learn more about the MIR, click here.