Updated: April 8, 2020
In light of the many disparate and conflicting opinions out there, especially on the Twitters… I thought I’d put together a comprehensive coronavirus cheat sheet with the key numbers, best resources, and info that I’ll update regularly.
What it is: The virus is a respiratory disease caused by a novel (new) coronavirus which was first detected in China and has now spread to more than 209 countries. The virus has been named “SARS-CoV-2” and the disease it causes is “coronavirus disease 2019” or “COVID-19” for short.
Resources:
- Johns Hopkins CSSE
- Worldometers / Coronavirus
- CDC Coronavirus
- The Virus Watch
- Health Weather
- MUST-READ “CORONAVIRUS: Why You Must Act Now”
- Retail Impact Tracker
- Google Covid-19 Mobility Reports
- Healthdata
- Superforecasting Tournaments:
- Good Judgement COVID-19 Dashboard
- Global death toll of COVID-19 before 2021 – median forecast: 2.42m
- Total confirmed COVID-19 cases in US by April 27th – median forecast: 1.3m
- Total global COVID-19 infections by 2021 – median forecast: 496m
- Twitter Follows:
- @mlipsitch – Infectious disease epidemiologist, Harvard
- @sciencecohen – Science reporter focused on infectious disease / public health
- @ScottGottliebMD – Former FDA commissioner and resident fellow at AEI
Key Numbers: These are the key metrics I’m tracking to discern the virus’s ultimate impact.
Active Cases: This is the number of active coronavirus cases that are currently being treated globally. Why is this number important? Unlike the Total Cases number, which is what’s mostly being reported in the news, active cases leave out those who’ve died or have been successfully treated for the disease as they are no longer contagious.
Total active cases globally are currently 1,448,123 infected patients and climbing rapidly. This number should be expected to increase significantly in the coming weeks given the low levels of testing still available in the US and other parts of the world.

This graph shows the arc of confirmed cases as well as the doubling period for each country. Total cases are currently doubling in the US every 2.5 days.
R0 (pronounced R-nought): Is the “attack rate or transmissibility (how rapidly the disease spreads) of a virus is indicated by its reproductive number, which represents the average number of people to which a single infected person will transmit the virus (worldometers).” For example, an R0 of 3 means that on average an infected person will infect 3 other people. As a rule of thumb, epidemiologist believe that any novel disease with an R0 believed to be over 1 should be taken seriously.
Current estimates put the coronavirus’s R0 somewhere between 2 and 2.5 though some early estimates put it as high as 3.8, which would be catastrophic. For comparison, the R0 for the common flu is 1.3 and the R0 for the 1918 Spanish Flu epidemic was thought to be around 1.8-2.0.
Influenza viruses are genetically variable, and transmissibility difficult to predict especially early on in an epidemic. The RO value can change significantly over time and vary greatly across geographical locations.
Fatality Rate: The Case fatality rate refers to the “proportion of people who die from a specified disease among all individuals diagnosed with the disease over a certain period of time. The case fatality rate typically is used as a measure of disease severity and is often used for prognosis (predicting disease course or outcome), where comparatively high rates are indicative of relatively poor outcomes (Encylopedia Britannica).”
Estimates of the coronaviruses case fatality rate have so far varied widely, from a low of 0.5% to as high as 8%. Today the World Health Organization announced that the virus’s fatality rate is 3.4% but this rate is likely a huge overestimation due to “severity skew” in the reporting. The credible consensus is that the rate will move lower as testing becomes more broad-based and cases of milder under-reported symptoms are factored in. The fatality ratio also differs greatly across age groups and initial health, with the ratio being much higher amongst the older population and those with a compromised immune system.
Ben Thompson, of Stratechery, made an important observation about the virus, writing: “It seems likely the fatality rate is lower than what was reported in China. Consider the failed quarantine of the Diamond Princess cruise ship, which allowed for a controlled sample. According to the latest numbers from Japan, of the 3,711 passengers and crew members on board, 705 were infected; of the 705 infected, 392 were asymptomatic; six have died. That is an infection rate of 19.0% (10.6% with symptoms), a fatality rate of 0.8%, and a mortality rate of 0.2% (fatality rate is what percentage of the people who are infected die; the mortality rate is what percentage of the overall population die)… This is mirrored in South Korea, which is experiencing the largest outbreak outside of China — at least the largest outbreak that we know about. This is an important caveat both because some countries may be worse (particularly Iran), but also because the South Korean numbers, thanks to the country’s excellent infrastructure, health care, and free press, are likely to be amongst the most reliable in the world. There the fatality rate is 0.4%, even lower than the Diamond Princess.”
Thomas Pueyo’s analysis of the most recent data suggests that the Fatality Rate will vary from 0.5% (South Korea) to 0.9% (China exl. Hubei) for countries that are prepared. For countries that are not prepared (ie, have limited medical capacity/supplies, are slow to act etc…) will have a fatality rate between 3% and 5%. For comparison, the fatality rate for seasonal flu is less than 0.1% in the US.

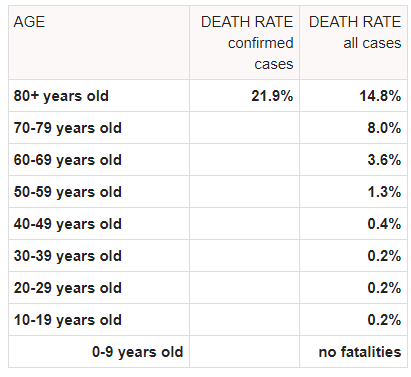
The fatality rate varies greatly by age (source).
You can use this interactive graph from NYT to see how many fatalities we should expect in the US with various infection and fatality rates and how those compare with other major killers.
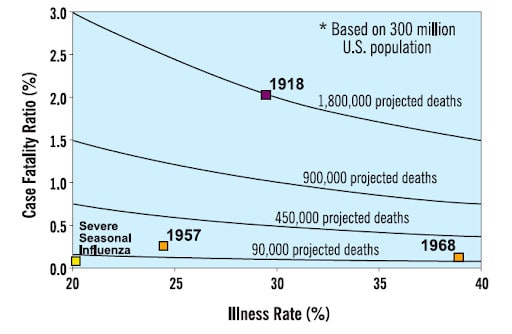
Here’s a chart showing the projected deaths per 300 million US population with various case fatality rates and R0s (chart via CDC).
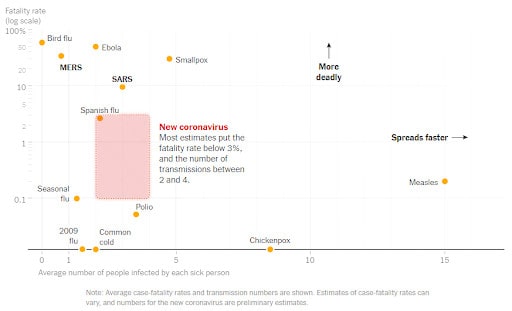
And historical comparisons via the NYT.
Risks: A critical risk here is that the US healthcare system is already taxed during flu season and an additional widespread virus could create a “double flu pandemic”.
We have roughly 800k staffed hospital beds in the country. This finite capacity already becomes maxed out during a bad flu season. If the coronavirus spreads quickly in the US while the flu season is still in full swing then it’ll likely result in severe flu cases not receiving ideal treatment and a tick up in the fatality rate.
This same idea holds for medical supplies, the NYTimes points out that “Public health experts are also closely watching reserves of vital medical supplies and medications, many of which are made in China. Some hospitals in the United States are already “critically low” on respirator masks, according to Premier Inc., which secures medical supplies and equipment on behalf of hospitals and health systems. And China is the dominant supplier of the raw ingredients needed for penicillin, ibuprofen and even aspirin — drugs taken daily by millions of Americans and dispensed routinely to hospital patients.”
For those of you in our Collective, I highly recommend reading the threads by @Jdavidr who’s an MD with decades of experience in this area, talk about the potentially massive stresses that this virus represents to our healthcare system and how we can best prepare.
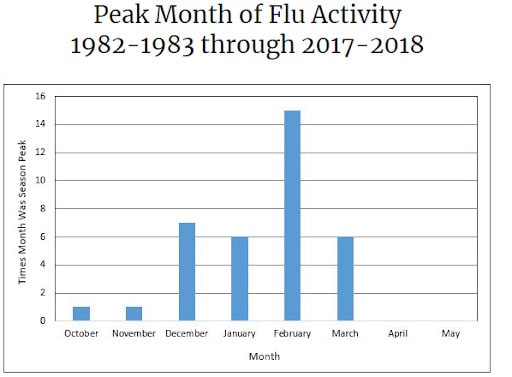
The positive news is that March is the last month of peak flu activity.
Additional Color:
- Vaccine: Credible estimates put a vaccine for the coronavirus 18-months out at the earliest.
- Warm weather: Scientist suggests it’s too soon to know how the virus will behave in warmer climates.
- But “Viruses that cause influenza or milder coronavirus colds do tend to subside in warmer months because these types of viruses have what scientists refer to as ‘seasonality’”. This is due to a number of suspected reasons, such as:
- “Studies outside the lab show similar results, though some tropical regions have more cases of flu during rainy season, when people also cluster indoors.”
- “Scientists hypothesize that low humidity, which often occurs in winter, might impair the function of the mucus in your nose, which your body uses to trap and expel foreign bodies like viruses or bacteria. Cold, dry air can make that normally gooey mucus drier and less efficient at trapping a virus.”
- Ian Lipkin, director of the Columbia University’s Center for Infection and Immunity, has been studying the novel coronavirus. He says sunlight, which is less abundant in winter, can also help break down viruses that have been transmitted to surfaces. “UV light breaks down nucleic acid. It almost sterilizes [surfaces]. If you’re outside, it’s generally cleaner than inside simply because of that UV light,” he says. Via NationalGeographic.
- But “Viruses that cause influenza or milder coronavirus colds do tend to subside in warmer months because these types of viruses have what scientists refer to as ‘seasonality’”. This is due to a number of suspected reasons, such as:
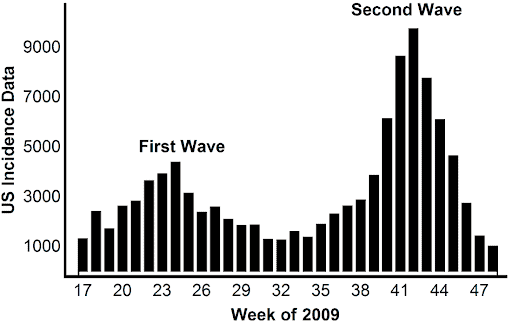
- Second Wave: Many epidemics have more than one peak. This is because following the initial outbreak, authorities work hard to restrict movement and limit the spread of the virus. Eventually, they relax these restrictions as people need to work to keep the economy from going into a tailspin. A second wave typically follows. Pay close attention to China where authorities have started to put greater emphasis on restarting the economy versus containing the virus.
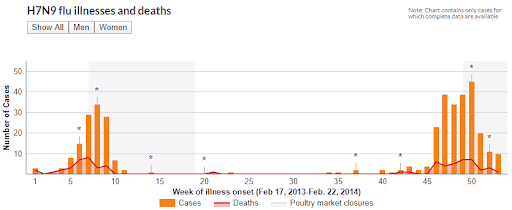
H7N9 Bird Flu illnesses and deaths from Feb 2013 to Feb 2014 (link here).
H1NI positive tests reported to the CDC in the US from April 2009 to Nov 2009 (link here).
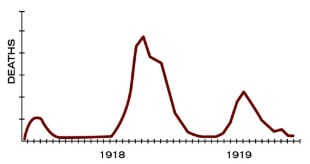
Spanish Flu: “There were 3 different waves of illness during the pandemic, starting in March 1918 and subsiding by summer of 1919. The pandemic peaked in the U.S. during the second wave, in the fall of 1918. This highly fatal second wave was responsible for most of the U.S. deaths attributed to the pandemic.”