If you consider our position as human beings trying to understand the world in which we live, you will find that we cannot confine our thinking to subjects that are independent of our thinking. We must make decisions about our lives and in order to do so we must hold views that do not qualify as knowledge, whether we recognize this or not. We must have recourse to beliefs. That is the human condition. ~ George Soros
In this week’s Dirty Dozen [CHART PACK] we look at improving liquidity, bears crowded in the Dow, rebounding international growth contrasting with contracting US growth, copper in consolidation, a crypto bull flag, and PMs a key levels, plus more…
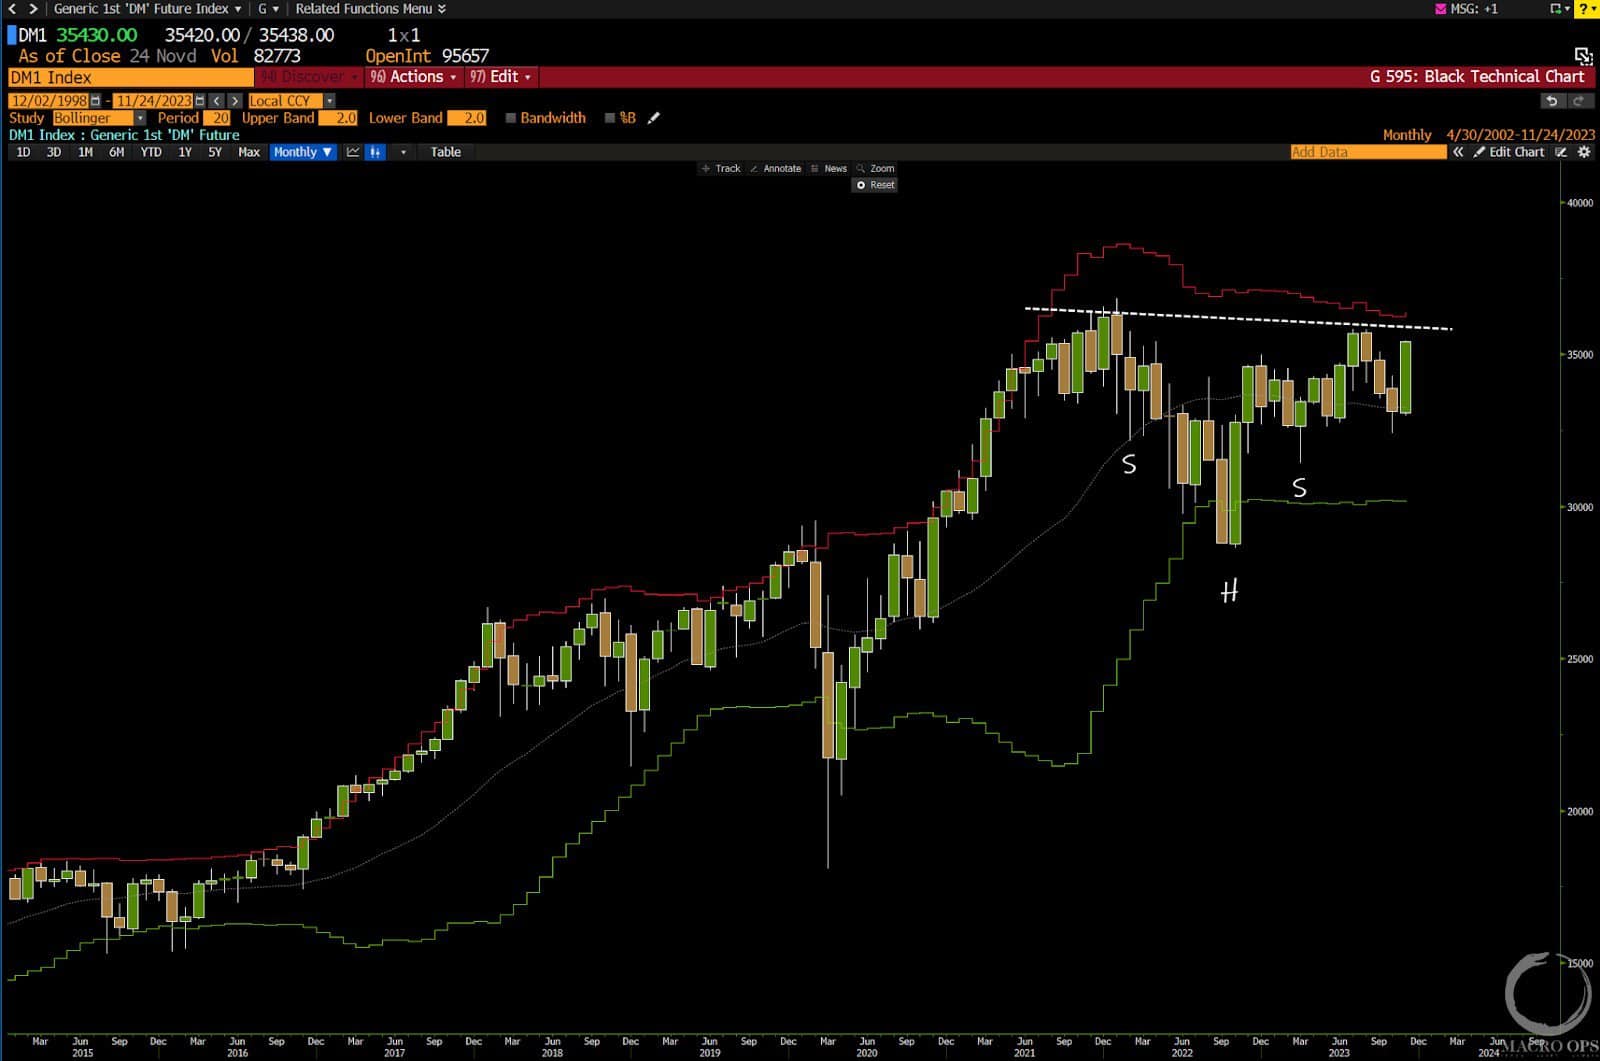
1. There are only four more trading days left in November. It’ll be interesting to see how the major indices close the month. Here we can see the Dow is getting close to completing an inverted H&S continuation pattern.
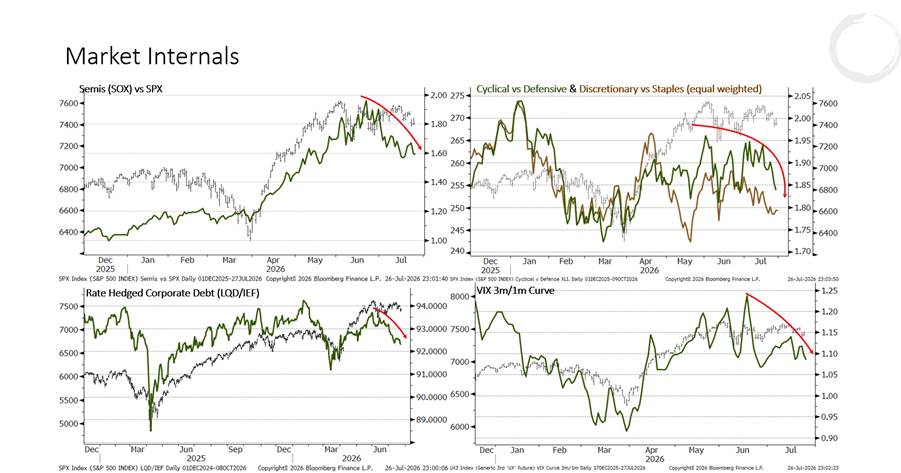
Short-term, US markets are looking a bit overbought. But more intermediate term, the path of least resistance remains up.
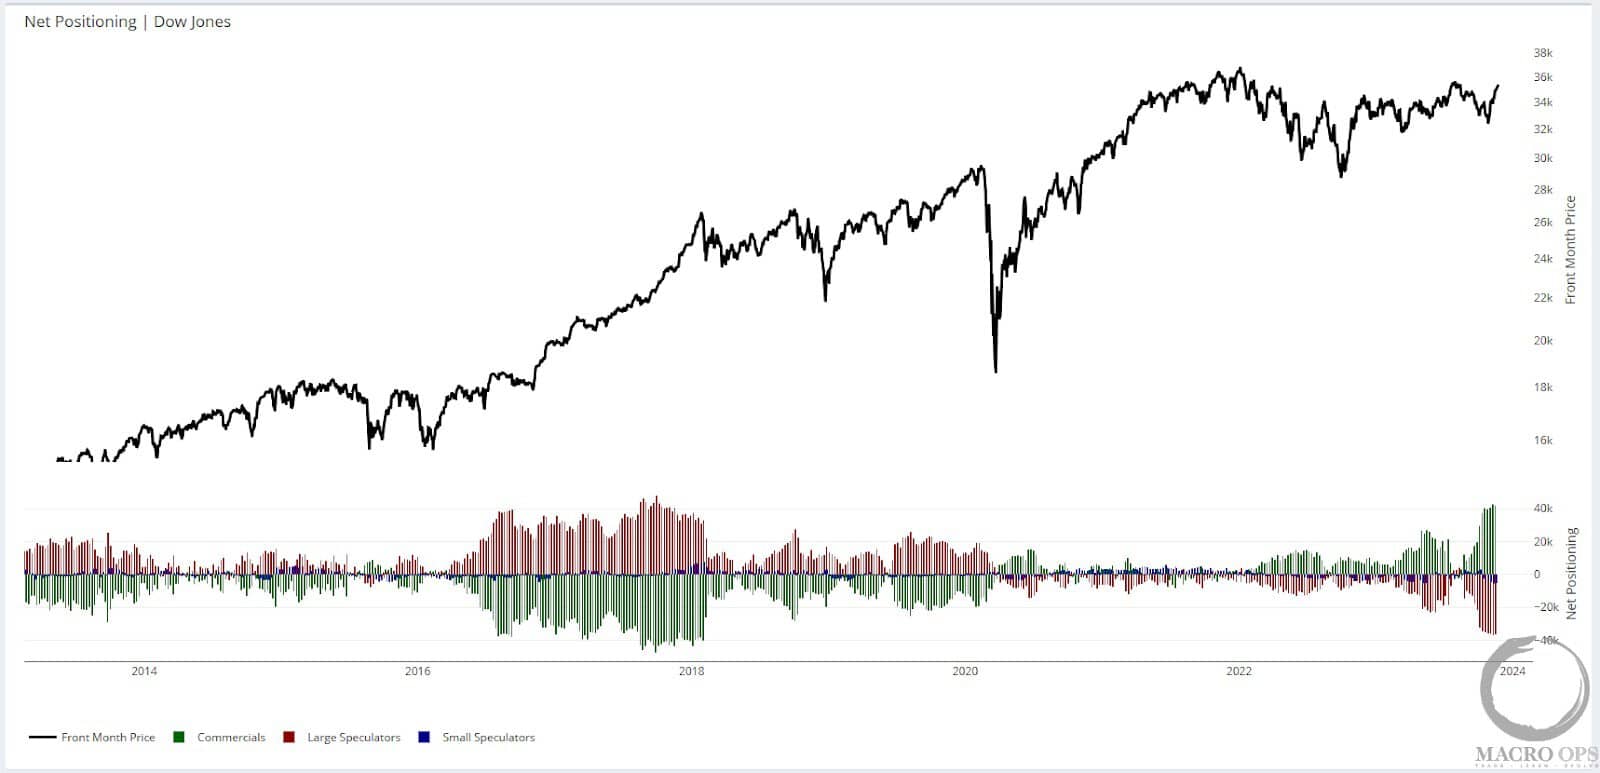
2. This is made more interesting by the fact that speculators, both large and small, remain extremely short the Dow.
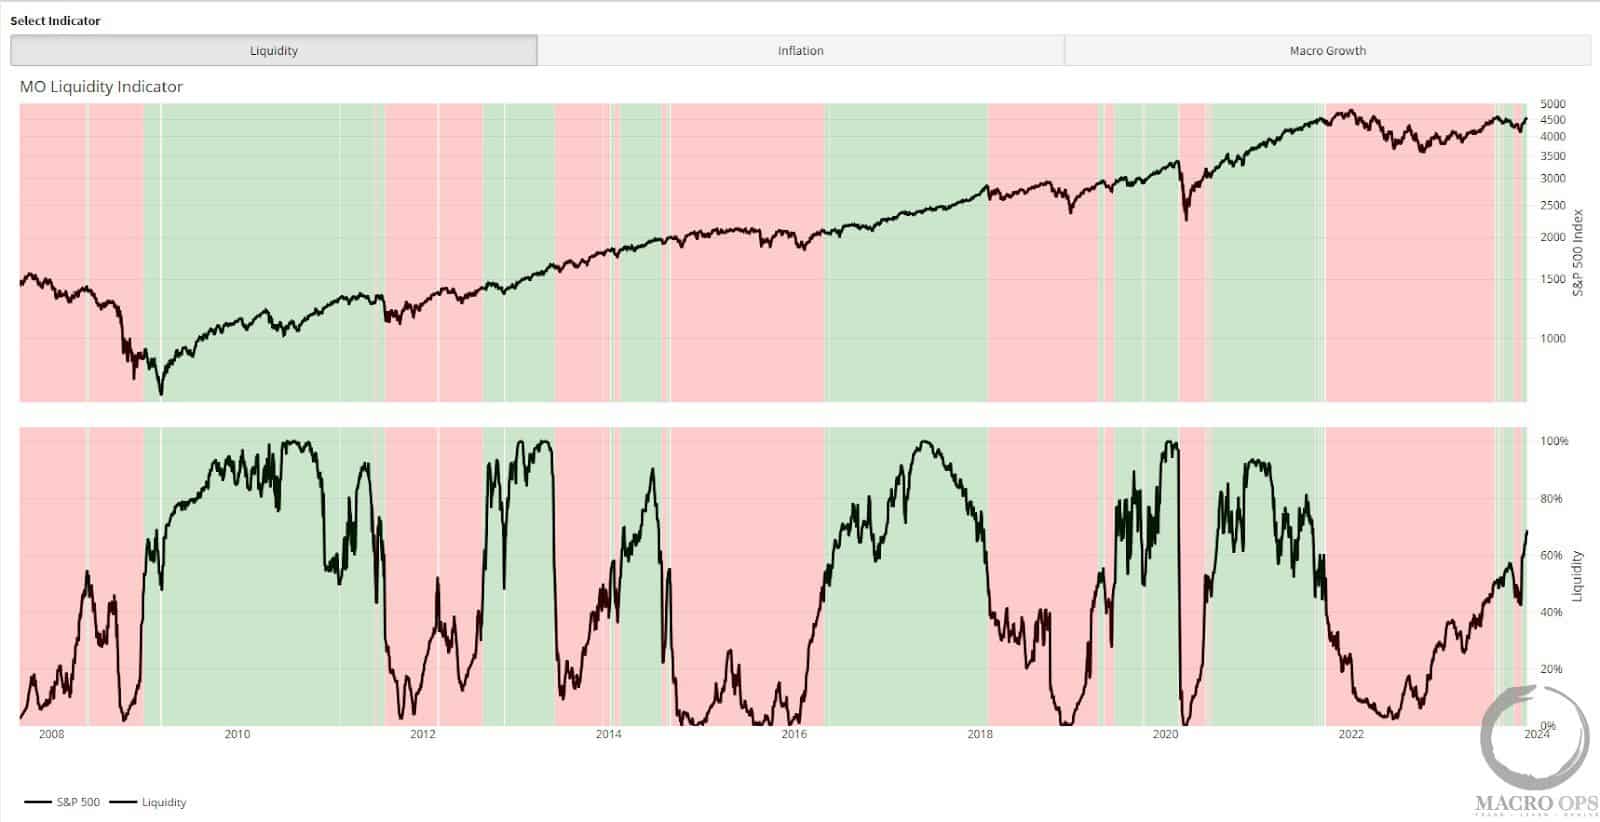
3. Last week, we pointed out the inflection lower in the Chicago Adjusted National Financial Conditions Index, indicating easing liquidity conditions. Well recently, our MO liquidity indicator (a composite of various fincon data points) turned positive (marked by green shading). This is another good development for equities.
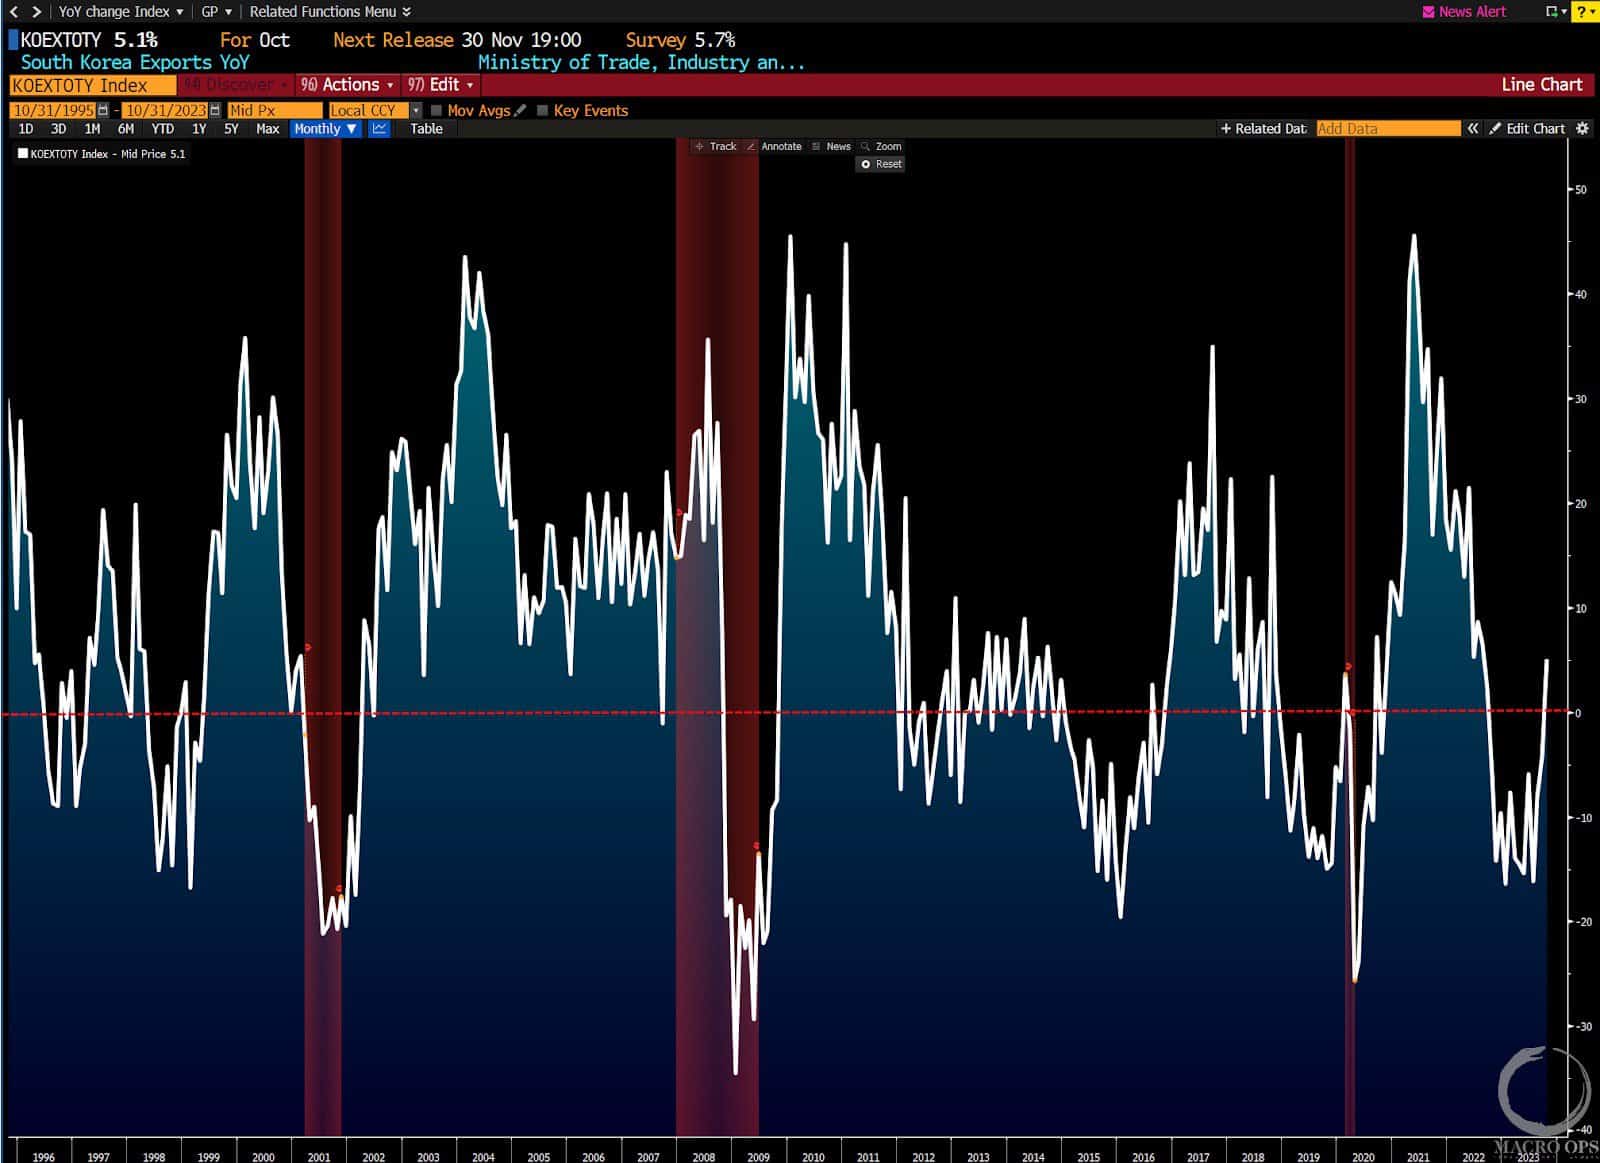
4. South Korean exports have turned solidly positive on a YoY% basis for the first time since they went red at the end of 22’. South Korean exports serve as a good barometer of the global economy.
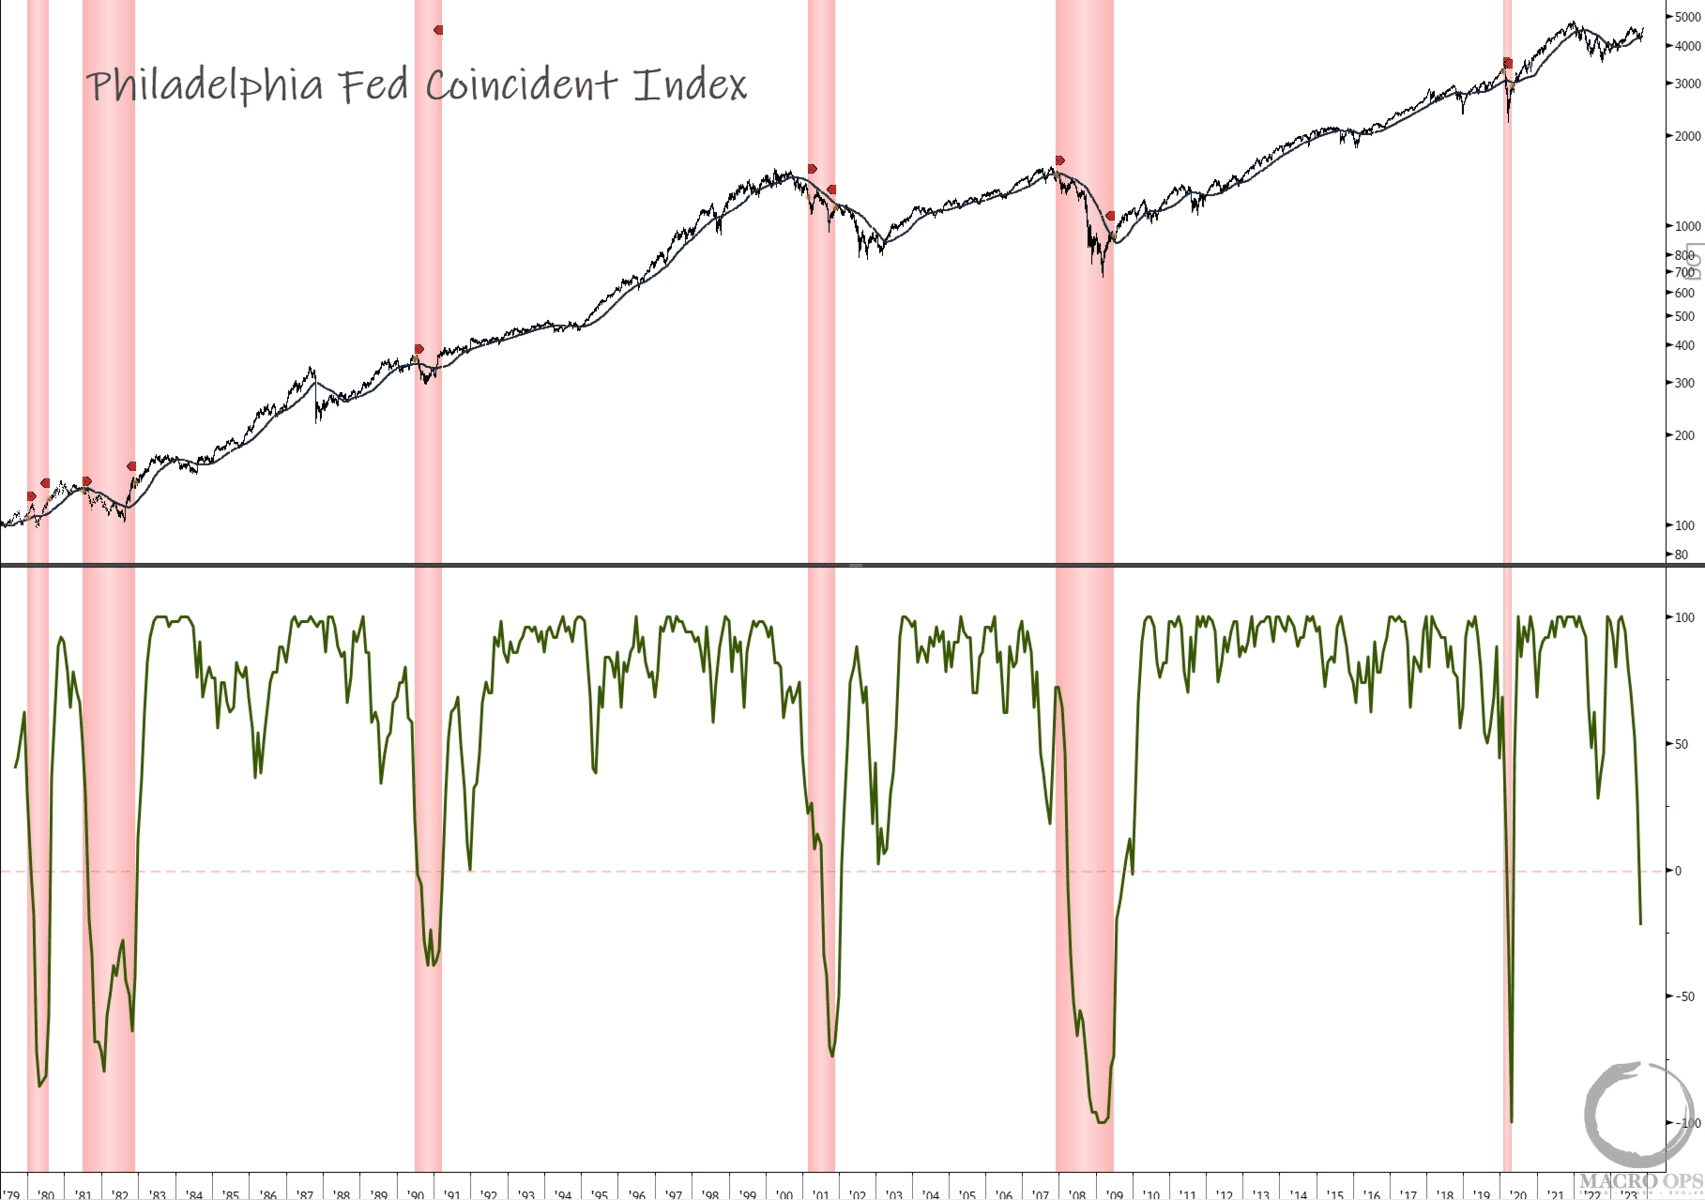
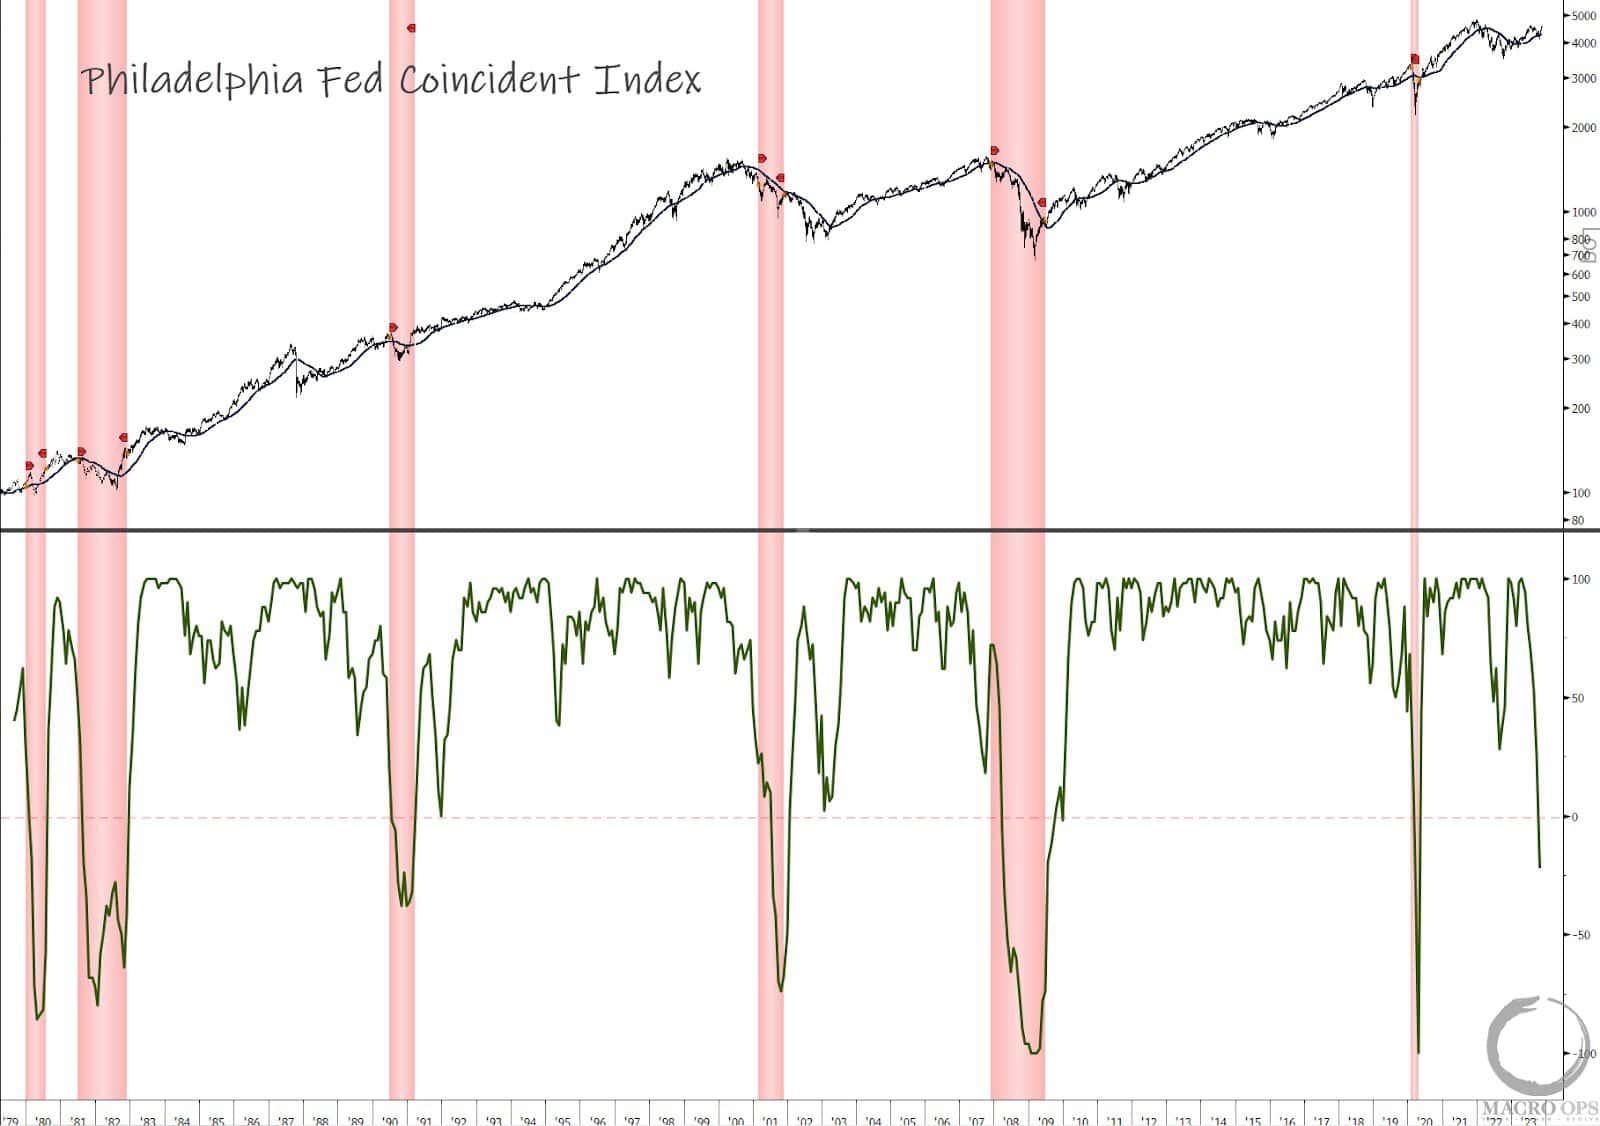
5. But the outlook isn’t all sunshine and roses… Here in the US, we just saw the Philly Fed State Index drop to -22. Every other time over its 40yr+ history that it has fallen below zero, the US was in or soon entered a recession.
This Index is calculated by combining four state-level indicators: nonfarm payroll employment, average hours worked in manufacturing by production workers, the unemployment rate, and wage and salary disbursements deflated by the consumer price index of all 50 states. A reading above 50 indicates the state’s economy is expanding and below means it’s contracting.
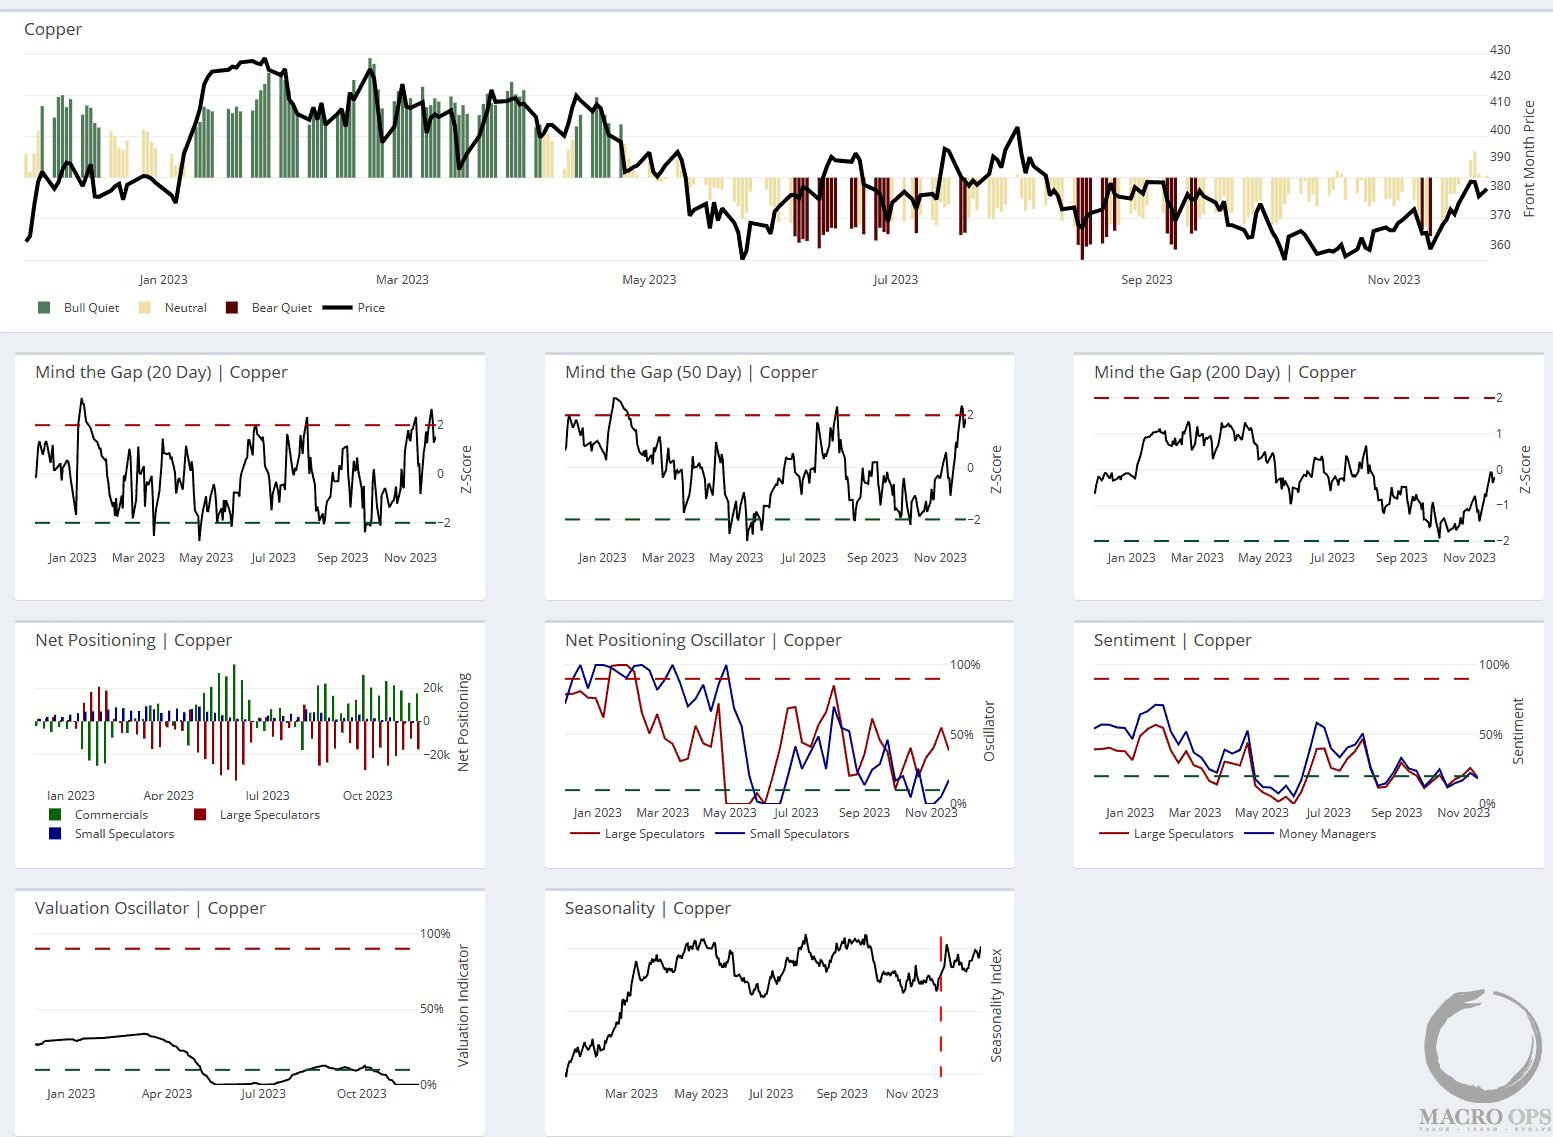
6. With rebounding global growth, at least ex. US, I’m keeping a close eye on copper, which continues to trade in its nearly year-long downward channel (chart below is a weekly).
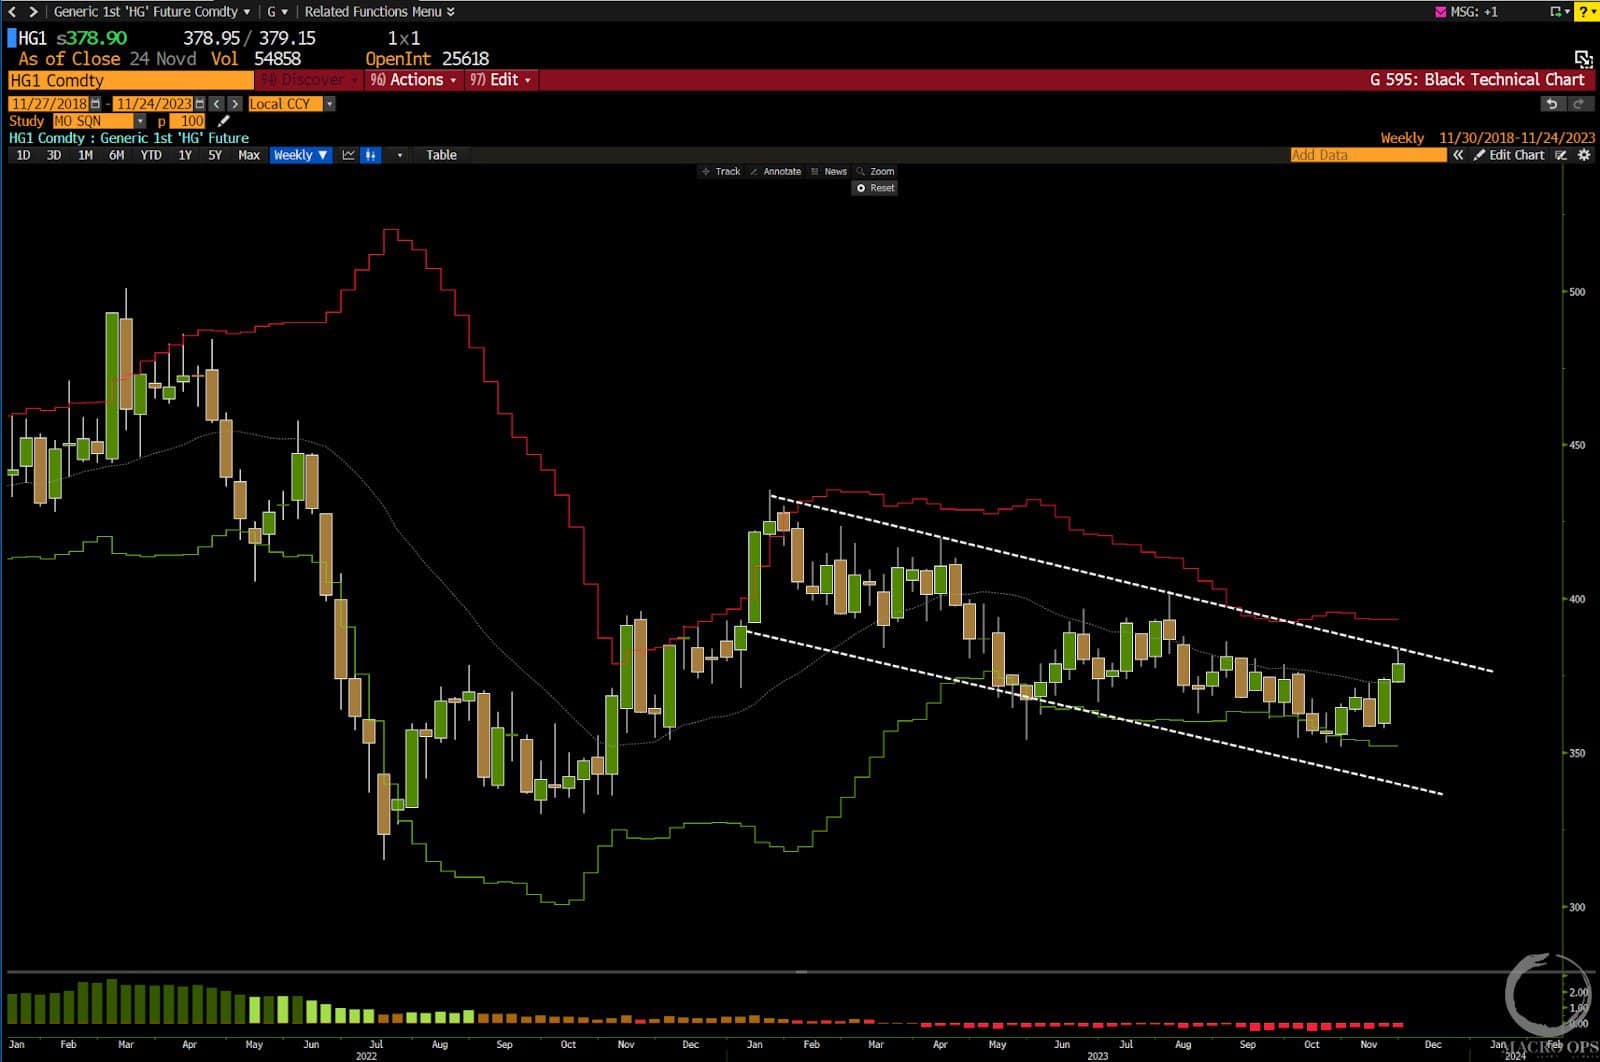
7. Positioning is short but far from crowded. However, our sentiment gauge shows a general lack of interest amongst large and small specs. And our valuation oscillator remains in the 0th percentile.
Also, copper enters into its strongest period of seasonality starting in mid-December and this continues on until the first week of March.
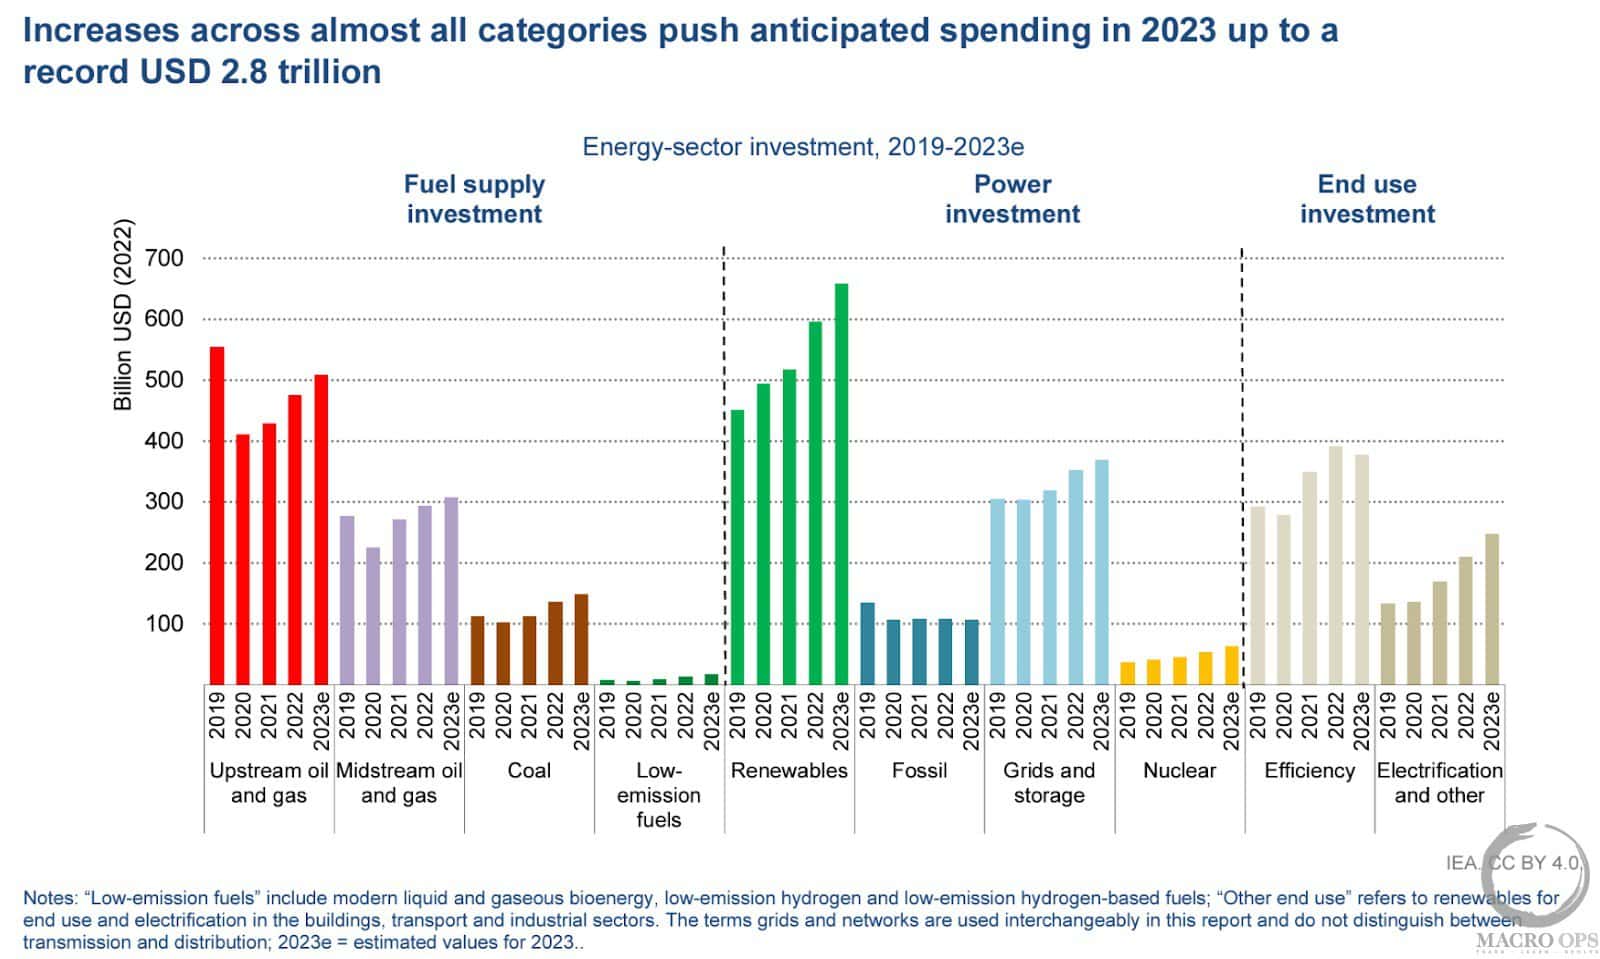
8. Adam Tooze shared some great oil and gas charts in a recent Chartbook which are pulled from the IEA’s recent World Energy Investment and Oil and Gas reports.
Tooze notes that “The leading edge of the transition is electrification. The IEA show surging investment in green power generation (solar, wind), electric mobility (EVs) and to a lesser extent electrical grids and and efficiency. Worldwide, solar and wind – once the domain of woolly-jumpered eco-freaks – are now attracting 30 percent more new investment than upstream oil and gas. It is worth pausing to take in that fact.”
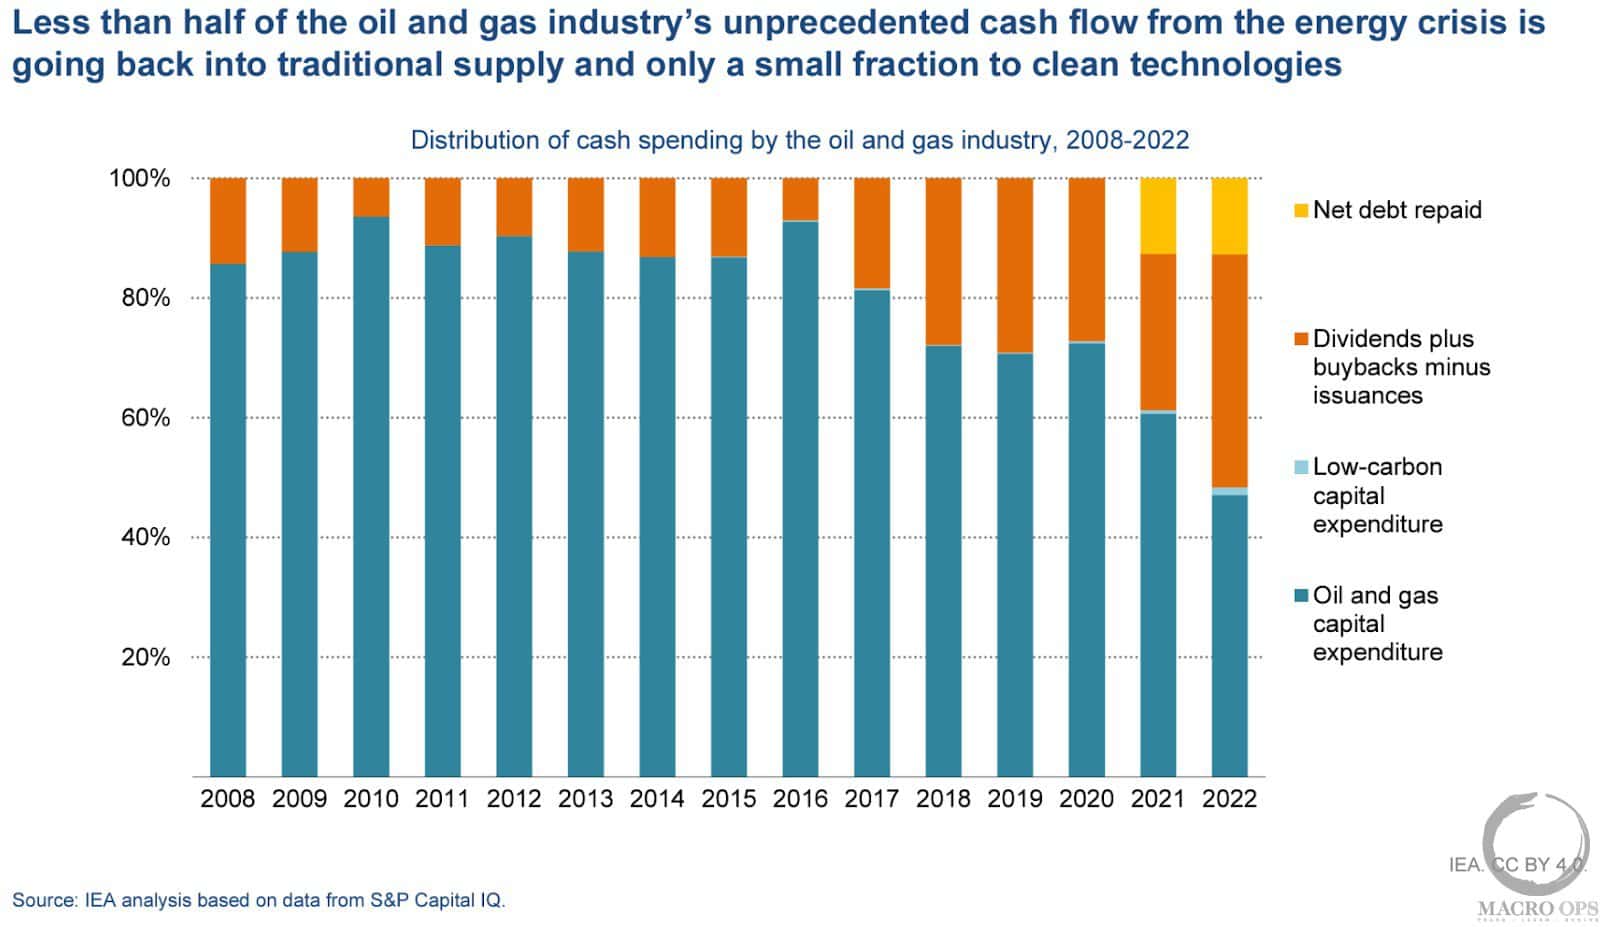
9. And what’s more, the oil and gas industry is not reinvesting its dollars back into expanding or even sustaining capacity. Instead, it’s paying down debt and buying back stock. This is how every CAPEX cycle plays out, but this one looks like it’ll be particularly extreme due to the unique dynamics at play.
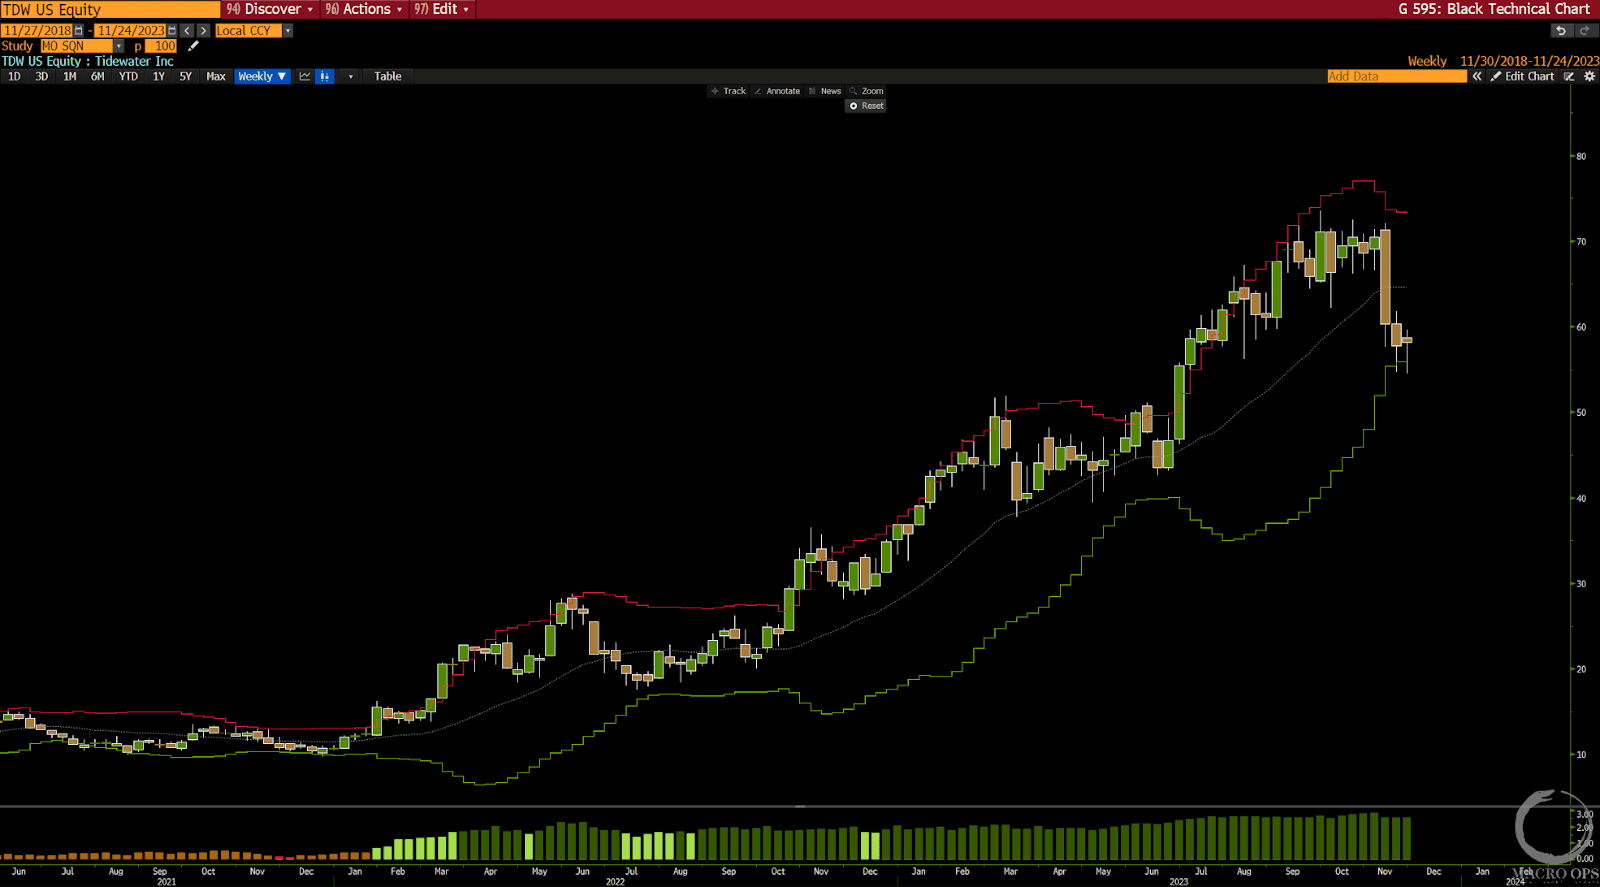
10. Speaking of oil, one of our favorite energy plays and long-time portfolio holdings, Tidewater (TDW), is offering a low-risk technical entry/add spot.
Below is its weekly chart which shows a reversal last week off its lower Bollinger Band. One could put in a buy stop right above last week’s highs and put their risk point right below its lows, giving you good size for low risk.
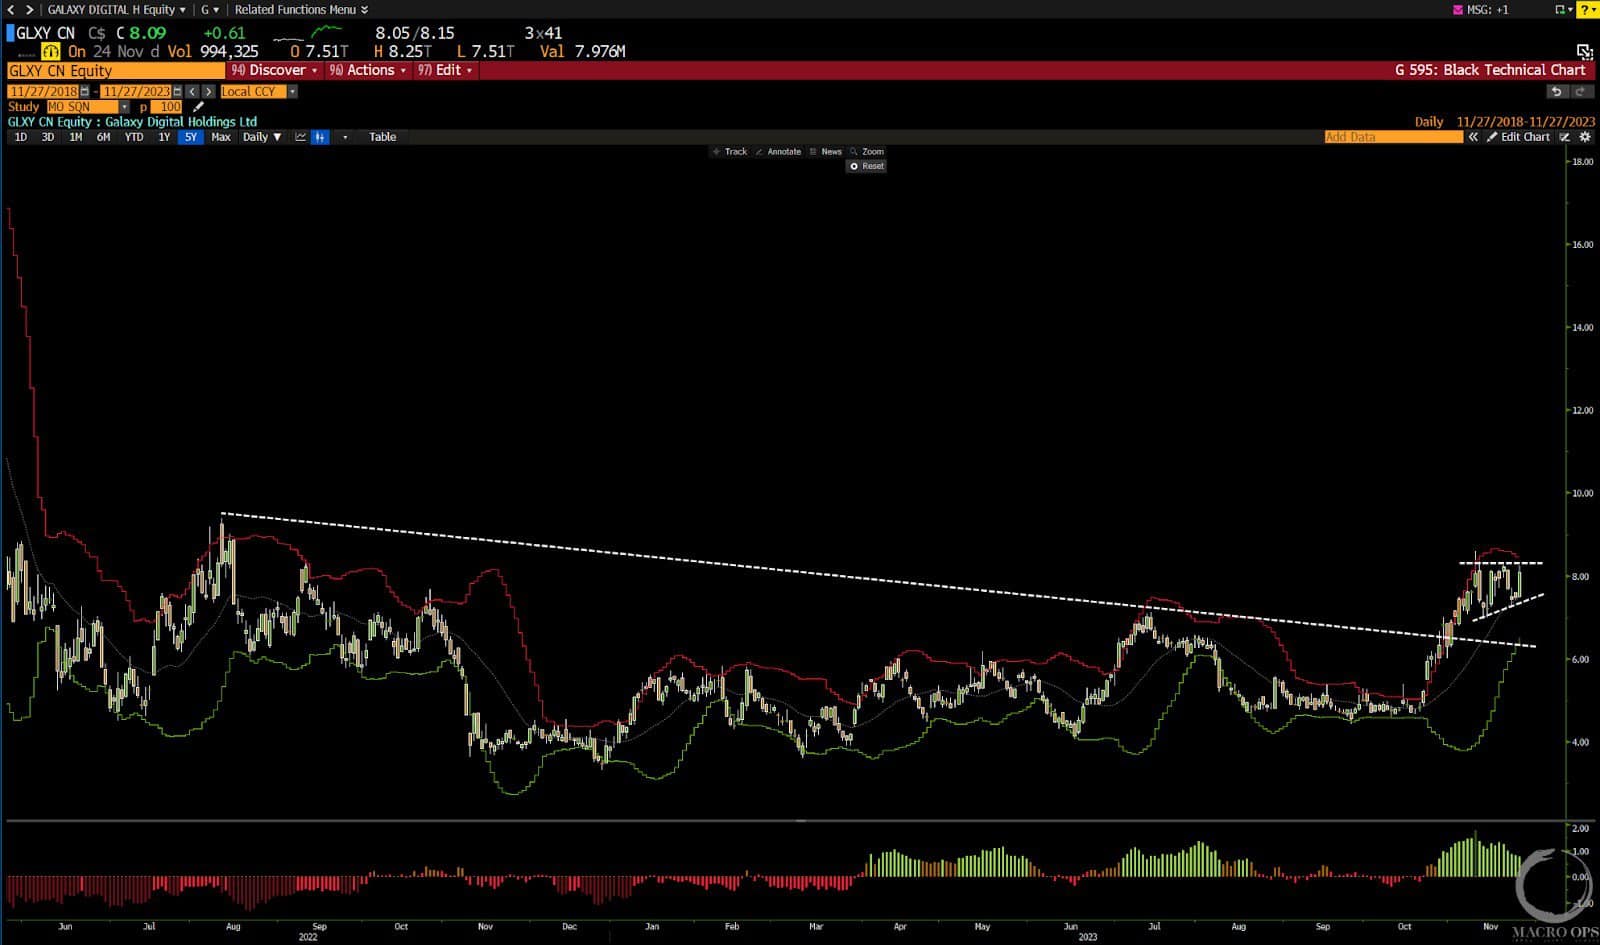
11. Last month, I pointed out the large breakout in the crypto play Galaxy Digital Holdings. It’s had a nice run and is now consolidating its gains as it forms a bull flag. I’ll consider getting long on a breakout from this range.
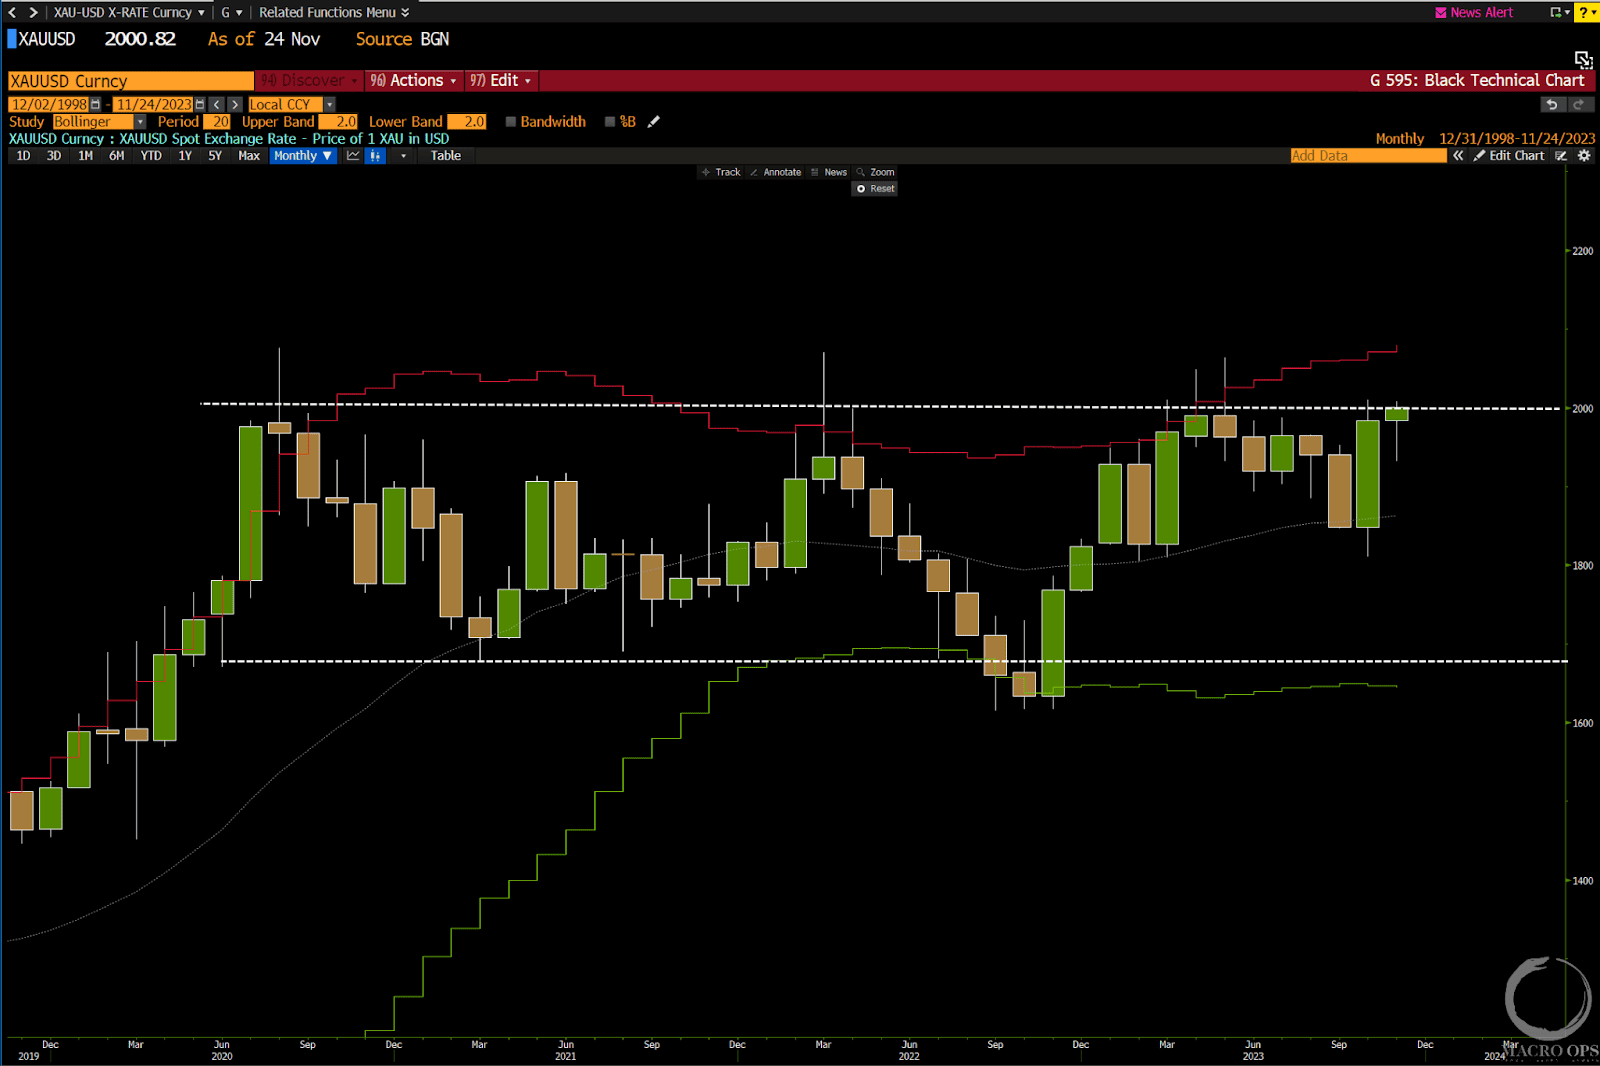
12. We didn’t get the close above the key 2k level last month in Gold. But it’s looking like we may see it this time around. A bullish breakout from this range would give major support to the contracting US growth / bottoming ex. US growth picture that the charts above allude to.
We’re long PMs and will look to add here on a breakout confirmation.
Thanks for reading.