“In the final analysis, you need to have the courage to hold the position and take the risk. You need to be aware that the world is very sophisticated and always ask yourself: ‘How many people are left to act on this particular idea?’ You have to consider whether the market has already discounted your idea.” ~ Michael Marcus
Good morning!
In this week’s Dirty Dozen [CHART PACK] we look at bullish thrusts, breadth thrusts, and bull bar anomalies… we then dive into asset class predictive returns, stretched yields, bullish energy, developing crypto charts, and more…
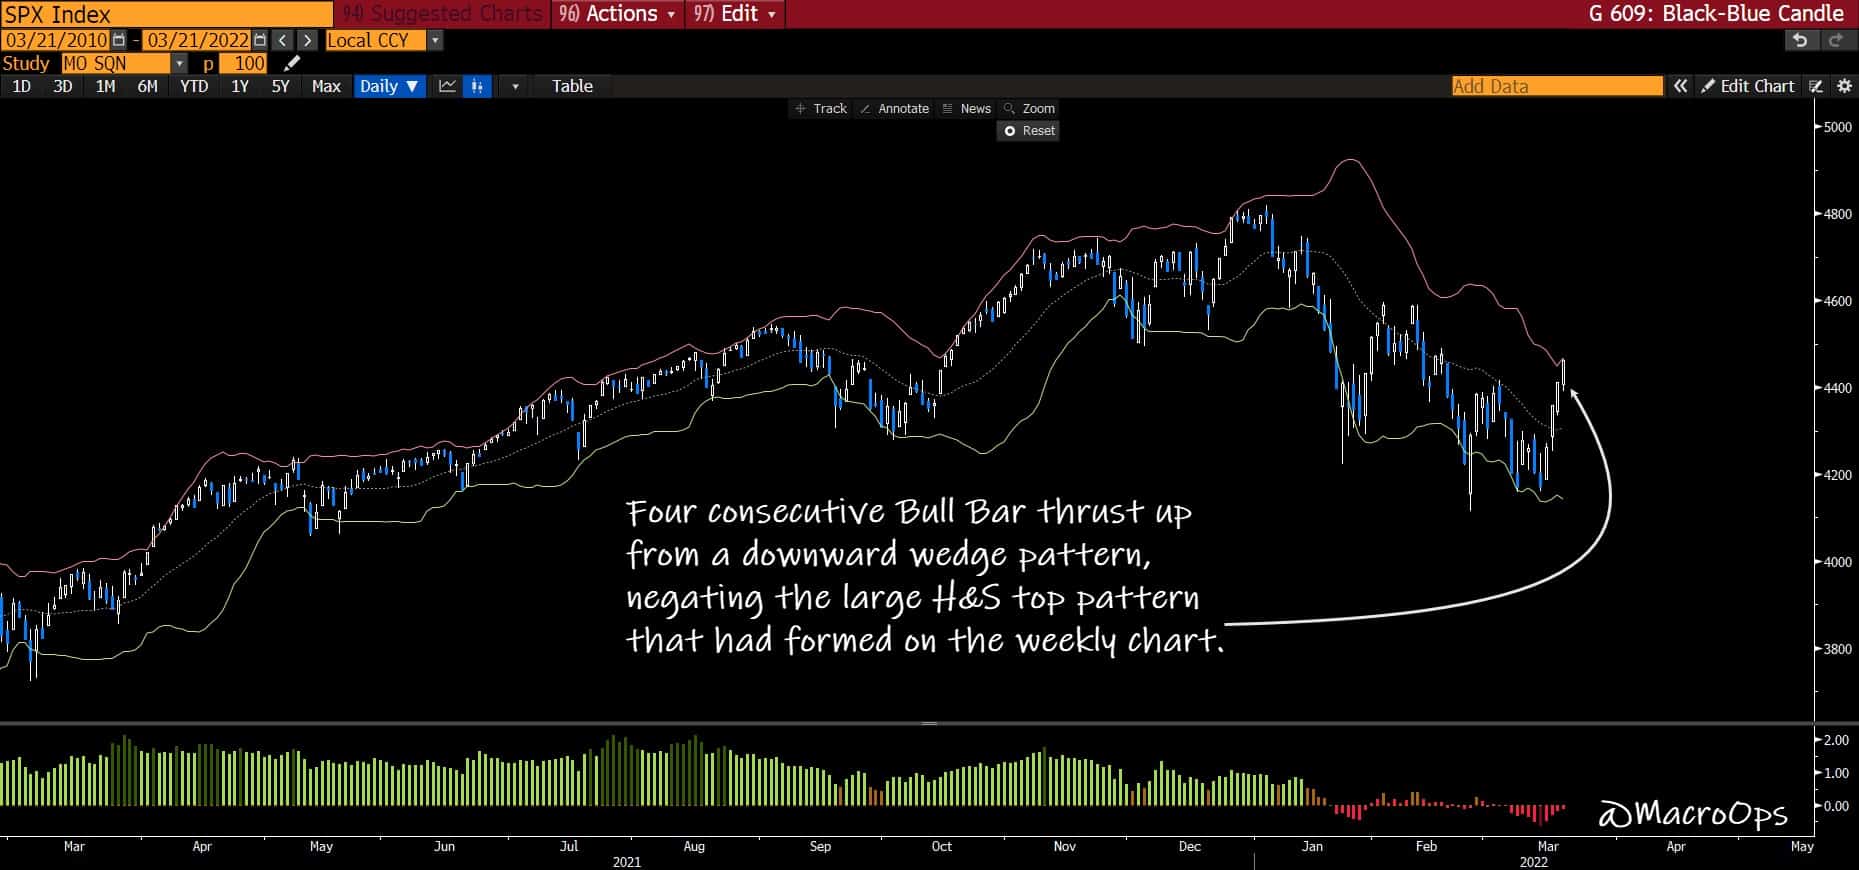
- The submerged beach ball we’ve been talking about popped up. The SPX invalidated its large H&S top on the weekly charts, putting in a significant bear trap reversal.
It put in four consecutive bull bars on the daily as it thrust out from its descending triangle.
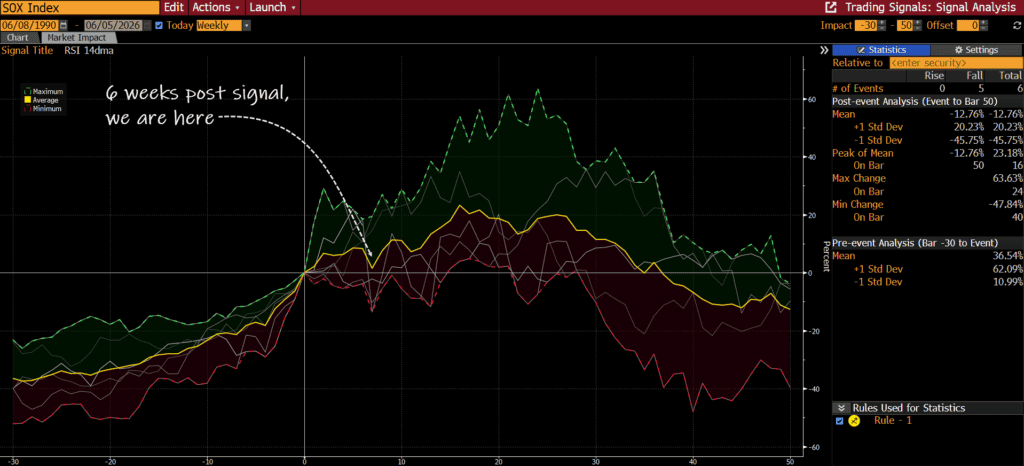
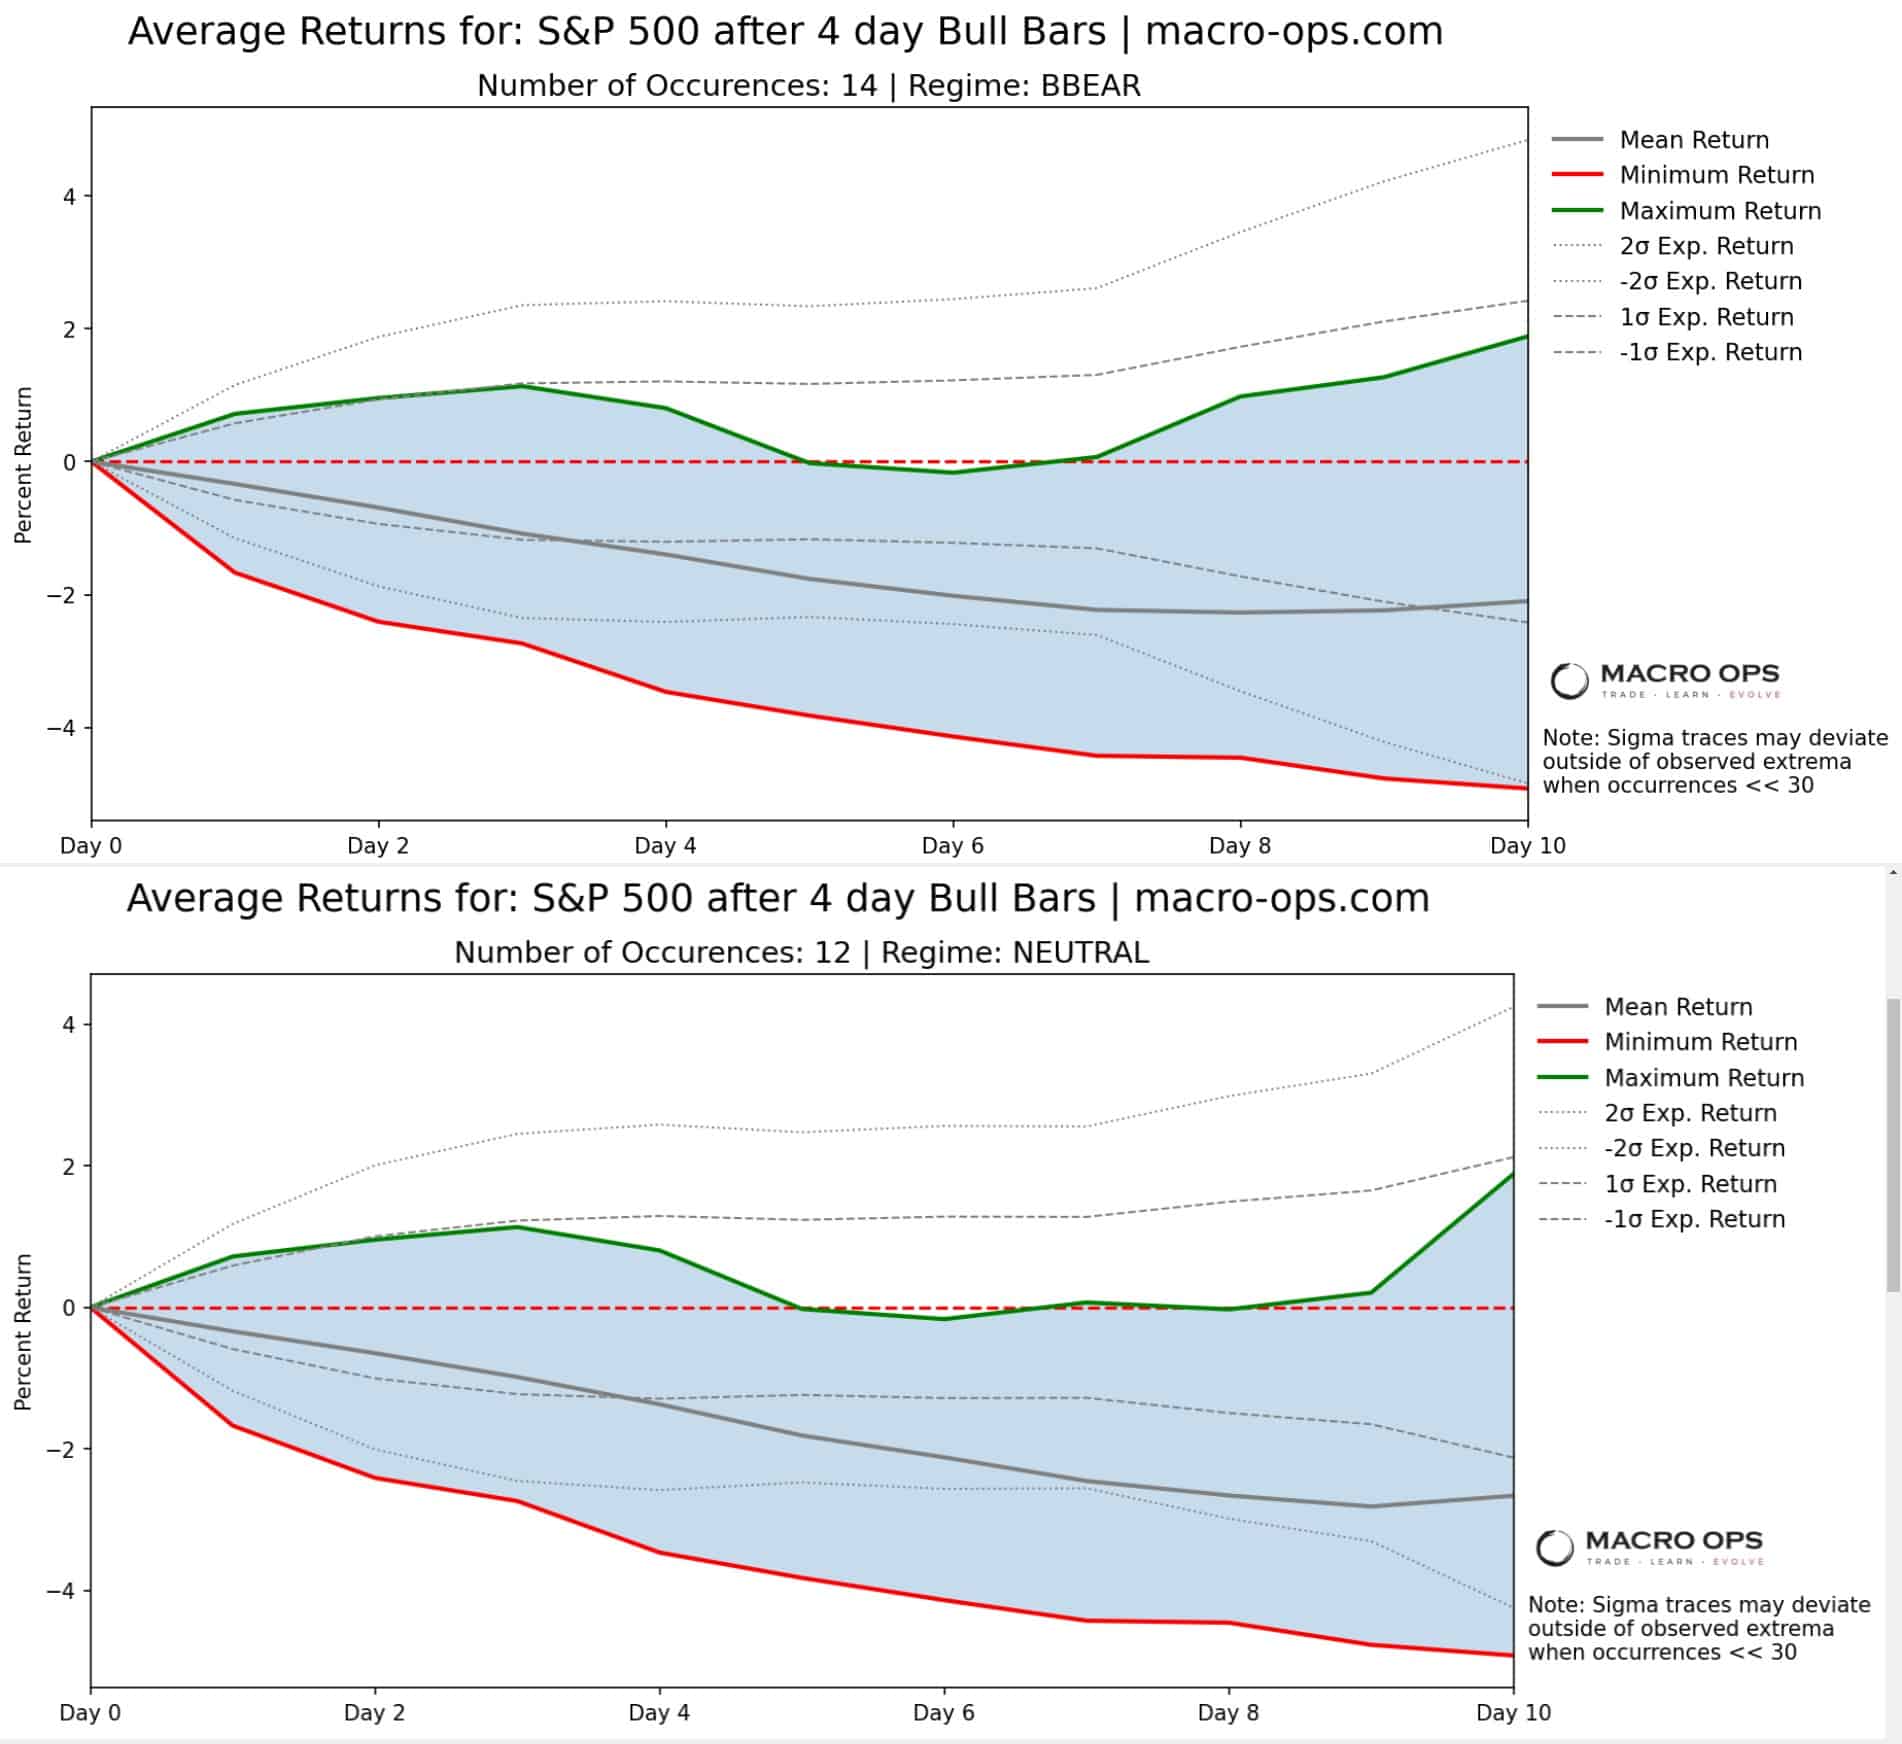
- Four consecutive bull bars is typically a bullish signal, at least over the intermediate-term. But, over the short-term, when the market is in a Blended Bear or Neutral regime like it is now, it tends to lead to losses and consolidation over the preceding 1-2 weeks.
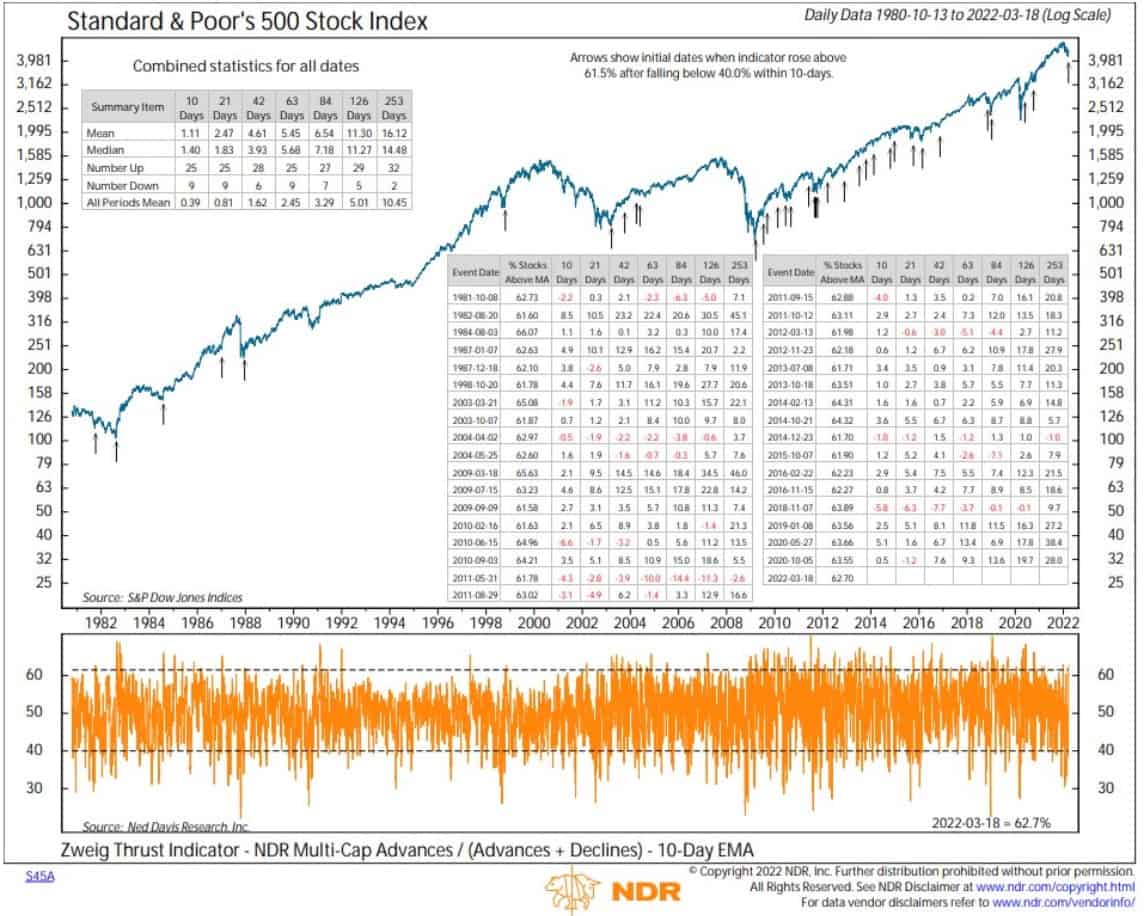
- On a positive note, a number of Breadth Thrusts fired last week. One of them was the Zweig Thrust, shown here by NDR (h/t @edclissold).
I should point out though, that while a Zweig BT is bullish, the hit rate of this indicator is not as high as it used to be. Due to a number of structural market changes, this indicator fires more frequently now, which you can clearly see on the chart below. And the more a BT indicator triggers, the higher the noise-to-signal ratio is.
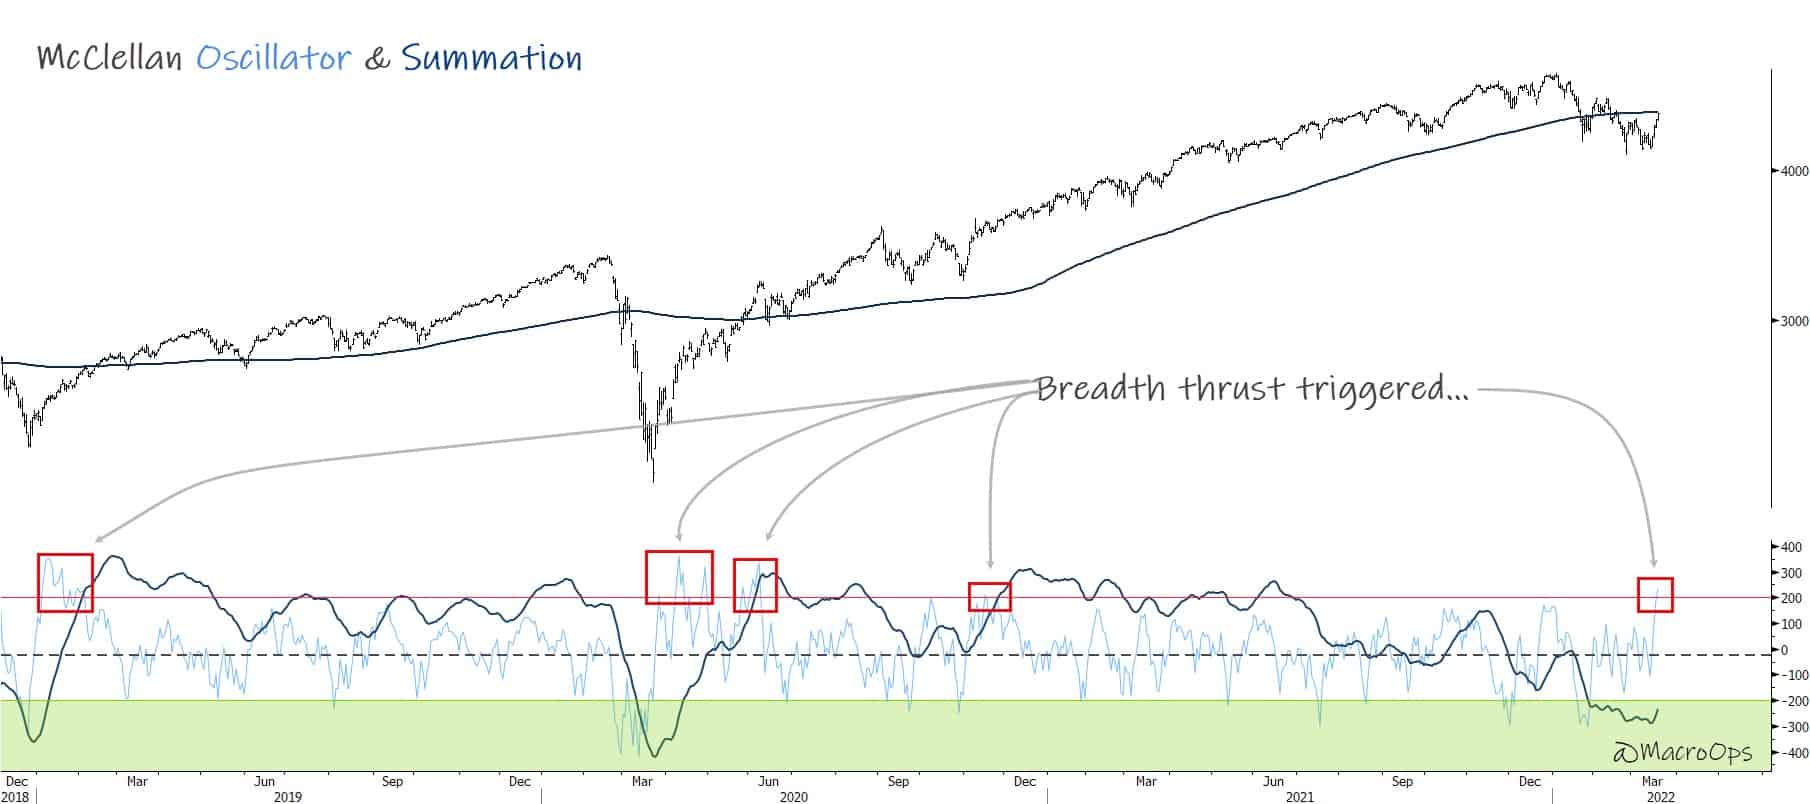
- The McClellan Oscillator also rose above 200, triggering a breadth thrust. This is another positive development and should lead to higher follow-through over the next few weeks.
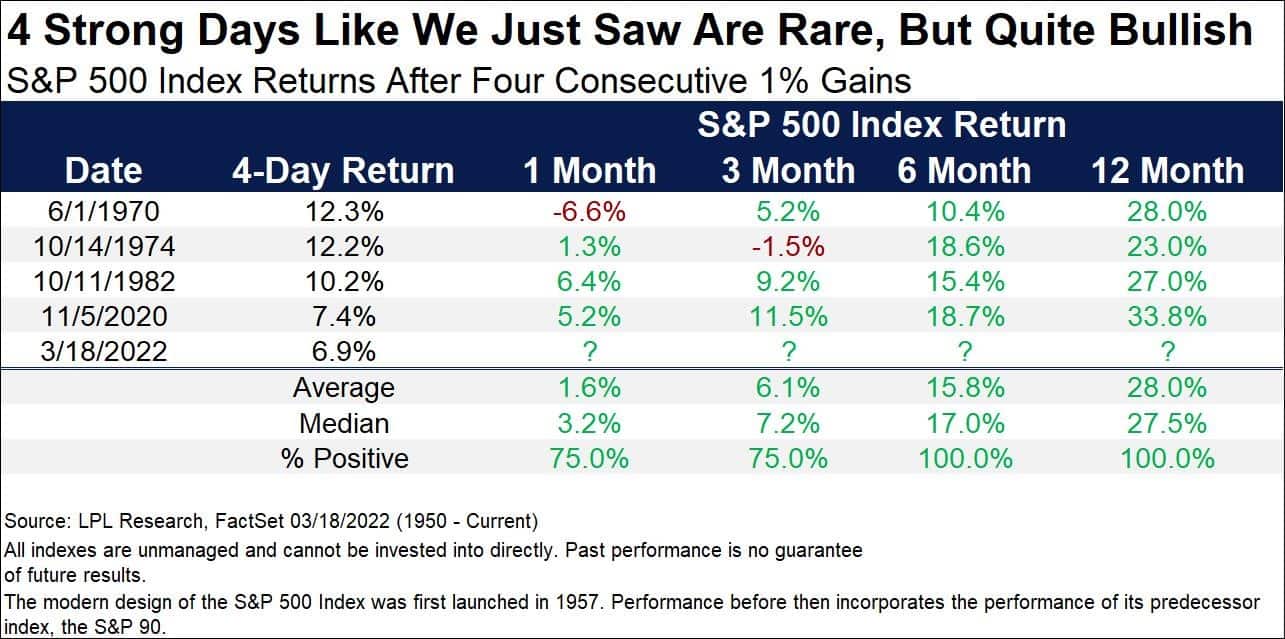
- In a follow-up to our shorter-term study, @RyanDetrick shared on the twitters how four strong consecutive up days is quite a rare event. He wrote:
History was made this week.
For only the 5th time ever, the S&P 500 gained at least 1% for 4 consecutive days.
This rare occurrence is also quite bullish, as a year later it has been up more than 20% every single time with an average gain of 28%.
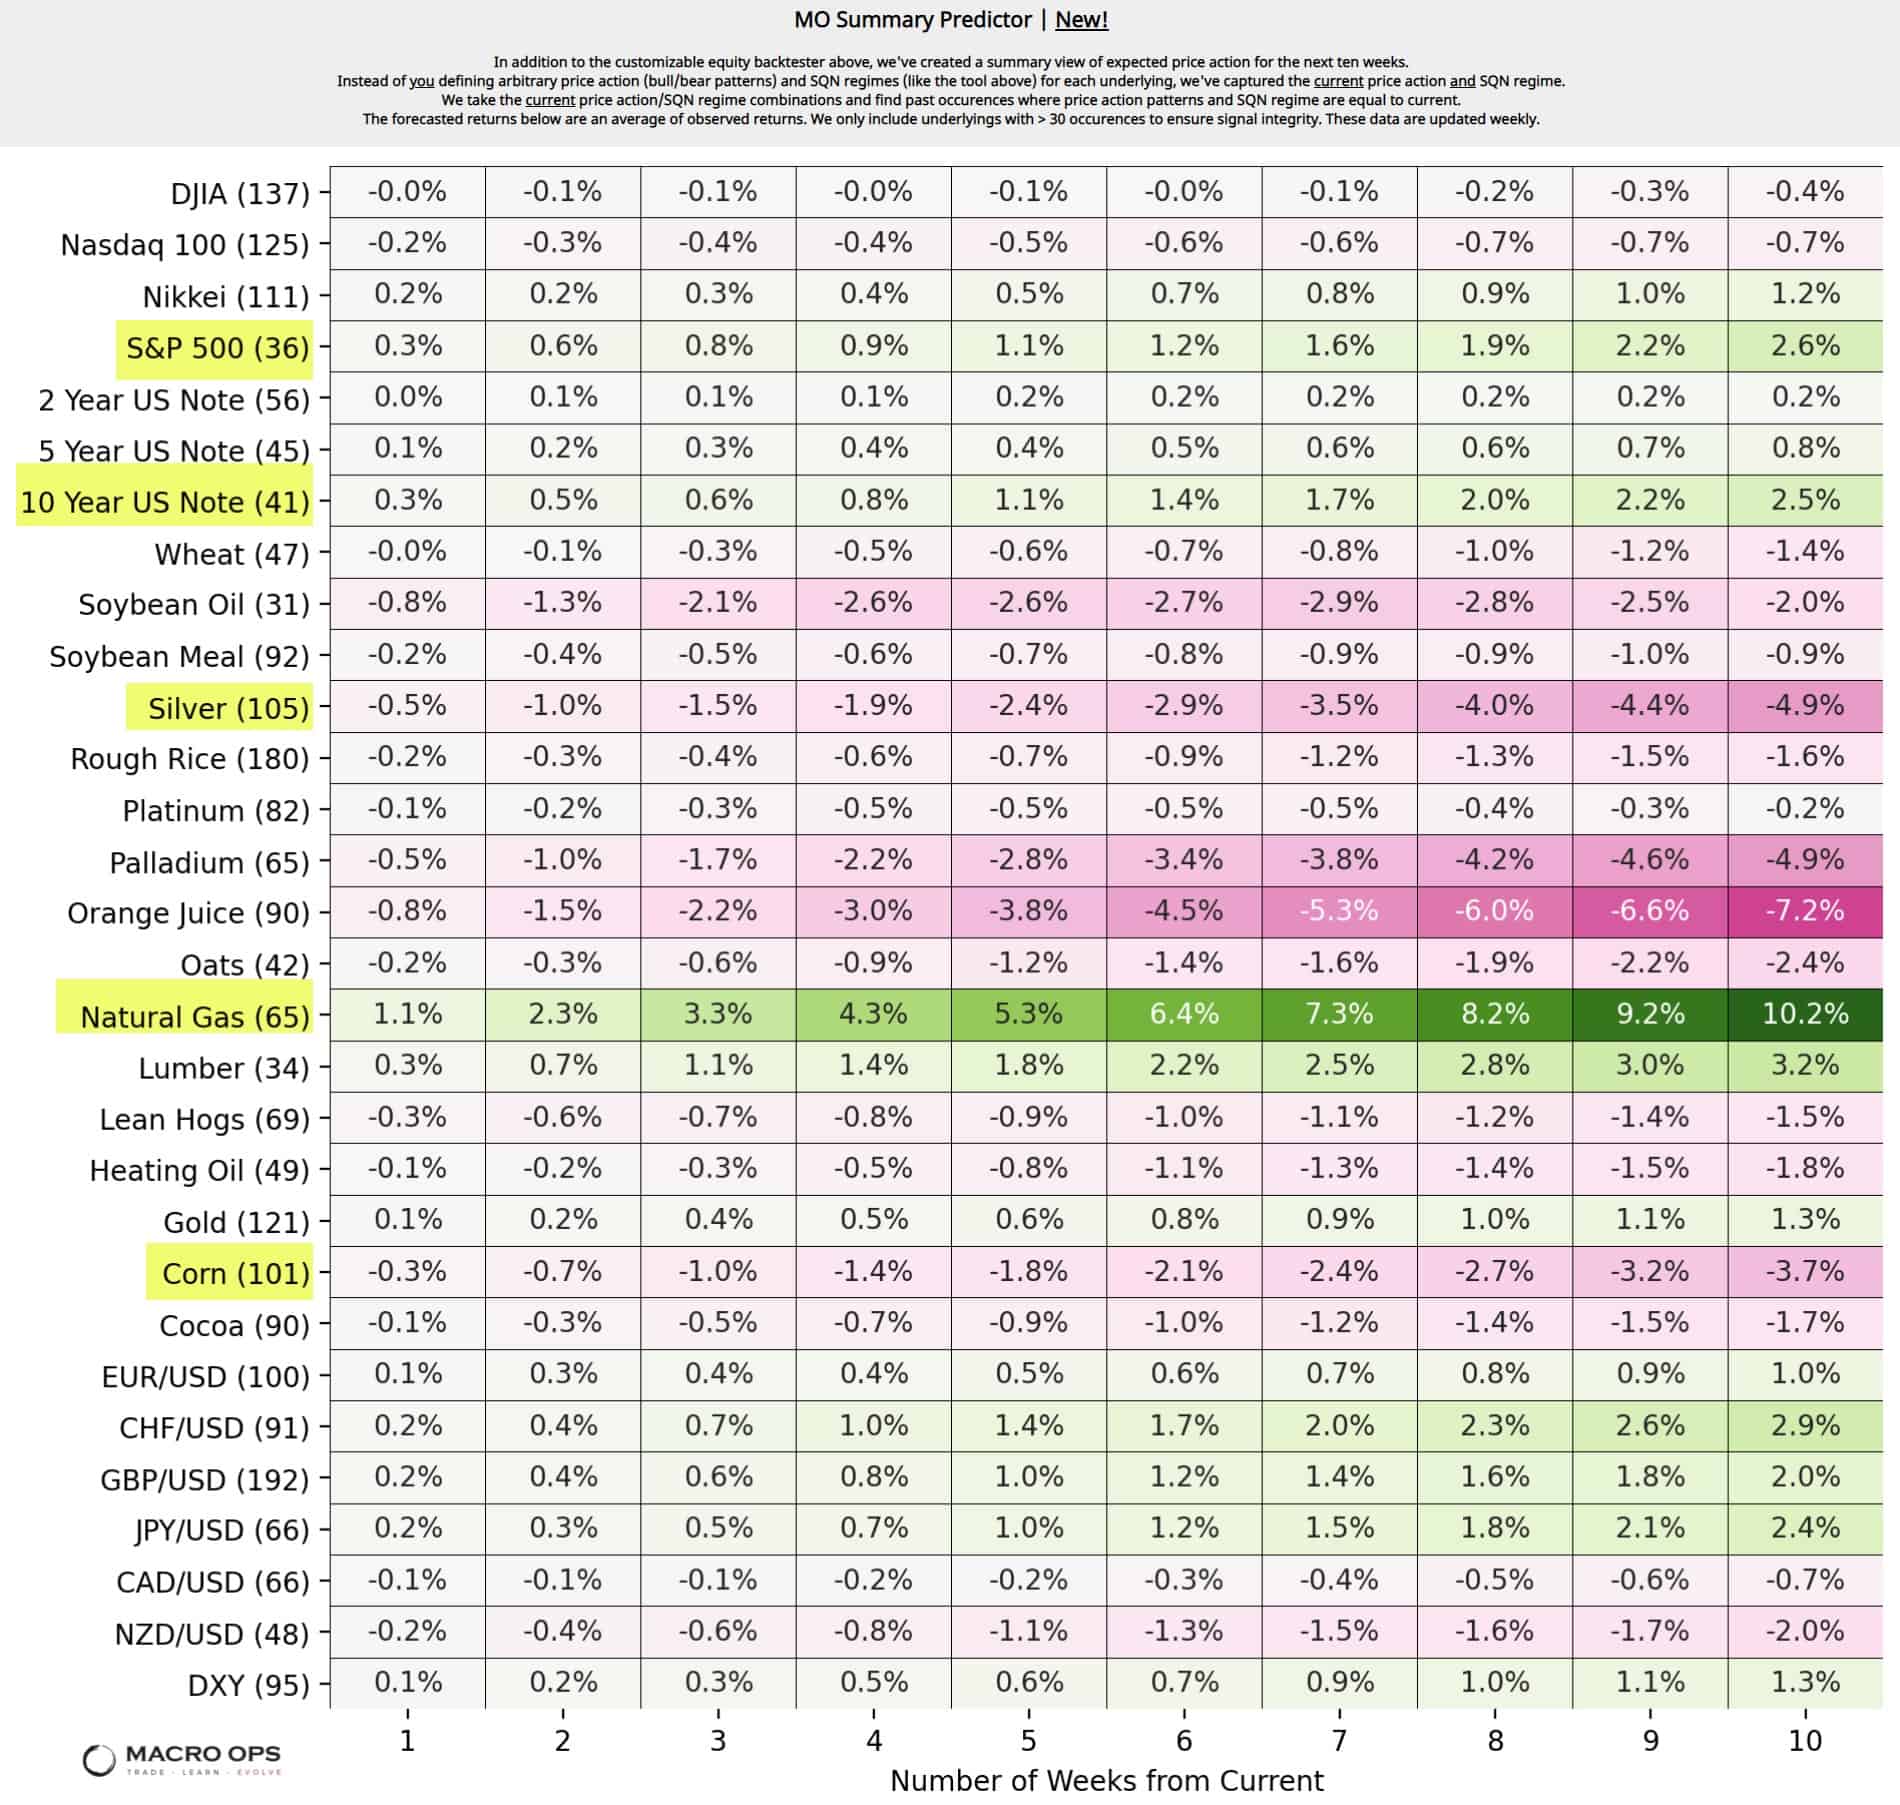
- Our MO Summary Predictor tool takes current price action/SQN regime combinations and finds past occurrences where price action patterns and SQN regime are equal to current.
The forecasted returns below are an average of observed returns. We only include underlyings with > 30 occurrences to ensure signal integrity. Highlighted are the higher variable return predictions. Natty is looking particularly interesting…
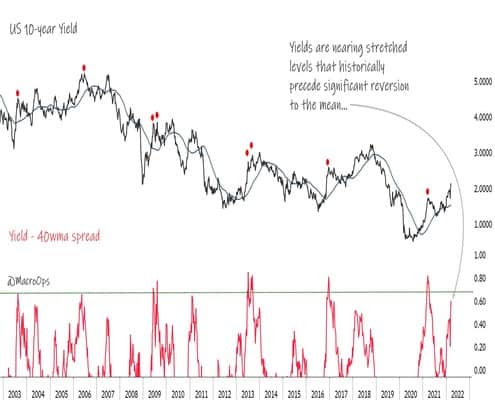
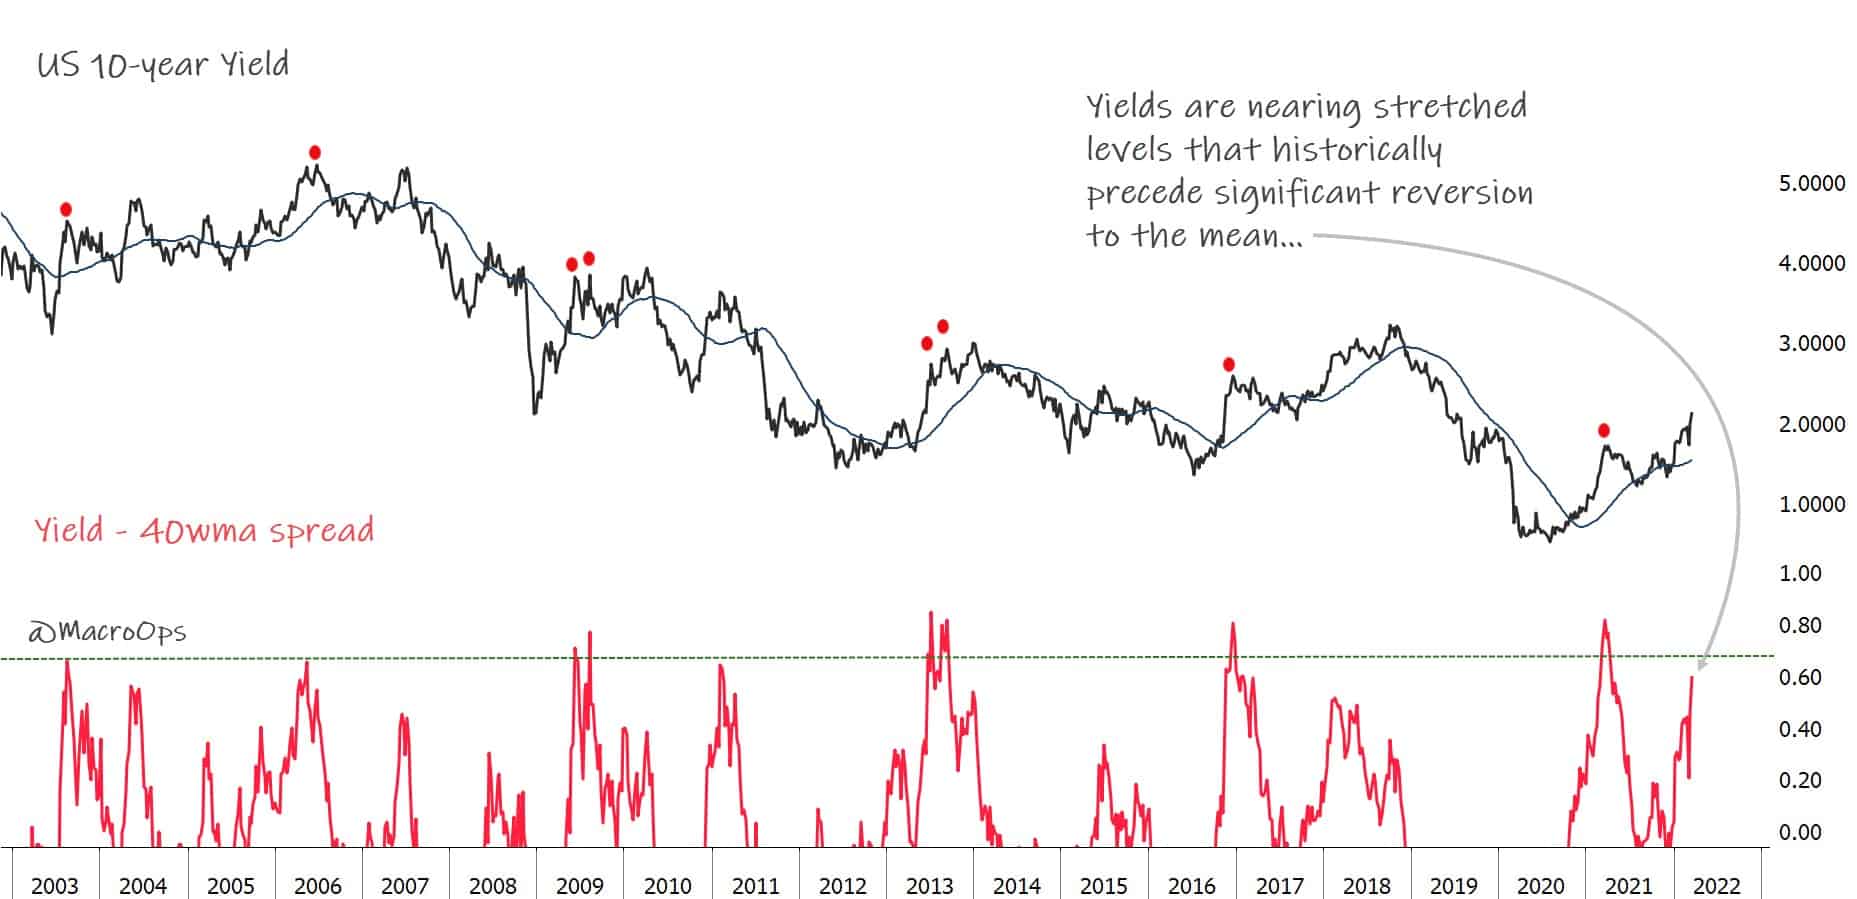
- Rising yields continue to be a major headwind for stocks. But… 10-year yields are nearing stretched levels that historically lead to major reversion to the mean.
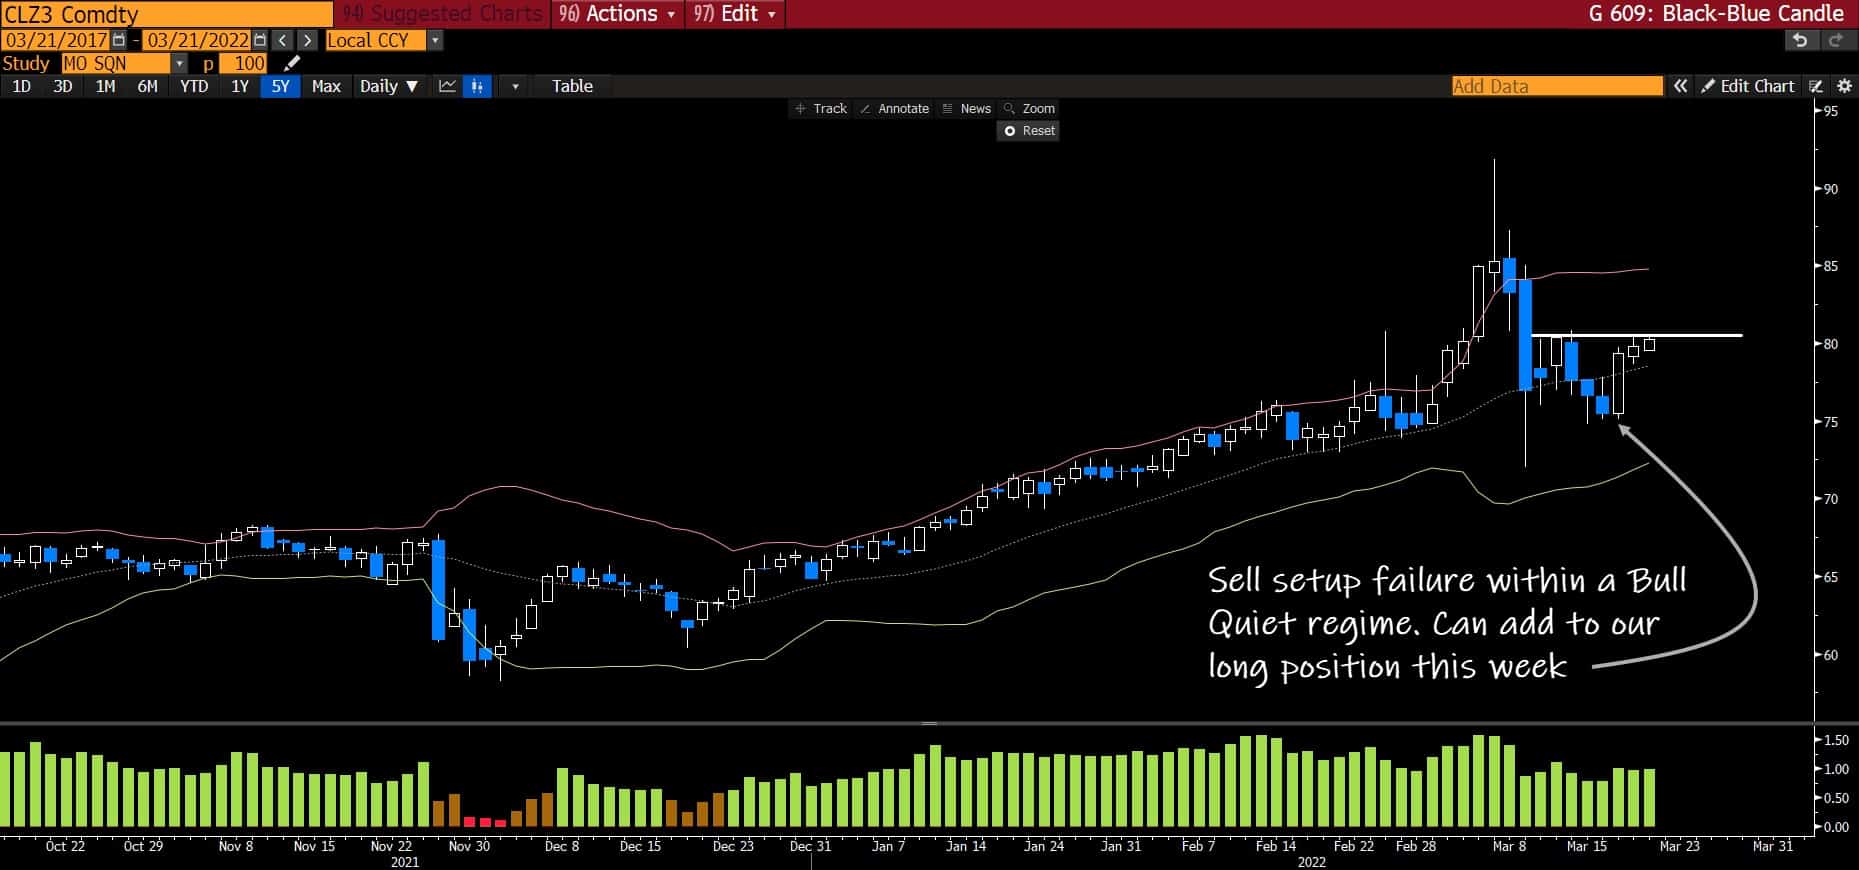
- We continue to be big oil bulls. For those not long crude, this recent selloff is giving you another chance to get in. We saw a classic sell setup failure within a Bull Quiet regime last week. Below is the Dec 2023 contract.
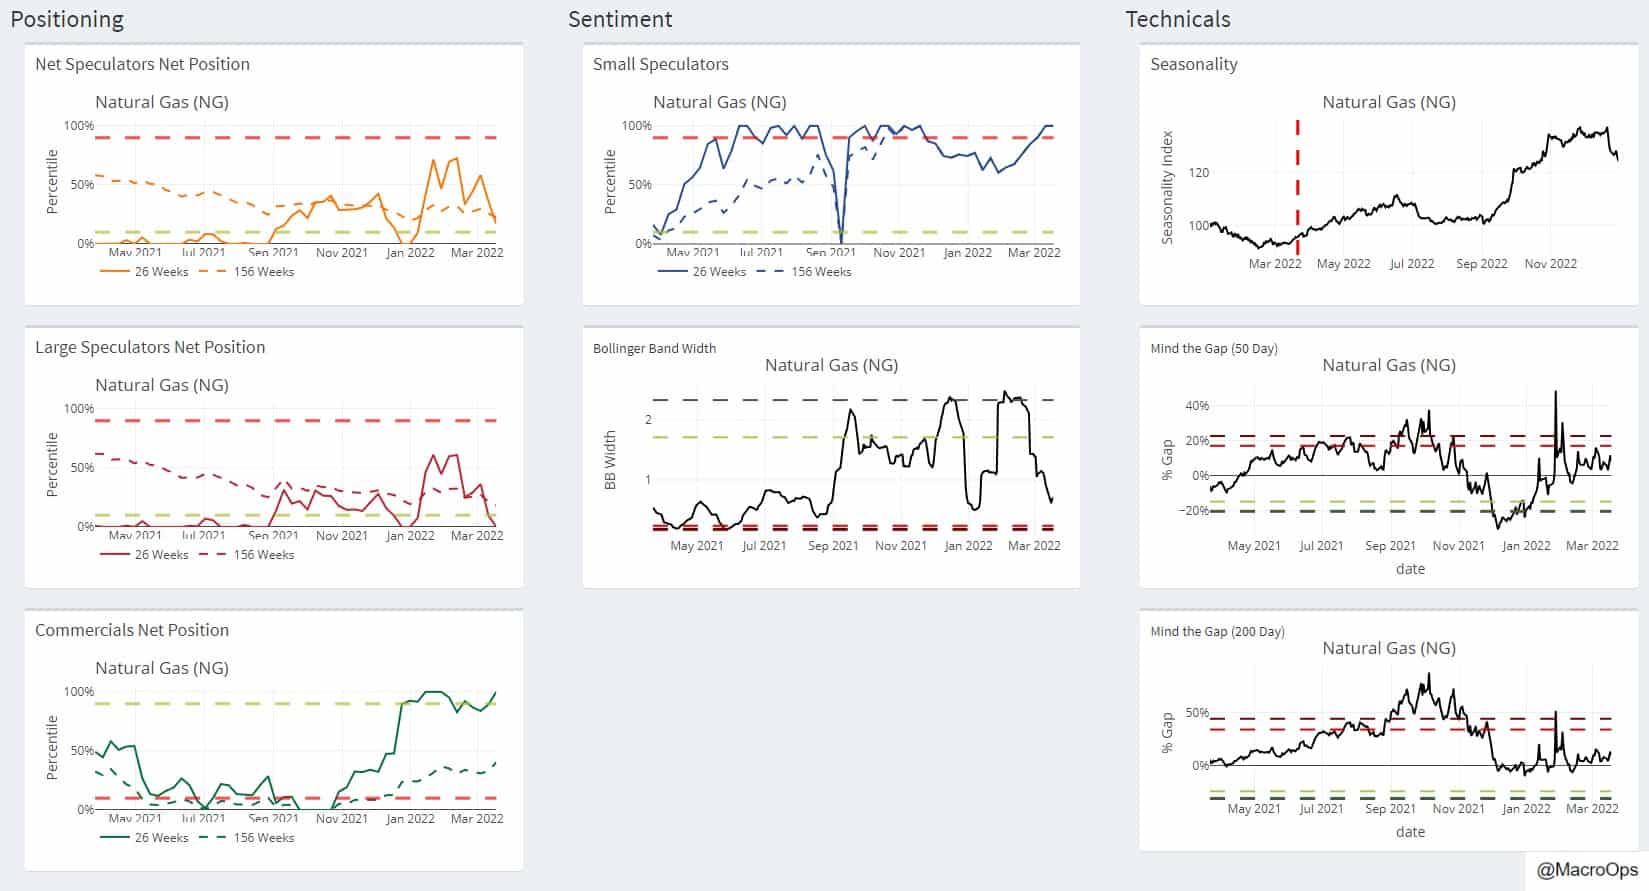
- Natty’s chart is solid; close to breaking out of consolidation within a larger uptrend. I like the longer-dated contracts (NGZ2022).
Our dashboard shows sentiment and positioning are supportive, as Net Specs are quite short. Technicals are compressed and the market is entering a period of more positive seasonality.
- Ray Dalio has disappointingly become somewhat of a CCP apologist over the last few years. I still enjoy his work though, if anything because he usually includes some interesting data and charts.
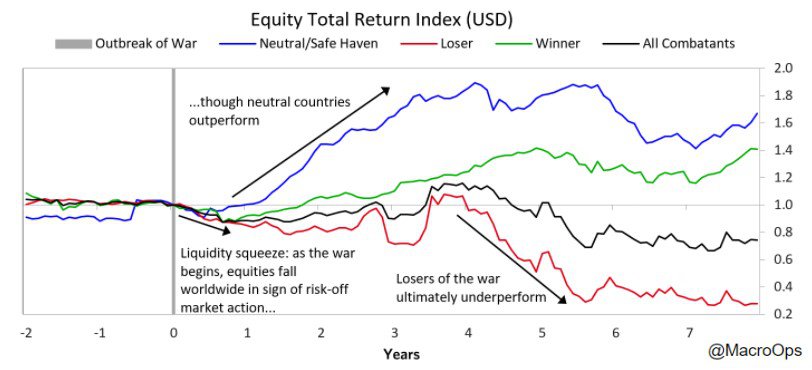
His recent post The Past Is Prologue: The Changing World Order; How the Sides Are Lining Up definitely had a few. Below is a chart graphing total equity market returns in USD for neutral/safe havens, winners, and losers of large-scale wars.
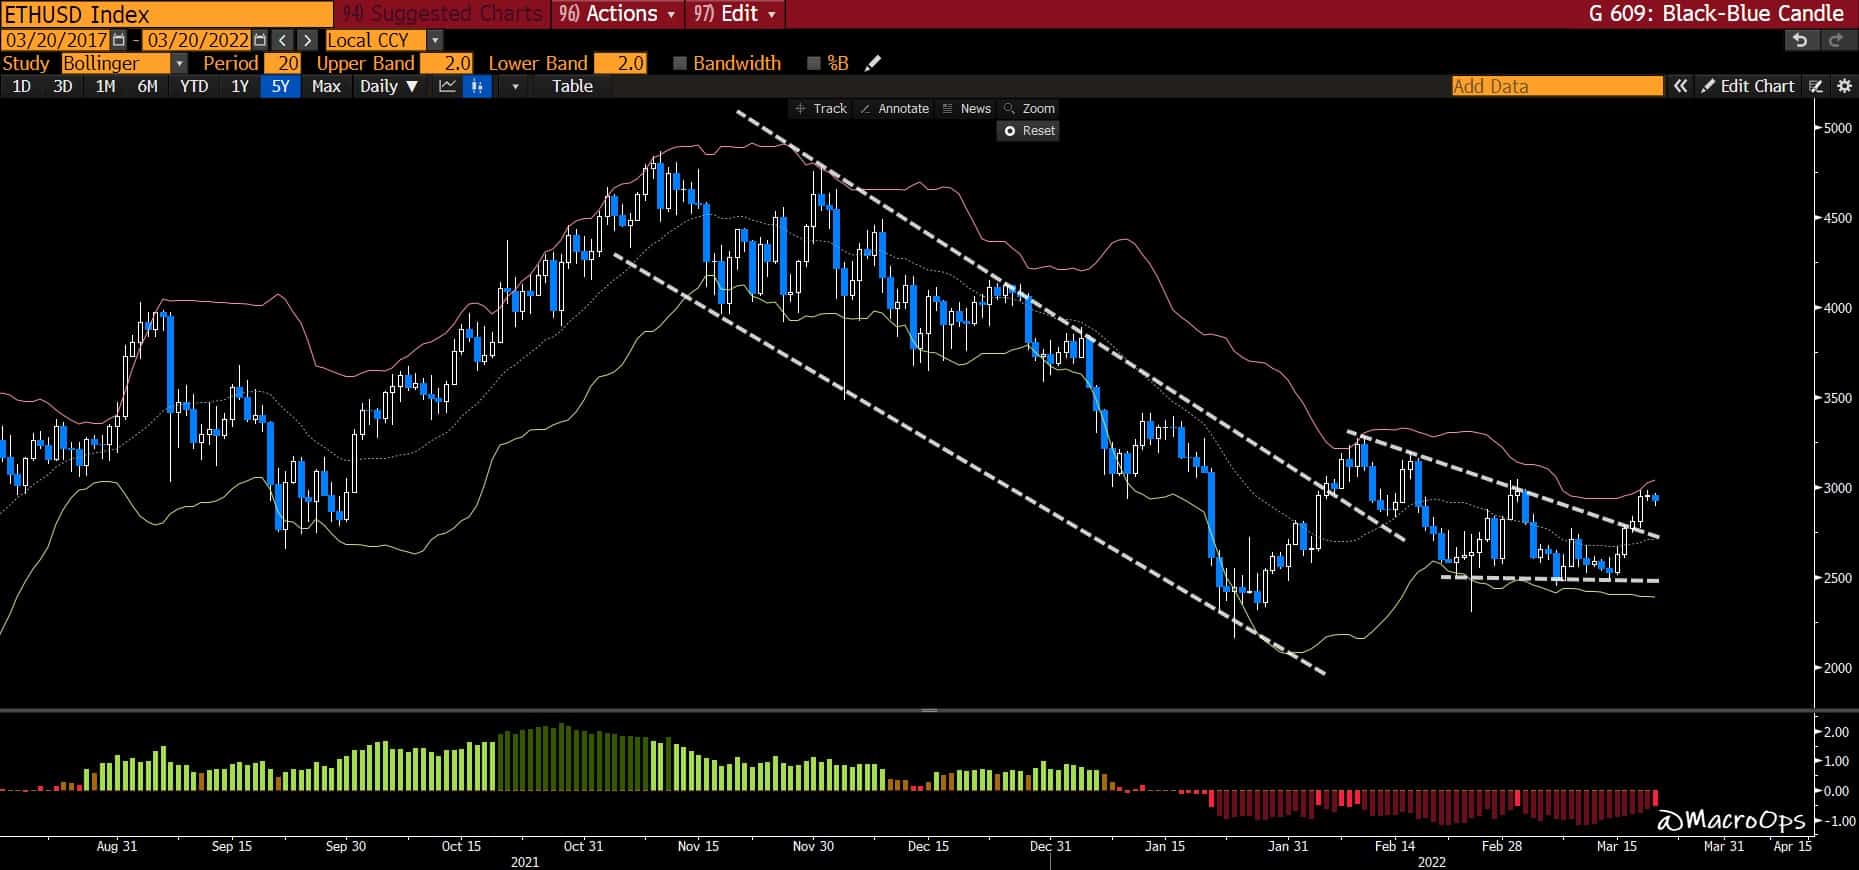
- I pointed out the major compression in bitcoin last week. We’re long BTCUSD and will add if we get a breakout from its range. ETH has been showing better relative strength lately, though. Here are the technicals we’re tracking. The chart is looking quite bullish to me.
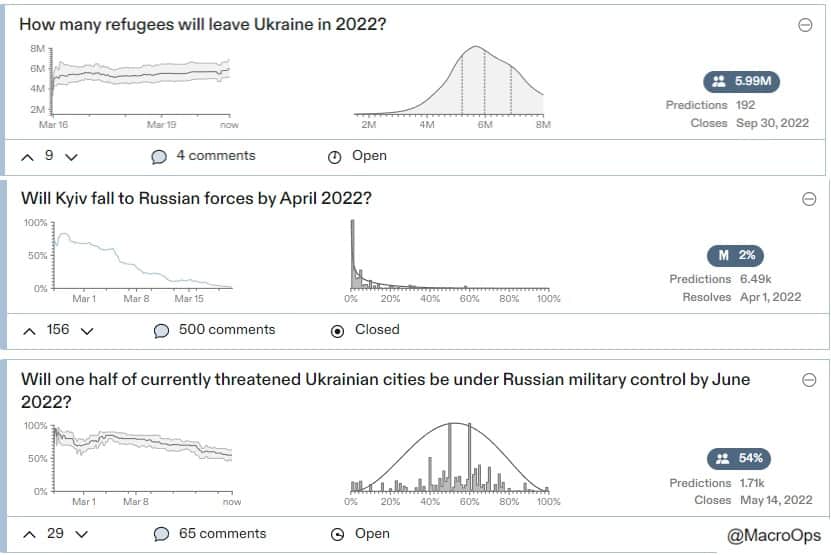
- You can track the latest prediction markets on the Ukraine-Russia conflict here. Current predictions estimate roughly 6m refugees out of Ukraine by year’s end and a 54% probability that Russia will control half of the Ukrainian cities currently under siege, by June.
Thanks for reading.
Stay frosty and keep your head on a swivel.