It goes to show that when you are confused it is best to do nothing. You are just going for a random walk and that is when you are liable to get mugged because you don’t have staying power. You are likely to be faked out by some stray fluctuation because you lack the courage of your convictions. ~ George Soros
Good morning!
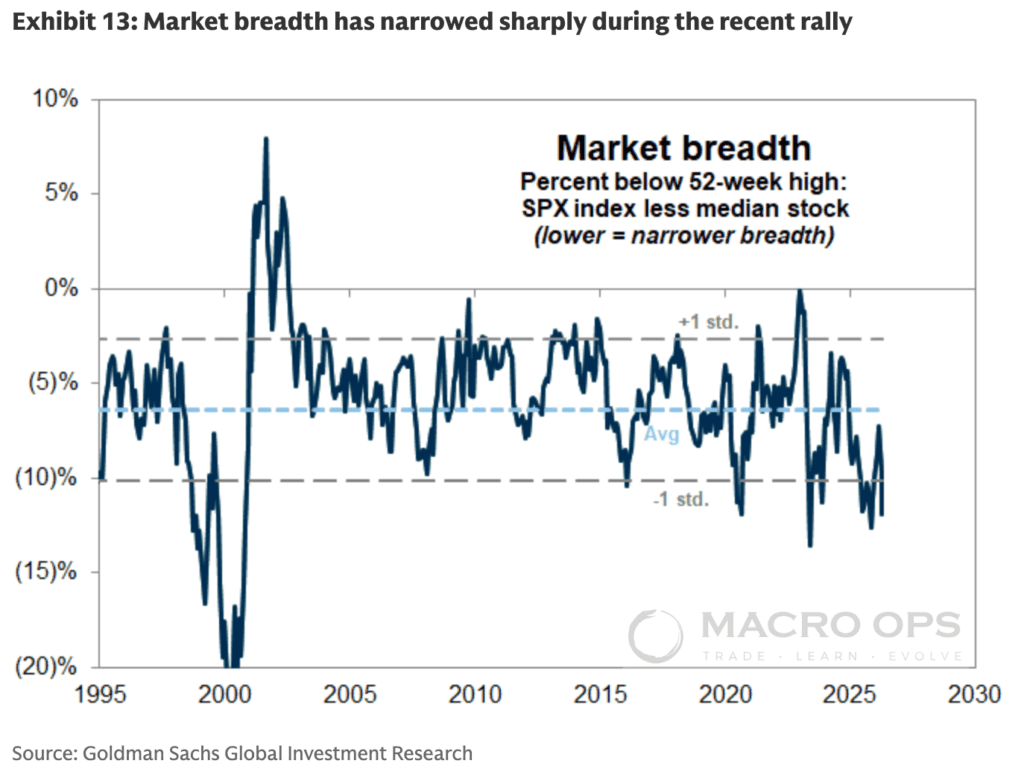
In this week’s Dirty Dozen [CHART PACK] we look at the short-term SPX technicals, building signs of bearish sentiment, Omicron numbers in the UK and SA, excessive pessimism in bonds suggesting strong forward returns, bearish oil indicators, and overbought oats setting up for a short, plus more…
***click charts to enlarge***
- The market will likely open up to weakness this week. We may see it retest the November lows before gearing up for its next leg up. The 4,587 is the Dec monthly open price and will act as an attractor going into the end of the month.

- Short-term sentiment is setting up for a potential bottom soon though. @Macrocharts shared the following:
“Everyone has a foot out the door.
Options Traders are *again* among the most negative in history.
Most signals led to market bottoms or rally extensions.
The story of 2021: a historic rally fueled by doubt, shakeouts & panics.
A textbook Bull Market – get ready for 2022.”

- The Omicron variant and subsequent government responses are likely to drive the narrative this week. The variant has proven to be significantly more contagious. But we’ll need to wait another week or so to see if it causes hospitalizations and deaths to rise in kind or if vaccines and previous infection are enough to keep a lid on this wave…


- So far, the data out of South Africa is promising. The most recent wave already looks to have peaked and hospitalizations and deaths have stayed muted.


- SentimenTrader recently pointed out the excessive bearish sentiment in bonds, which recently hit the bottom 2% of all readings.

- After past reading, bonds have shown a strong bullish bias over the following months.

- Our Yield Indicator continues to diverge lower…

- The relative value case…. Wide USvEU yield spreads make UST’s more attractive to European investors on an FX hedged basis

- Ultras are still in a larger sideways range buy the tape continues to show improving strength.

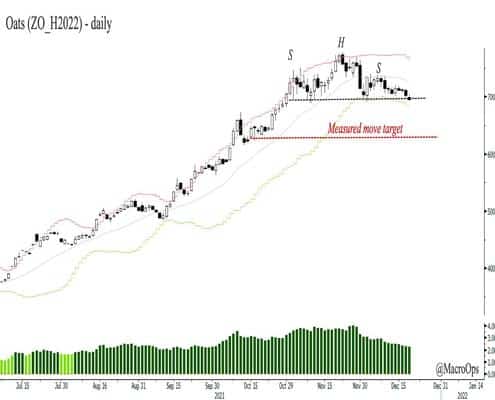
- Oats (March contract) have put in an H&S top. It’s coming off extreme overbought levels, rising over 60% above its 200-day moving average and its SQN climbing over 3.5.

- Small-caps are knocking on their 11-month support level. A break below would signal the start of a broader risk-off period in markets.

- Whether it’s the rising dollar or COVID concerns, oil looks like it’s headed lower over the short term. Brent’s 12-month time spread is leading the way down.

Thanks for reading.
Stay safe out there and keep your head on a swivel.