The Yen is Done Yawning...
“It might seem that if you have an edge, the way to maximize the edge is to trade as big as you can. But that's not the case, because of risk. As a professional gambler or as a trader, you are constantly walking the line between maximizing edge and minimizing your risk of tapping out.” ~ John Bender
Good morning! In this week’s Dirty Dozen [CHART PACK] we look at short-term shakeout risk, bear market indicators, GDP growth trends, breakout failures, Japan and the yen, plus more… Let’s dive in.
***click charts to enlarge***
- Compression regimes lead to expansionary regimes. And the DJIA is coming out of a tight squeeze, with its Bollinger Bandwidth below the 5th percentile.
- And this squeeze resolved last week with a breakout to the downside and a close on its lows...
- Friday marked the 5th straight bear bar. Our Backtester shows that similar occurrences while in a Neutral market regime, show a bias to the downside over the following 10 trading days.
- There are some other signs of weakness worth noting. The lack of follow-through from the breakout in Transports isn’t a great look either. A move to new recent lows would be concerning.
- And of course it’s mid-September which tends to be the weakest part of the year from a seasonality perspective.
This isn’t to say we’re turning bearish. The SPX and Qs are still in a firm uptrend but we could very well see a shakeout this week or next.
- Been seeing variations of this indicator going around, ringing the alarm bells on the increasing risk of a bear market. The below MO Bear Market Risk indicator measures the z-scores of HF positioning, credit market technicals, bond flows, CPI, and consumer sentiment.
- But the above indicator fails to account for the shift in Fed policy and the recent shocks caused by the Delta variant and supply chain issues. While we’re certainly due for a period of higher volatility at some point, growth is still strong and should stay so. And the longer-term trend is still up.
- Just looking at the SPX and NDX doesn’t tell you the full picture of what’s gone on in the broader market over the last few months. Over 55% of small-caps have dropped by more than 20%, and 72% by more than 15%.
- We noted the strong breakout in the Nikkei recently. This move was supported by a major breadth thrust, which historically leads to extended follow-through (h/t SentimenTrader).
- From a valuation perspective, Japan trades at about the middle / lower middle of the pack relative to others and its own historical multiple.
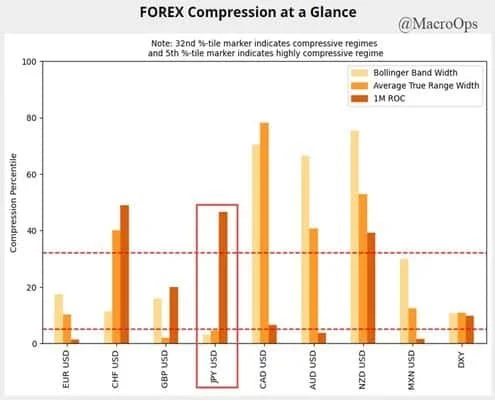
- Speaking of Japan, the yen is showing signs of extreme compression, with both its BB width and ATR below the 5th percentile.
- A compression zone is directionally agnostic. It just raises the odds that a large move is around the corner.
Looking at our FX dashboard, we can see that recent yield spread trends and positioning (both short and long-term) tip the odds in favor of a bullish move for the yen (USDJPY down). Need to wait and see how the tape develops but keep an eye on this one.
 If you enjoy reading these Dirty Dozens each week then please feel free to share them on the Twitters, forward them to a friend, or translate them via smoke signal, etc… Every bit helps us get our name out there. Thanks for reading.Stay safe out there and keep your head on a swivel.


