“In the final analysis, you need to have the courage to hold the position and take the risk. You need to be aware that the world is very sophisticated and always ask yourself: ‘How many people are left to act on this particular idea?’ You have to consider whether the market has already discounted your idea.” ~ Michael Marcus
In this week’s Dirty Dozen [CHART PACK] we cover a new breadth thrust in small-caps and then pore over several charts dissecting the US labor market. Ultimately concluding that the Fed is at risk of falling behind the curve, plus more…
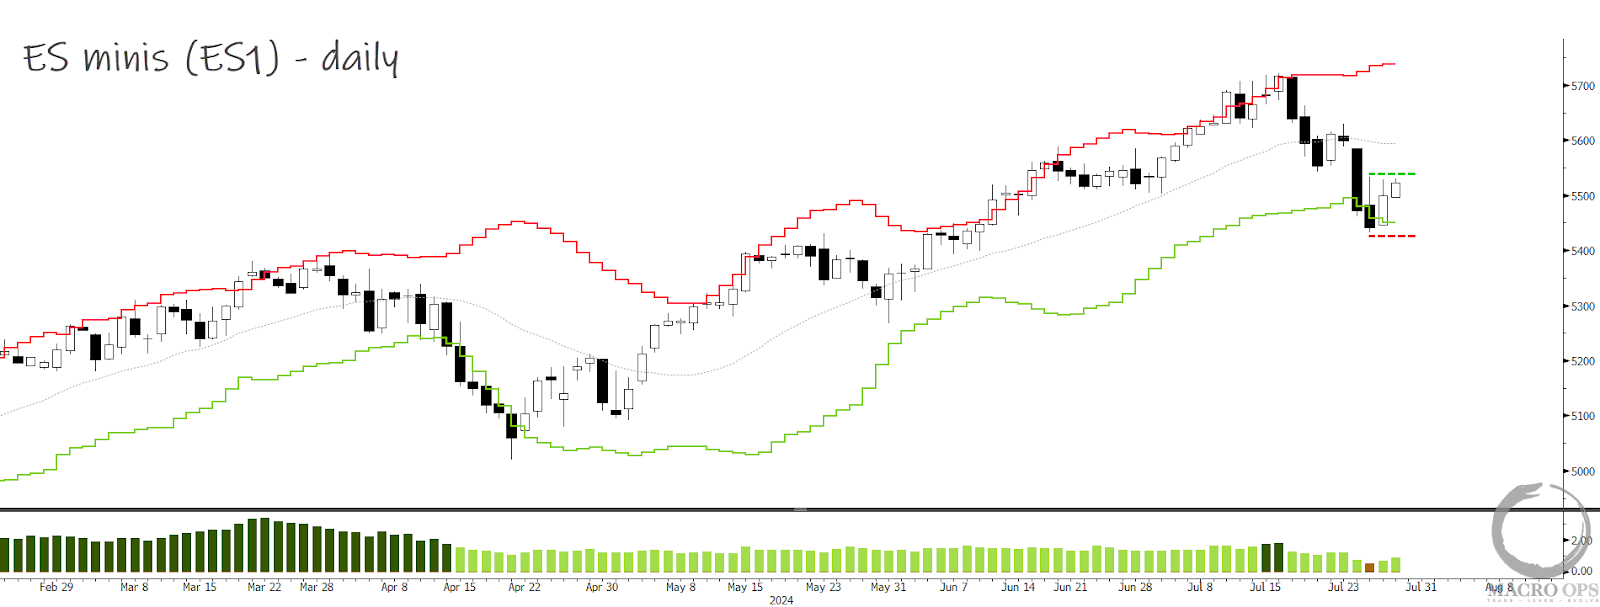
1. People are talking about rotation, and that’s certainly what’s been going on the last few weeks. The SPX closed red last week on its lower daily Bollinger Band. Measures of breadth suggest we’ll see a bounce over the coming days.
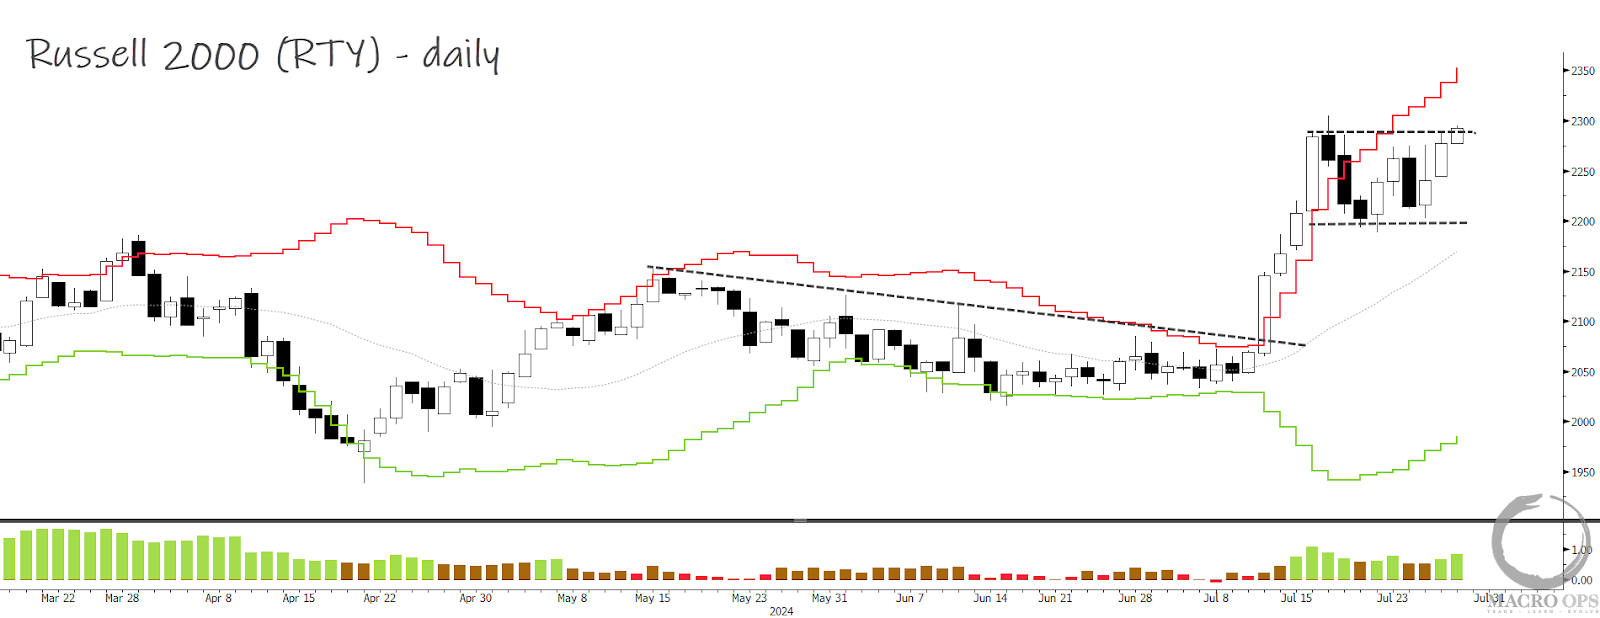
2. The RTY has been consolidating its recent gains in a tight sideways channel, which is a show of strength. A breakout above this range gives one a decent spot to get a position on.
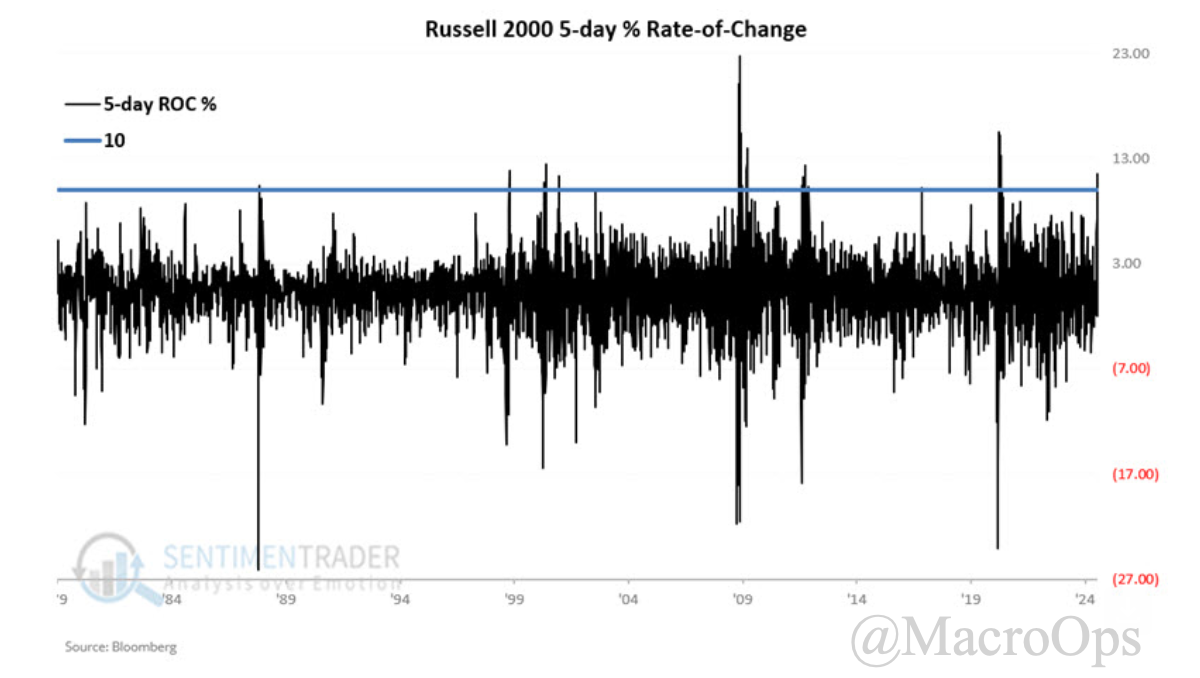
3. SentimenTrader pointed out that RTY saw an unusual 5d ROC thrust, which has only happened a handful of other times over the past 40 years.
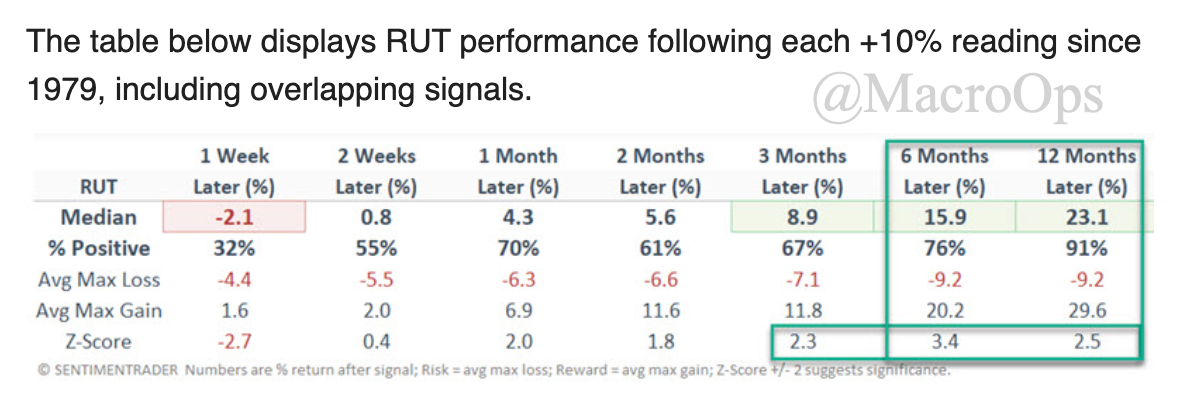
4. This table shows that strong returns tended to follow 3 months and out.
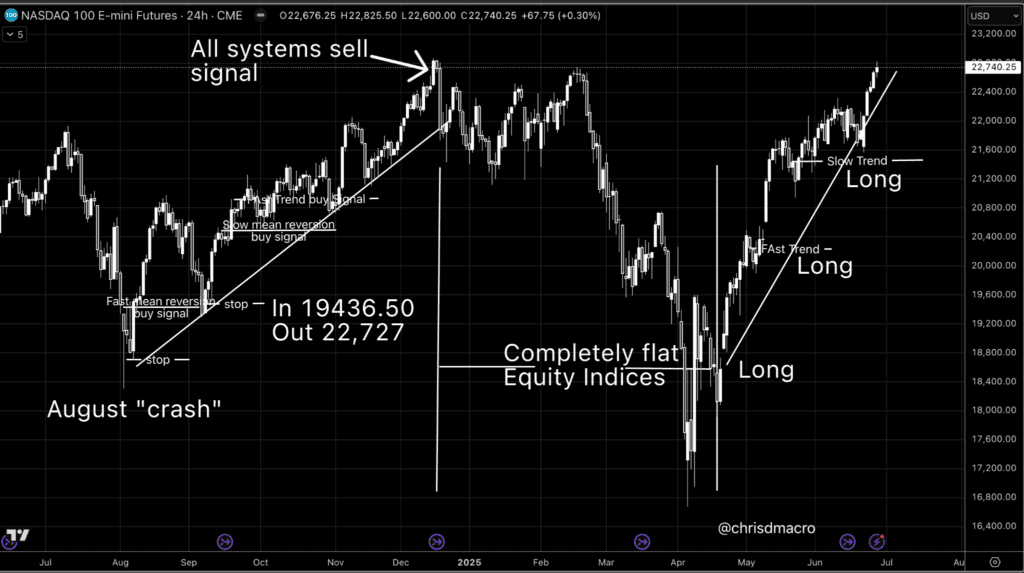
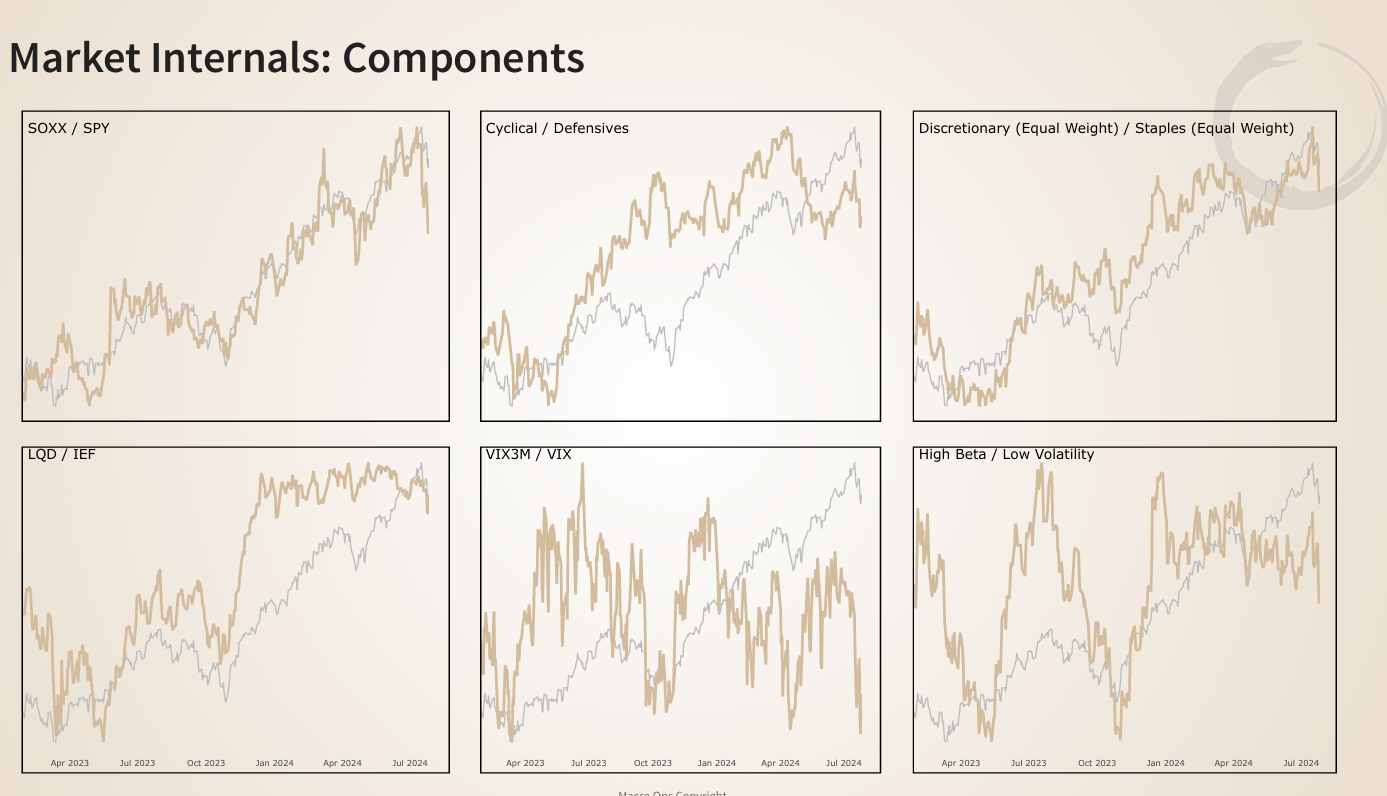
5. We’re not loading up bullish here, and we’re also not bearish. The long-term trend is firmly up but the TF sell signal that was triggered two weeks ago plus these deteriorating internals, are keeping us from being more aggressively long. We’ll wait for clarity before we press the petal again.
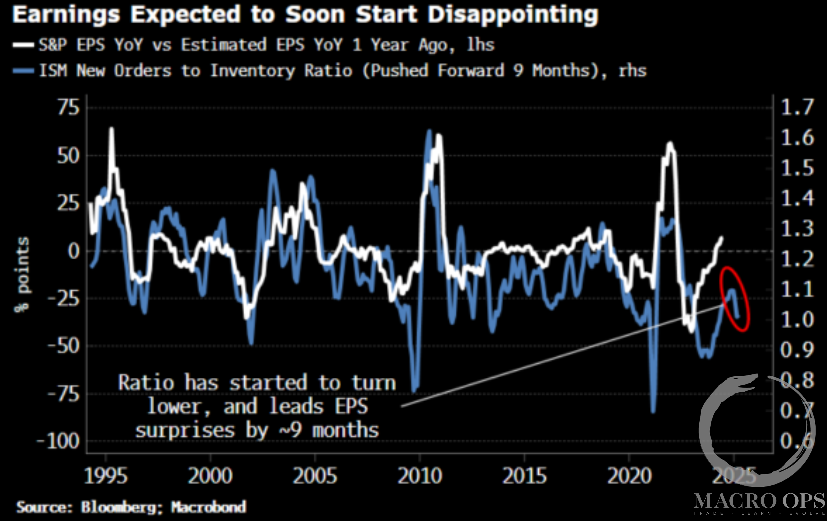
6. BBG’s Simon White notes that we should expect earnings to begin to disappoint… He writes “Large-cap earnings are cyclical and thus track the highly cyclical manufacturing sector, proxied by the ISM. The headline ISM itself is led by the new orders-to-inventory ratio, and that has been turning down. As the chart below shows, that means EPS growth should soon start underperforming where forward EPS said it would be a year ago — in other words, earnings will start to disappoint.”
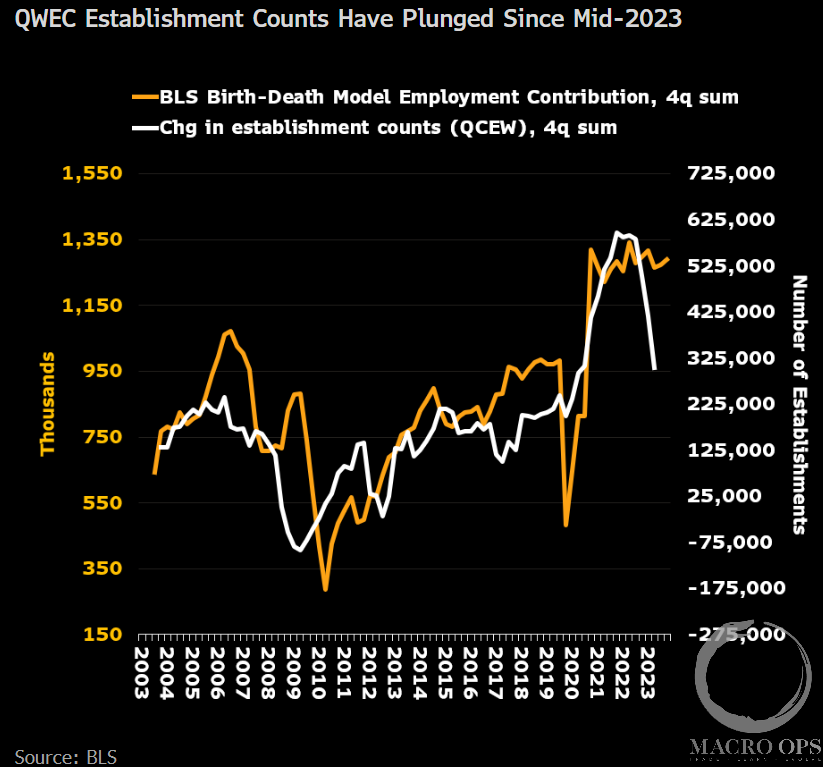
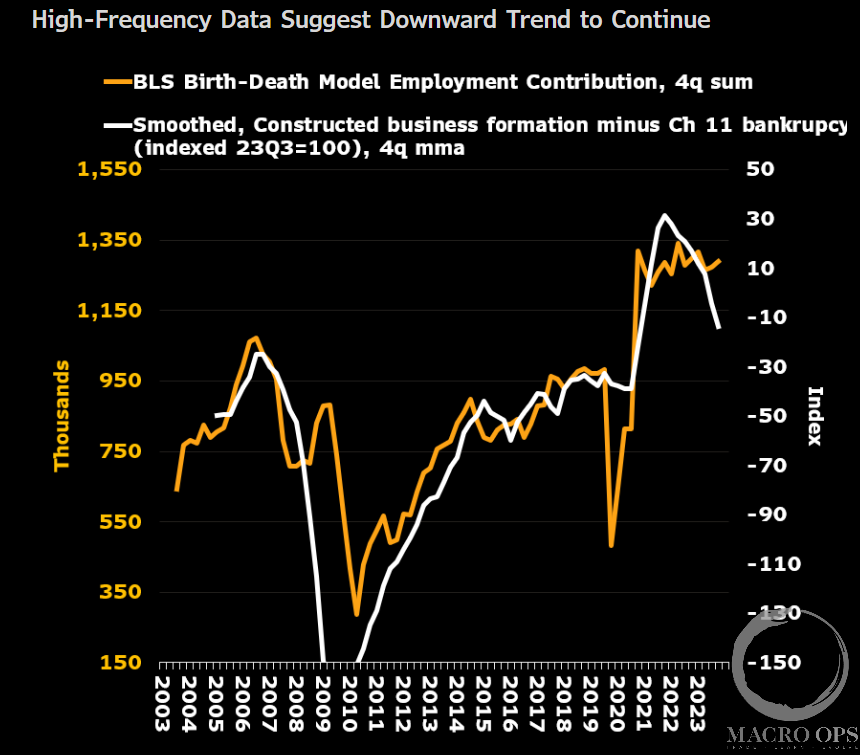
7. For the past two months we’ve been writing about the overstated establishment survey, and how it was hiding a deteriorating labor market. Welp… the BLS’s recent Business Employment Dynamics report confirmed that NFP has been overstating the strength of the jobs market for almost a year (link here).
BBG’s Anna Wong, who’s been all over this trend for months, writes “For a more timely read on firm births and deaths, we rely on two other BLS reports: the Quarterly Census of Employment and Wages (QCEW)… and the Business Employment Dynamics series (BED)… Both cover a substantially broader set of firms than the CES survey, which only covers 670k establishments… The latest QCEW data for 4Q23 show net establishment counts have fallen more sharply than the next birth-death forecasts in the CES-based estimates of nonfarm payrolls. Based on that data, we estimate that nonfarm payrolls as reported by the establishment survey will likely be revised down by 730k for the last three quarters of 2023.
“…We think the labor market hasn’t just approached an inflection point — rather, it’s likely passed it. If the Fed waits until September to cut — still our baseline — it’s probably too late.”
We’re not so bearish, as we think Wong is directionally right but is off on the intensity of the slowdown.
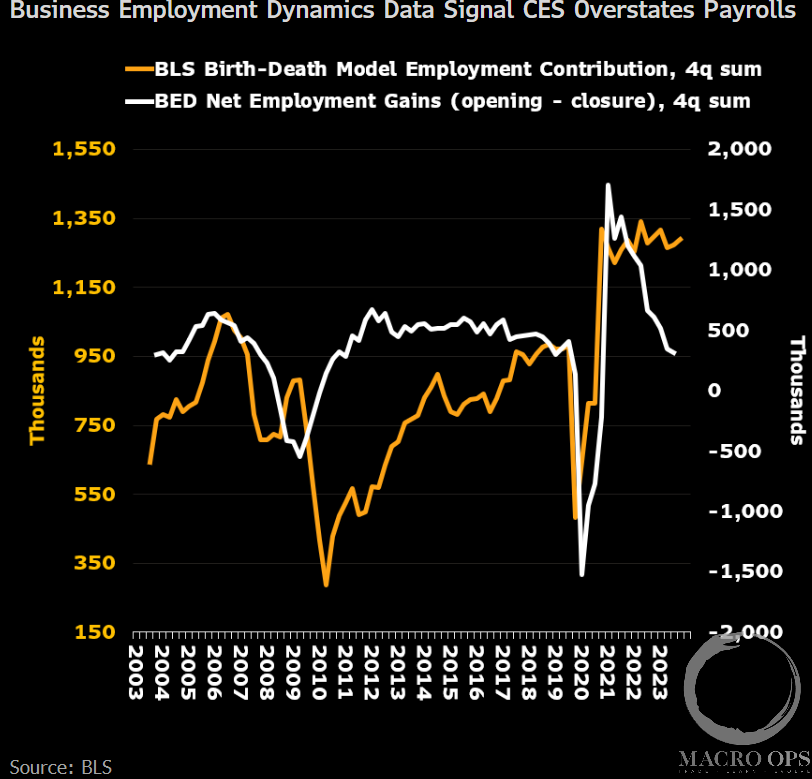
8. More from Wong, “The 4Q23 BED data confirm that assessment. Total net employment gains from firm openings minus closures in the four quarters through 4Q23 were 319k ) vs. A peak 1.7 million in 2Q21). That compared with a 1.3 million net birth-and-death employment contribution in the CES-based nonfarm payrolls calculation for the comparable period.”
9. And, “Looking beyond 2023, we use Chapter 11 bankruptcy and business formation filings to estimate what net employment from firm opening and closures looked like in 1Q24. The results suggest the downtrend continued. Bankruptcy data for 2Q24 isn’t available, but business formation data for 2Q24 has cooled further, and is down 5.3% since 4Q23.”
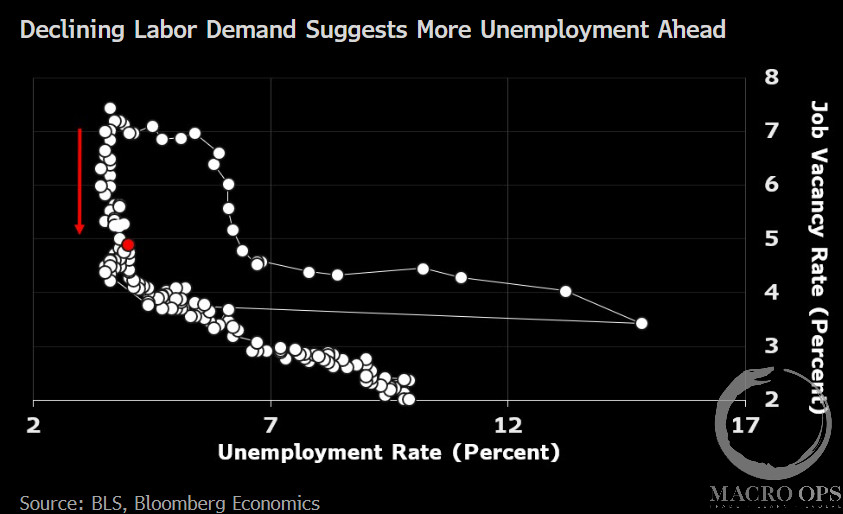
10. Powell remarked during a July 2 panel discussion that “A good way to see it is the Beveridge Curve analysis that everybody talks about and looks at. You know we’ve come straight down the Beveridge Curve, but you’re really getting to that place relative to job openings and hiring rates where the Beveridge Curve is flattened out, which would mean higher unemployment as a result of further declines in job openings.”

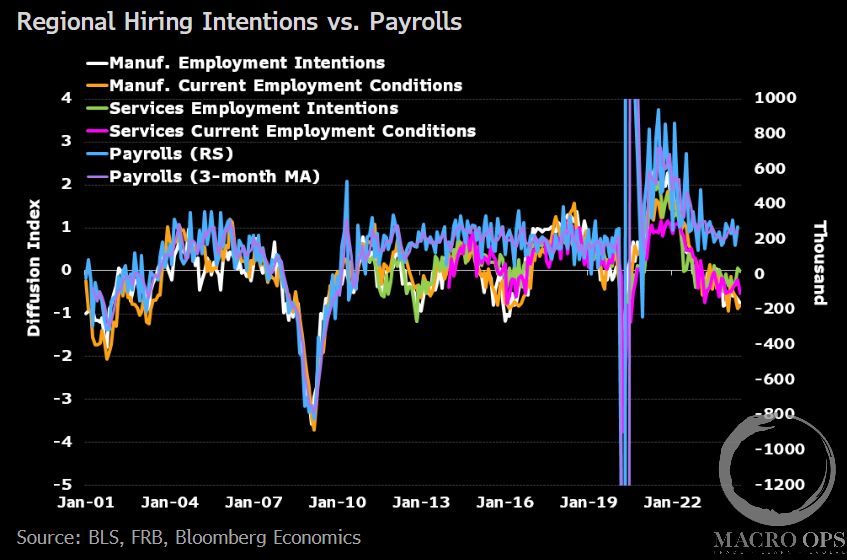
11. Finally, from BBG: “Regional Fed surveys showed measures of current and future employment intentions for services deteriorated in June. On the manufacturing front, current employment remained little changed, while future intentions moved further into negative territory.”
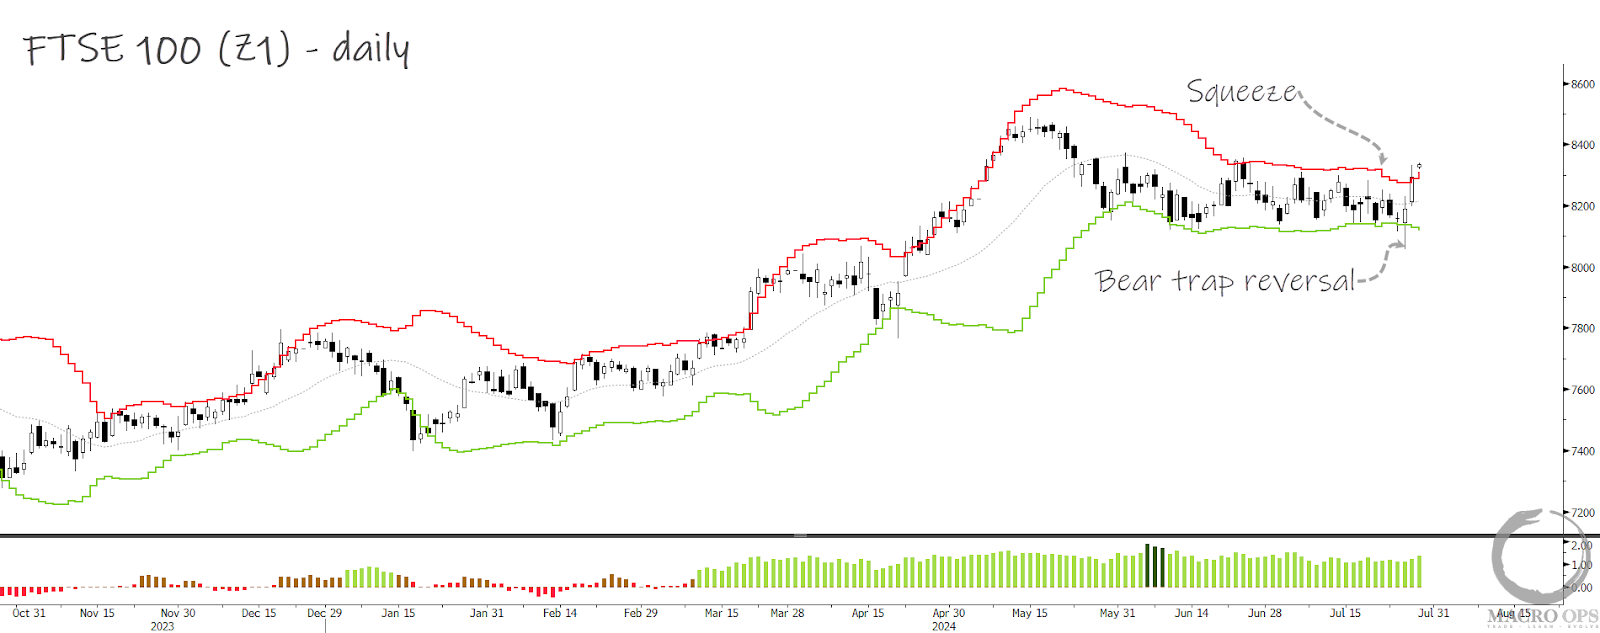
12. Unrelated to the slowdown in the US jobs market, but we like the UK’s FTSE 100 here.
It’s breaking out from a compression regime, following a bear trap reversal on Thursday. I also like it for fundamental reasons, which I’ll be sharing in an upcoming note.
Thanks for reading.