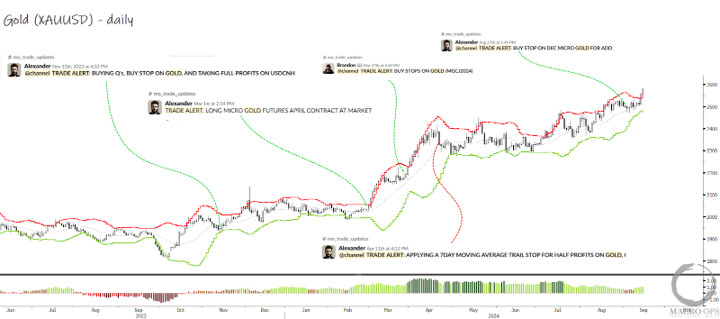
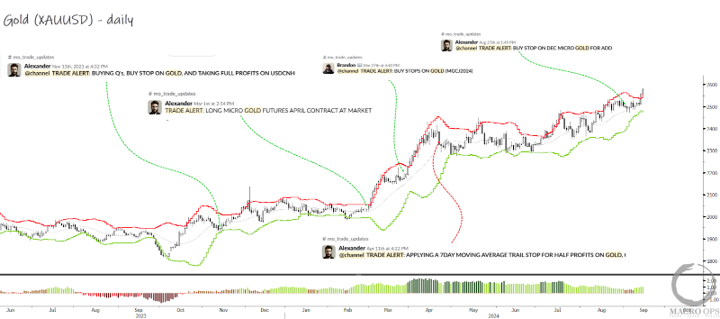
On Thursday, our sitting buy-stop order in gold was hit, adding to our long position for the fourth time since we started this most recent bull campaign in precious metals.
The arrows below show our time-stamped slack alerts to the Collective for both buy orders (green) and profit-taking (red).
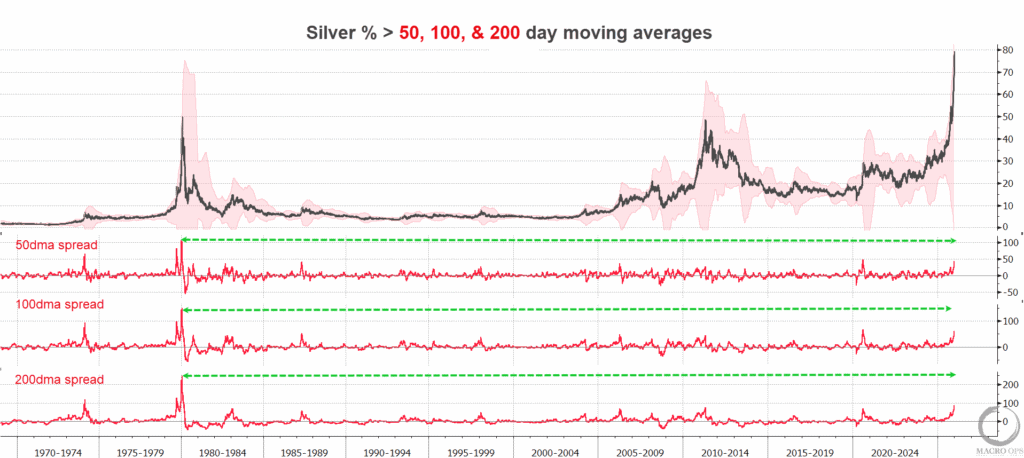
Our book is also quite stuffed with silver and smallcap under-the-radar miners.
Long-time MO readers know all too well that we’re anything but gold bugs. We’re just as willing to plunge short the barbarous relic as we are to long or completely ignore it.
So why then are we currently stuffed through the gills with the stuff?
Good question.
Since it’s been a few months since we last updated the bull thesis, I’ll do a quick run-through today.
For starters, you can read our short primer on how we analyze the fundamentals of precious metals here.
Here’s the TL;DR summary for those of you in a hurry.
- Over the long run (and this is one of Ray Dalio’s “principles” regarding gold, as well) the price of gold will approximate the total amount of money in circulation divided by the size of the gold stock.
- And it’s not inflation or deflation that is the principal driver of gold, but the expected real return from other long-term financial assets, particular equities.
Precious metals are essentially an anti-USD asset bid. So when the expectations over future USD bond and equity returns drop, PMs tend to do very well. Read the primer if you want to understand the mechanics of why that is.
Moving on…
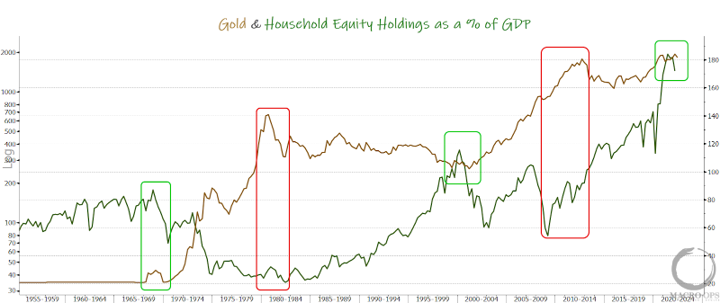
US Household equity holdings as a percentage of GDP are near all-time highs. This is also true if you look at them as a percentage of US assets, instead of GDP.
What does this mean?
It means that US investors are maxed out on stock holdings. Therefore, they are holding a much smaller relative amount of everything else (ie, bonds, commodities, etc…).
We can see a clear inverse relationship on the chart below. When equity holdings (green line) peak and roll over it correlates with a bottom in gold (tan line), and vice versa.
Another way to examine this is by examining expected forward returns. Remember, the expectation of future USD asset returns drives the attractiveness or non-attractiveness of gold/silver.
Since investors have loaded their boats with stocks, it means that valuations are very high. And when valuations are high, expected future returns are low.
The chart below shows the inverse relationship between expected 10-year forward returns for the S&P 500 (green line) and gold (tan line).
The S&P’s current expected forward returns are the lowest on record.
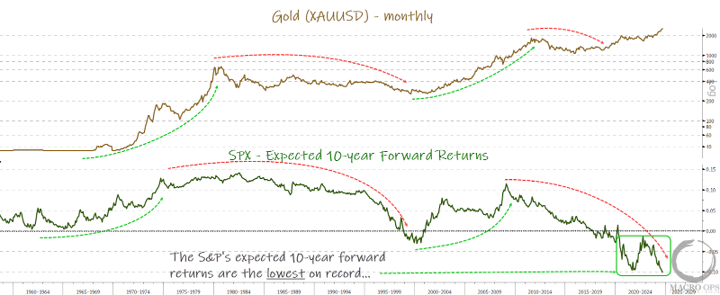
Also, notice, similar to the equity holdings chart, that the major bull legs in gold don’t typically start until after expected forward returns begin to rise, implying a fall in equity prices.
This makes gold’s recent 12-month bull trend somewhat unique. Since it hasn’t been accompanied by a rollover in equity holdings or a drop in expected forward returns.
It also hasn’t been accompanied by large retail participation. Like, at all.
The below chart shows total gold ETF holdings in green. We can see that this line tends to follow the price of gold. When gold trends up, investors follow suit and buy more gold ETFs.
However, ETF holdings have been trending lower for the past four years. Meanwhile, gold is hitting new all-time highs.
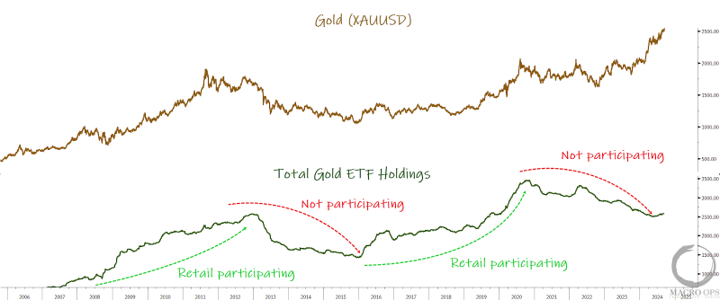
Also, news mentions and social media chatter about gold (white bars) have been trending lower for the past four years.
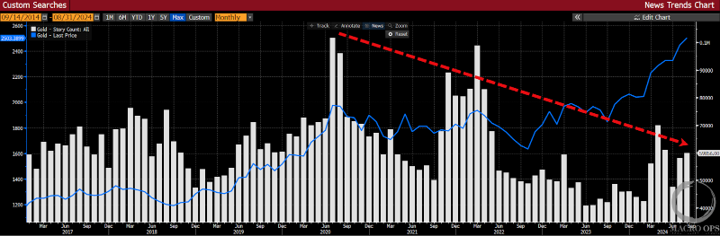
This is not the picture of a euphoric bull market. This isn’t even the picture of middling interest. Gold is hitting all-time highs, and nobody gives a rat’s ass.
This excites us at MO to no end. To understand why, read my thread on how we think about market sentiment and narratives (link here).
But a question you may be asking yourself is, if US investors aren’t buying gold right now, then who’s driving the price higher?
The answer to that is central banks.
Since the start of the Russia-Ukraine war and the US’s subsequent aggressive weaponization of the USD, we’ve seen central banks (primarily those less friendly with the West) start to diversify out of USD assets. And that, of course, includes large purchases of gold.
The chart below from the FT is a bit dated, as it’s from the Fall of last year. But it shows the large jump in gold purchases by the PBoC. The final 2023 numbers ended up exceeding those in 22’. According to Reuters, China’s holdings of gold currently stand at $183bn.
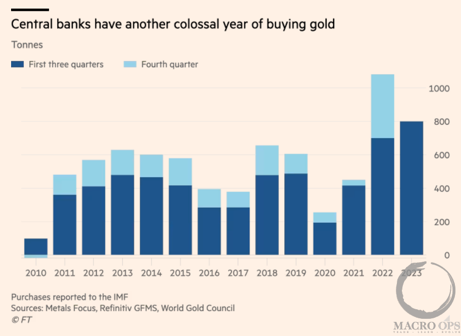
While the PBoC has cooled its pace of buying over the past few months, other central banks from Russia, Turkey, and Poland have stepped up theirs. And the PBoC is expected to resume its buying later this year.
So what does this all tell us, then?
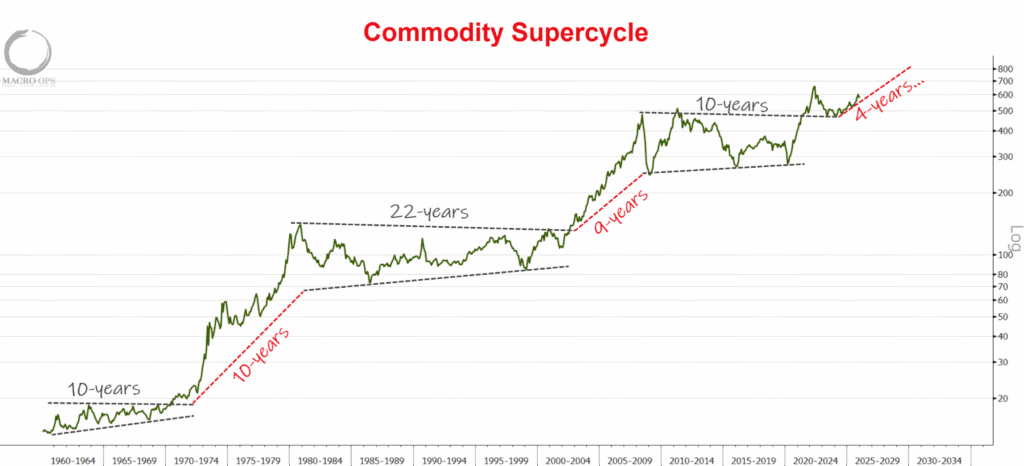
It tells us that this is not only a unique bull cycle in gold but that the official bull market has yet to truly begin.
Investors are too busy chasing stupidly priced AI stocks and other popular bloated whales to care. Meanwhile, gold keeps trucking on to new highs with zero fanfare. All thanks to the growing and persistent bid from foreign central banks.
The trends in precious metals are going to get silly once investors start to wake up and realize that buying $500bn+ market cap stocks at 40x sales may not be the best long-term strategy.
Until then, we’ll continue to zig when everyone else zags.
Have a golden weekend.
Your Macro Operator,
Alex