Secular Semiconductor Bull…
What winning traders share, however, is that they all understand that losing is part of the game, and they all have learned how to lose. ~ Jim Paul
Good morning! In this week’s Dirty Dozen [CHART PACK] we comment on ridiculous implied expectations, the increasing correlation between Nasdaq Composite returns and retail sales, and the market’s over-reliance on easy liquidity… We then turn to commodity returns during rate-hike cycles, copper mine supply near peak, and confirming evidence of our secular semi bull thesis, plus more…
- Inflation impacting politics and politics driving policy… large outflows from cash and into equities… largest flows into EM stocks since Mar 21’. The latest Flow Show highlights from BofA.

- I missed this earlier but Bridgewater put out a report last month titled “Is The Air Coming Out Of The Bubbles?” (link here) with some great charts. The one below shows the share of Market Cap that needs to grow fast in order to earn a normal return (blue line) while the red line shows what actually happens historically (red line).
BW notes “The flip side is that if Amazon, Alphabet, Facebook, Microsoft, Salesforce, Netflix, etc., were priced like today’s companies a decade ago, their rapid growth would have generated returns of about 10% instead of the 30% annual returns they produced.”

- This one shows the increasing correlation between Nasdaq returns and retail sales with the two showing their highest overlap since the Dot Com days.

- This increased linkage between stock market returns and the real economy is troublesome for a number of reasons. One of them being the fact that the share of equities dependent on easy liquidity is at its highest level since 2000… This isn’t reassuring seeing how we’ve already crossed peak liquidity and the distribution of outcomes significantly skews to tighter conditions ahead.

- Russia will likely strike/invade Ukraine within the coming weeks. They will do so because Putin is paranoid about NATO’s encroaching sphere of control. He wants to maintain a buffer zone hence the annexation of Crimea and the coming strike in Ukraine. The charts below from the FT illustrate the growing source of Russia’s uneasiness.


- “In 39 of the past 50 years (a 78% rate), the Euro currency (or European trade-weighted proxy prior to 2002) has experienced an annual top or bottom in January (or early in February)” points out Peter Brandt in a recent post (link here).

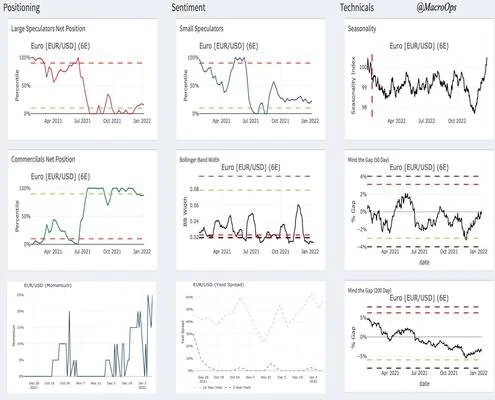
- Our FX summary dashboard shows Specs are crowded short, EURUSD’s Bollinger Bands are coming out of a major squeeze, momentum has flipped positive as well as its 10yr yield oscillator, and the pair is historically stretched below its 200-day moving average.
Our bet is January marks a bottom in EURUSD for the year.

- A top in USD would be another additional tailwind for commodities. Speaking of, The commodity/cyclical heavy UK ETF (EWU) just broke out from an 8-month trading range.

- This isn’t surprising as commodities tend to perform well in the “hiking” phase of the cycle.
GS writes: “As we have long argued, commodities are driven by demand levels while financial markets are driven by demand growth rates. This distinction is critical as early rate hikes impact growth rates, and hence financial market valuations, but not today’s demand levels.
“Scarcity pricing in commodities is created when the level of demand exceeds the level of supply. It has nothing to do with current or expected growth rates or discount factors that are the most sensitive to rate hikes. In fact, scarcity pricing of commodities can persist even if demand is declining as long as the demand level exceeds the supply level. As a result, commodities are ‘spot’ assets that must clear physical supply and demand, and you cannot ‘stretch’ imbalances into the future with changes in forward expectations. In contrast, financial markets are ‘anticipatory’ assets, almost entirely driven by expectations…”

- GS notes that copper is closer to global peak supply than at any other point over the last two decades.

- While OPEC spare capacity is expected to continue its decline…

- On an unrelated note, TSM reported earnings this past week. They beat both top and bottom-line estimates. The stock is breaking out from its year-long consolidation. Management guided for accelerating high 20s growth and long-term CAGR of 15-20%. They raised CAPEX guidance to $40-44bn (previously the high-end estimates topped out at $40bn). This is further evidence of our secular semiconductor bull thesis (link here).
![]() Thanks for reading.Stay safe out there and keep your head on a swivel.
Thanks for reading.Stay safe out there and keep your head on a swivel.


