Bitcoin’s Share of Liquid Markets [DIRTY DOZEN]
The characteristic feature of the loser is to bemoan, in general terms, mankind’s flaws, biases, contradictions, and irrationality—without exploiting them for fun and profit. ~ Nassim Taleb, “The Bed of Procrustes”
Good morning!In this week’s Dirty Dozen [CHART PACK] we look at bitcoin’s share of global liquid markets before diving into Q3 earnings season and consensus expectations. We then cover narrowing breadth, neutral positioning, steeping yield curves and small-caps, and driving computers, plus more…Let’s dive in.
***click charts to enlarge***
- We got the breakout through the key 13k level in Bitcoin last week. The last bitcoin “bubble” that culminated in the Dec 2017’ blowoff top was driven entirely by retail. This next one will be driven by institutions in search of alternatives in a negative real-rate world. This great chart from @TeddyVallee shows that BTC’s share global liquid markets is still a rounding error…
Here’s a clip from a note put out last week by JP Morgan (h/t Dan Tapiero).
“Wealth is mostly stored via gold bars and coins the stock of which excluding those held by central banks amounts to 42600 tonnes or $2.6tr including gold ETFs. Mechanically, the market cap of bitcoin would have to rise 10 times from here to match the total private sector investment to gold via ETFs or bars and coins. Even a modest crowding out of gold as an ‘alternative’ currency over the longer-term would imply doubling or tripling of the bitcoin price from here.”
- Q3 earnings season is upon us! Below are next week’s most anticipated earnings releases via Earnings Whispers.
- Consensus estimates have Q3 earnings growth coming in at -16.7%. That expectations bar is probably low enough for this market to clear.
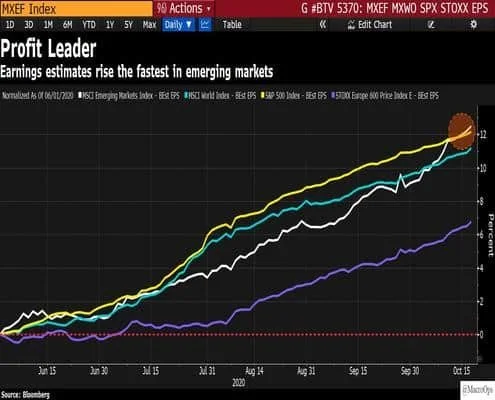
- Speaking of earnings… EM earning estimates are rising fast (white line below).
- Out of all the EMs, I like Mexico the best. They’re going to benefit from the secular trend of deglobalization and the reshoring of US manufacturing out of asia. They have great demographics and will gain from being the close neighbor to a country that has a lot of capacity for fiscal stimulus and the willingness to use it (the US). The below chart is a monthly.
- The market has been pricing in the reflation trade on the idea that Biden and the Dems sweep. The chart below shows Biden’s PredictIt Odds and the 2s/30s UST curve steepening.
- Polls and betting markets support this idea.
- “Will we see a shift from deflation/disinflation to #inflation? Big surges in the money supply, shown below, generally lead to higher #inflation (except for in the mid-2000s), a catalyst for the relative out-performance of value vs. growth and #commodities vs. #stocks.” via @TimmerFidelity
- The Russell 2k is the best performing major US index over the last three months. “According to the 15-month leading indication from the yield curve, the bottom for small cap underperformance is due at the end of this year.” via @McClellanOsc
- This is a great chart from Kailash Capital which shows the percent of stocks beating the SPX over the last 12-months (h/t @TihoBrkan).
- DB’s Consolidated Equity Positioning indicator is finally back to neutral after a long-time spent in negative territory.
- Cars are turning into super computers on wheels. The chart below shows the lines of code per car model from Morgan Stanley. Buy Micron (MU).


