By definition, what works cannot be irrational; about every single person I know who has chronically failed in business shares that mental block, the failure to realize that if something stupid works (and makes money), it cannot be stupid.
~ Nassim Taleb, “Skin in the Game”
Good morning!
In this week’s Dirty Dozen [CHART PACK] we look at monthly charts for SPX, USDCAD, and BTCUSD… We then discuss the bearish setup in AAPL, the bullish setup in a large gunmaker, the VIX spread suggesting we’re at a short-term bottom, the latest election odds, unrealistic pension targets, and more…
Let’s dive in.
***click charts to enlarge***
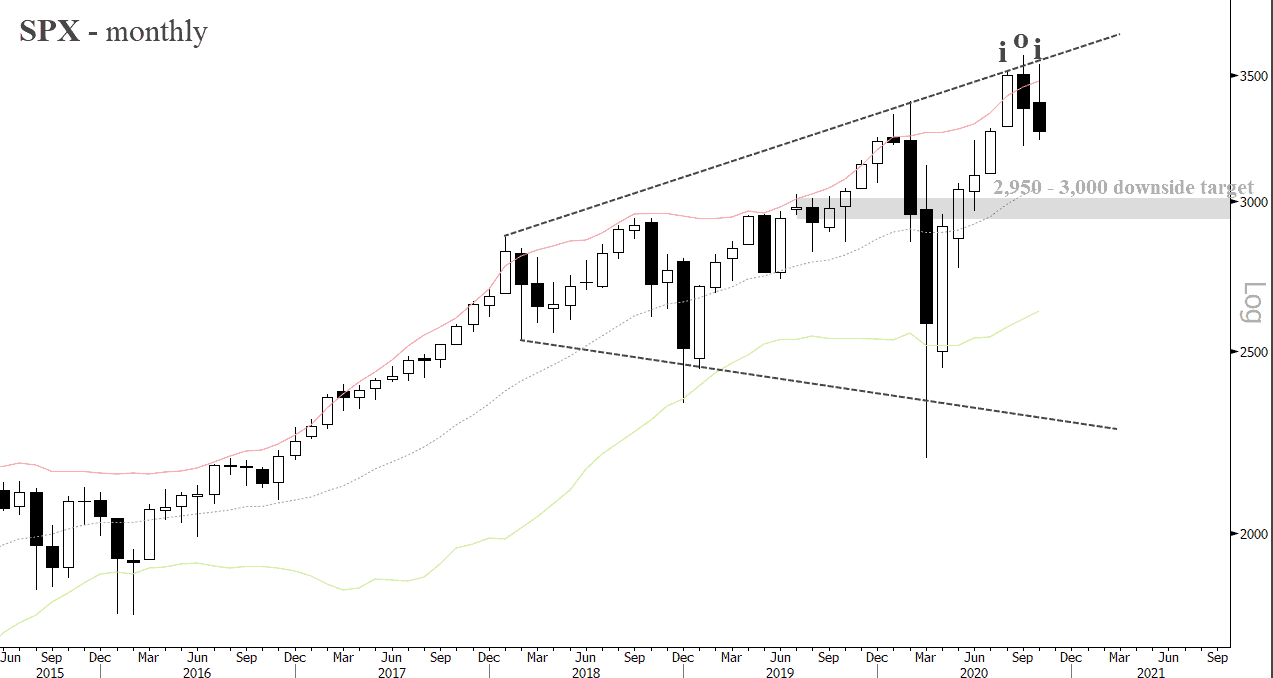
- A new month brings new monthly charts… And the setup on the SPX going into the end of the year is an interesting one. We have an ioi (inside-outside-inside) pattern on the monthly chart. This is a breakout setup. And while we should generally be agnostic about which direction this pattern will break, the bearish October bar that closed near its lows tilts the odds in favor of a move lower. The 2,950-3,000 level is the next obvious point of support on the chart.
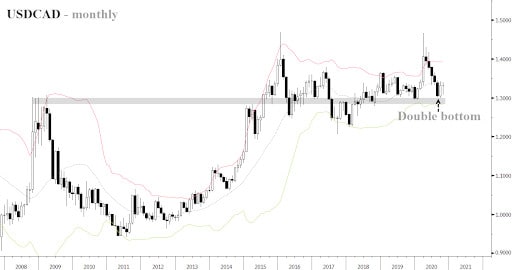
- Another wave of COVID and lockdowns is going to put the pinch on oil demand. Canada being a large exporter of the stuff, sees its currency strengthen in times of rising oil prices and vice-versa when crude falls. USDCAD put in a monthly double bottom and bounced off support of a multi-year range. Positioning remains crowded in short USD and a catalyst for a pop in the USDCAD would be Republicans keeping control of the Senate (tighter fiscal constraint).
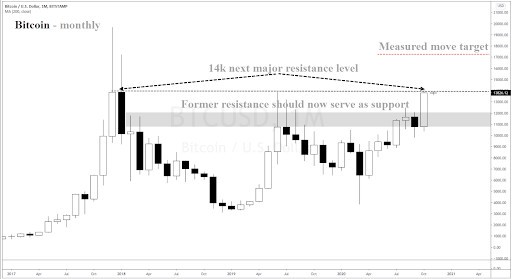
- Bitcoin did not disappoint in October. It closed near its highs for the month which is just shy of its highest monthly close on record. The measured move target for the breakout from its current range is just above 17,000. We may see some short-term weakness as it digests the 14k level of resistance but the bull trend is very strong.
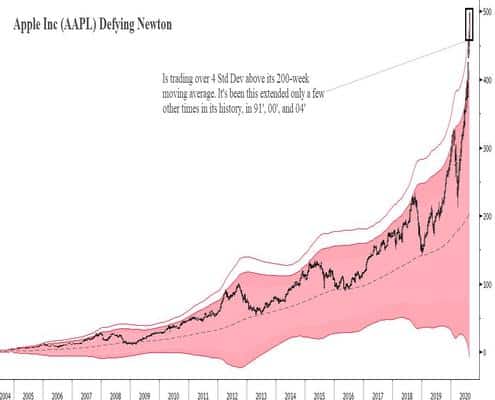
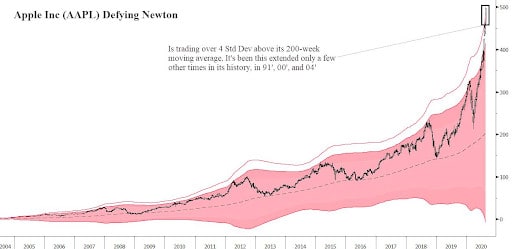
- Back in August, I shared this chart of Apple (AAPL) pointing out its extreme overbought levels. The stock peaked a few weeks later and the chart is setting up for what looks like further downside…
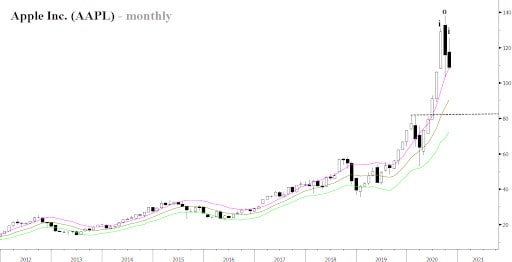
- Similar to the SPX, AAPL has formed an i-o-i pattern on the monthly chart. October was also a bear bar, with the stock closing near its lows for the month. This puts the odds in favor of further follow-through to the downside going into the end of the year.
- This chart from NDR shows the “Elite Eight” which is AMZN, AAPL, MSFT, GOOGL, FB, NFLX, TSLA, and NVDA against NDR’s historic bubble composite. The Elite Eight has risen from around $1trn to $8trn in just eight years. I don’t typically put much weight on these historic analog charts but this is some interesting food for thought.

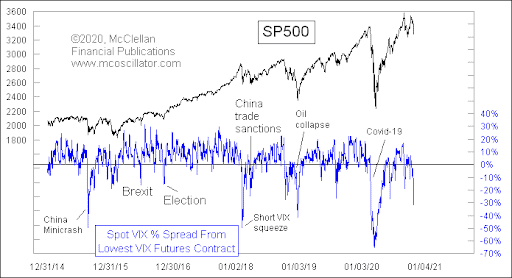
- Tom McClellan shared this chart of the VIX curve spread last week and wrote “VIX Index closed at 40.28 on 10/28, highest since the 40.79 on June 11. But its lowest-priced futures contract is July 21, at 27.42, which results in a big negative spread in this indicator. Such readings are pretty reliable bottom indications.”
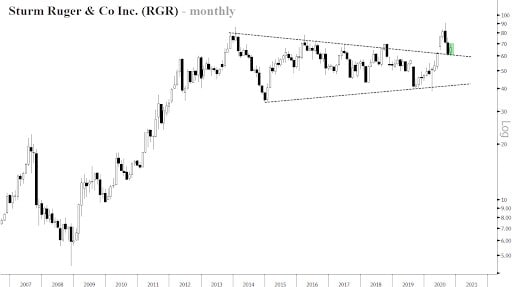
- There are plenty of good looking monthly tapes out there and the gunmaker Sturm, Ruger & Company, Inc. is one of them. The company recently reported Q3 net sales of $145.7 million and diluted earnings of $1.39 per share, compared with net sales of $95.0 million and diluted earnings of 27 cents per share in the third quarter of last year. The stock has broken out of a six-year triangle and has come back to retest support.
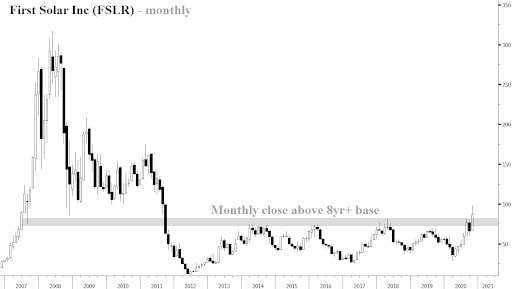
- First Solar Inc (FSLR) just broke out of a large base and put in its highest monthly close in over 8-years.
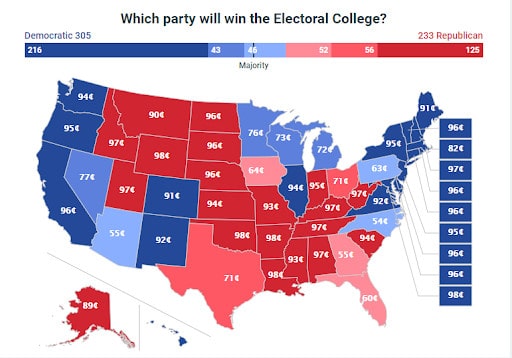
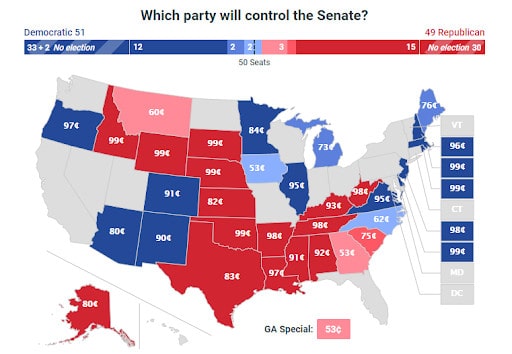
- The latest betting markets odds have Biden as a clear favorite along with Dems eking out a narrow win in the Senate. The Super Forecasters at the Good Judgement Project have set similar odds. While I tend to agree with both and believe Biden and Dems sweep, I think the odds have narrowed materially over the last few weeks. And they’re now not much better than a coin toss.
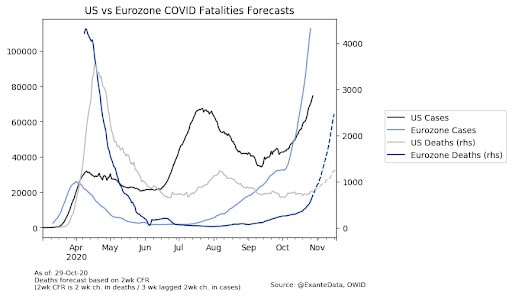
- COVID and government responses are likely going to be front and center in the narrative once we get through this election mess. And the narrative is unlikely to be a positive one with the way the numbers are trending.
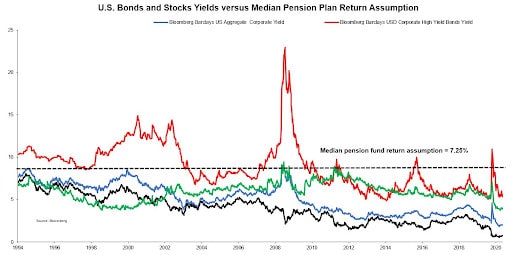
- This is an important chart from Vincent Deluard who wrote in Bloomberg last week:
“U.S. pension funds assume that they will earn 7.25% on their portfolios by mixing assets which yield less than 3% on average. Even if pension funds were to invest solely in the highest-yielding asset (junk bonds), they would still miss their target by about 200 basis points, while taking an amount of risk which would violate their fiduciary duties. Something has got to give: Either asset prices will fall massively to restore normal expected returns (which would trigger an immediate solvency crisis for most pension funds) or pension funds “will die from a thousand cuts” due to an absence of profitable reinvestment opportunities. Either way, most pension plans will fail to deliver their contractual obligations.”
Stay safe out there and keep your head on a swivel.


