
80-20 Industry Primer: Tin
A Pareto Approach to Industry Analysis …
Tin is one of the world’s smallest, most obscure commodity markets at $9B in total value. Because of its small size, it remains off the radar to most traders, investors, and institutions.
Almost all of the things we love about uranium are present in tin. In fact, we believe that tin today is where uranium was in 2016 …
Bombed-out sentiment, a capital-starved industry, marginal production costs higher than the current spot price, and severe supply concentration risk mean that even the slightest supply disruption or demand increase could substantially increase prices.
All the easy tin has already been mined. What’s left is lower grade, higher-risk, more complex, and more expensive to extract. This makes it almost impossible to bring new supply online when most of the industry’s largest producers are reducing output.
The result is a Trifecta Commodity Setup where we can make a ton of money over the next 3-5 years taking advantage of this hidden, under-invested corner of the global commodity market.
But before we dive into the tin thesis, I want to let you know that our Collective Enrollment is now open!
The Collective is our full-kit soup-to-nuts service that provides research, theory, and a killer community of dedicated traders, investors, and fund managers worldwide.
We’ve been told that there’s nothing else like it on the web. If you’d like to tackle markets with our group (whom I should note has been having a great year in markets), just click the button below and sign up. We’ve used these industry primers in other markets, like uranium, to capture big moves in industries with secular supply/demand tailwinds. And we’re doing more of the same in 2024!
As always, don’t hesitate to shoot me any Qs!
Join The Collective
Our goal with this 80-20 Industry Primer is to create a simple but robust global supply and demand model. From this, we can answer the most critical questions surrounding the Tin Thesis:
- Supply: How much supply is there currently, where will new supply come from, and how much will there be in 1-2 years?
- Demand: Who’s currently buying the supply, how much are they buying, and how will their buying habits change over time?
- Price: How do all of these changes affect the price of tin?
We develop deep conviction by doing our own work, stress-testing it against industry experts, and continually updating our models in the face of new evidence.
It’s this conviction that will allow us to hold our position during the inevitable drawdowns along the super cycle. Let’s get after it.
The Supply Side: Primary & Secondary Deep Dive
To understand the future of any commodity industry, it is vital to understand its past. Let’s look at historical tin production.
History of Tin Production & Use Cases
Tin is one of the oldest metals produced, with the first mining operation in Turkey around 3500 B.C. The metal kickstarted the Bronze Age, where societies mixed copper and tin to make bronze for armor, jewelry, and weapons.
Like uranium, we can categorize tin’s history into three main boom periods:
- Period 1: Cars & Cans (1900 – 1930)
- Period 2: Post-War Reconstruction (1945 – 1970)
- Period 3: Electronics & Lead-Free Solders (1990 – 2010)
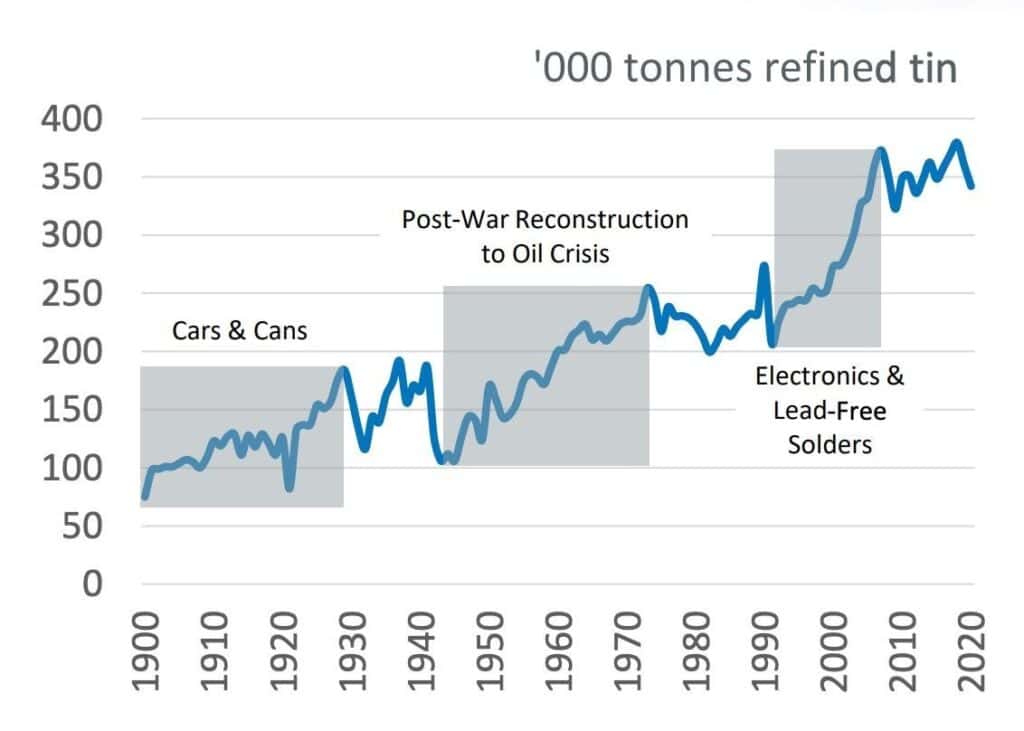
Demand for most industrial metals, like copper, track global GDP growth. Tin, however, grows in fits and starts, relying on consumer or industrial inventions to spur growth.
That brings us to today. There are six main use cases for tin:
- Soldering (49%)
- Chemicals (18%)
- Tinplate (12%)
- Batteries (7%)
- Alloys (5%)
- Other (9%)
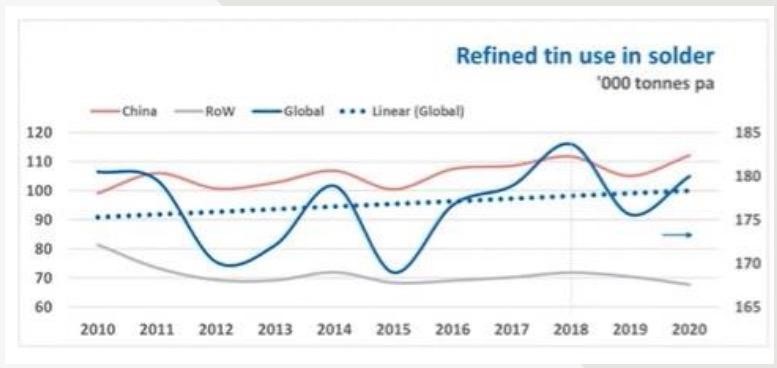
We can think of soldering as the glue that holds all consumer electronics together. The circuit boards in your car, TV, or whatever device you’re reading this on use tin soldering.
As the above graph shows, tin soldering exploded in the early 2000s after the US banned lead as the “glue” for soldering in 2006. Apparently, ingesting lead in large quantities is not suitable for the population.
This lead ban also coincided with massive demand in consumer electronics (hence the spike from 200Kt to 350Kt in annual demand).
There are two reasons why tin is a great consumer electronics glue. First, it is highly conductive and has a low melting point (449.5 F). Second, it’s cheap compared to available substitutes like silver or gold.
Over time, soldering will maintain its ~50% share of tin demand. But we’ll dive deeper into that topic later on.
For now, we can think of tin as entering its fourth phase … The Great Electrification.
Let’s dive into supply.
Primary Supply: Global & Country-Specific
The uranium similarities are everywhere, starting with global supply. Tin supply is highly concentrated. 75% of supply comes from four countries:
- China (31%)
- Indonesia (21%)
- Myanmar (14%)
- Africa (9%)
The remaining 25% of the supply is split between South America (17%) and “Other” (8%).
I know what you’re thinking. These countries read like a Jack Ryan four-season roadmap.
The map below highlights the global supply concentration.
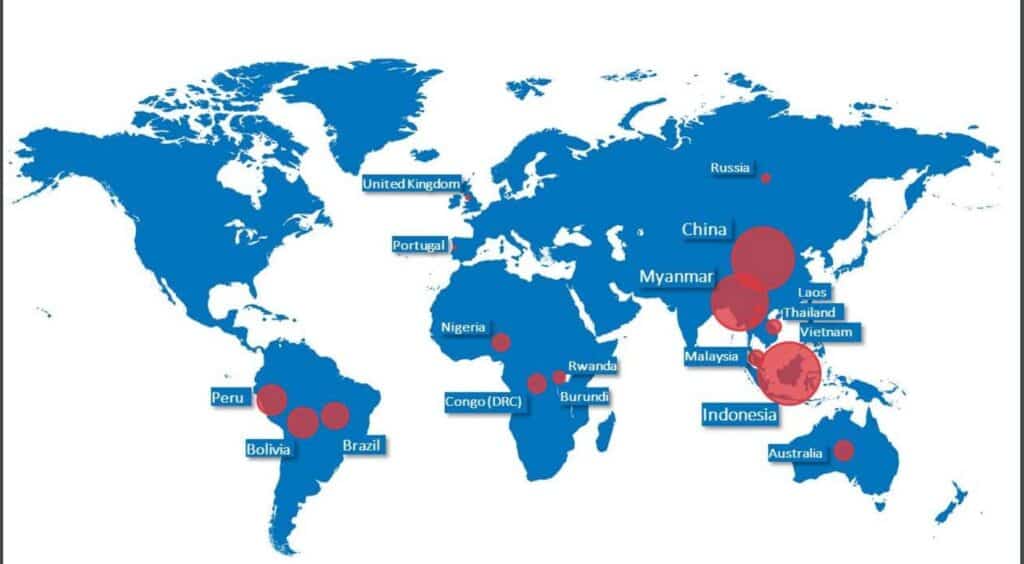
Historically, the same four countries have dominated global supply, and we don’t see that changing anytime soon. The United States, for example, has zero tin mines in operation and no projects in the pipeline. Canada also has no operating tin mines or future projects.
In other words, North America relies on a Quentin Tarantino cast of countries for almost 100% of its supply. But part of that is due to tin’s intrinsic and unique properties.
Unlike other base metals (copper, iron ore, etc.), economically viable tin ore concentrates are restricted to a few geographic areas, which include China, Myanmar, and Indonesia. So even if the US wanted its domestic supply base, it’s out of luck.
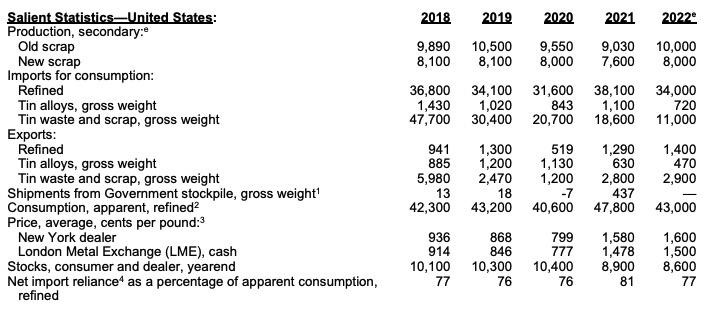
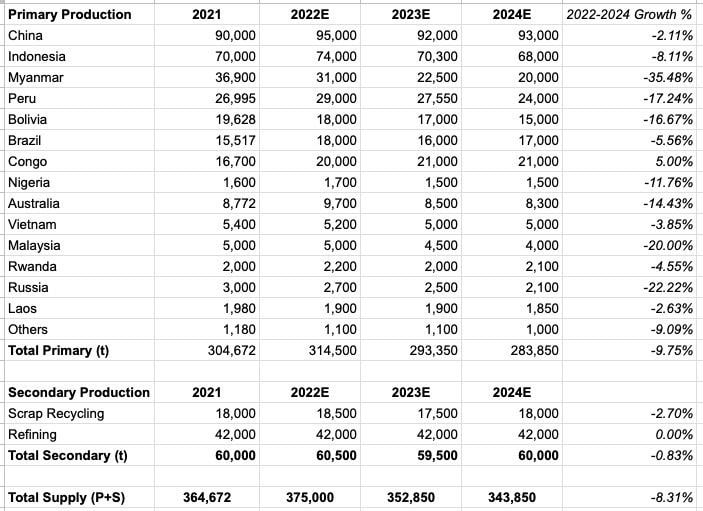
We can create a basic map of country-level supply as of 2021 with 2022 estimates (see below data from the US Geological Survey).
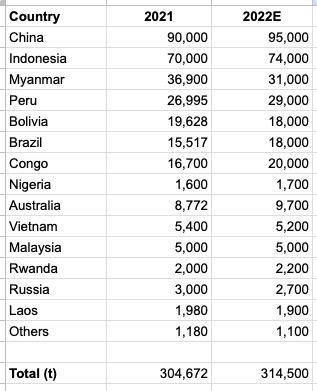
As we’ll explain next, tin has unique mining and extraction techniques that decrease reliability and increase complexity and cost, especially for large producers like Indonesia.
Mining, Extracting, and Processing Tin
There are two primary ways to mine tin. The first and most conventional way is through underground mining. The second and most common way for tin, specifically, is via gravel pumping. I had never heard of gravel pumping before. But I love how Britannica describes the process (emphasis added):
“In this method, the barren overburden is removed, often by draglines or shovels, and high-pressure water jets are used to break up and dislodge the tin-bearing sand.
A submerged gravel pump then sucks up the slurry of mud and water and raises it to a series of sluice boxes, or palongs, which slope downward and have baffles placed at intervals along their length.
As the slurry flows along, the heavier minerals, including cassiterite, fall to the bottom, while the lighter waste material flows over the end of the boxes to tailings dumps. Periodically the flow is stopped and the crude concentrate removed.”
The final two methods are open-pit and offshore dredging. We already know what open-pit mining looks like, so I want to focus on offshore dredging.
Offshore dredging is what it sounds like, and it’s the most jerry-rigged mining method I’ve ever seen. You take a small wooden fishing boat, attach a giant diesel engine to the back, and add a makeshift wooden rig that looks like an oil derrick.
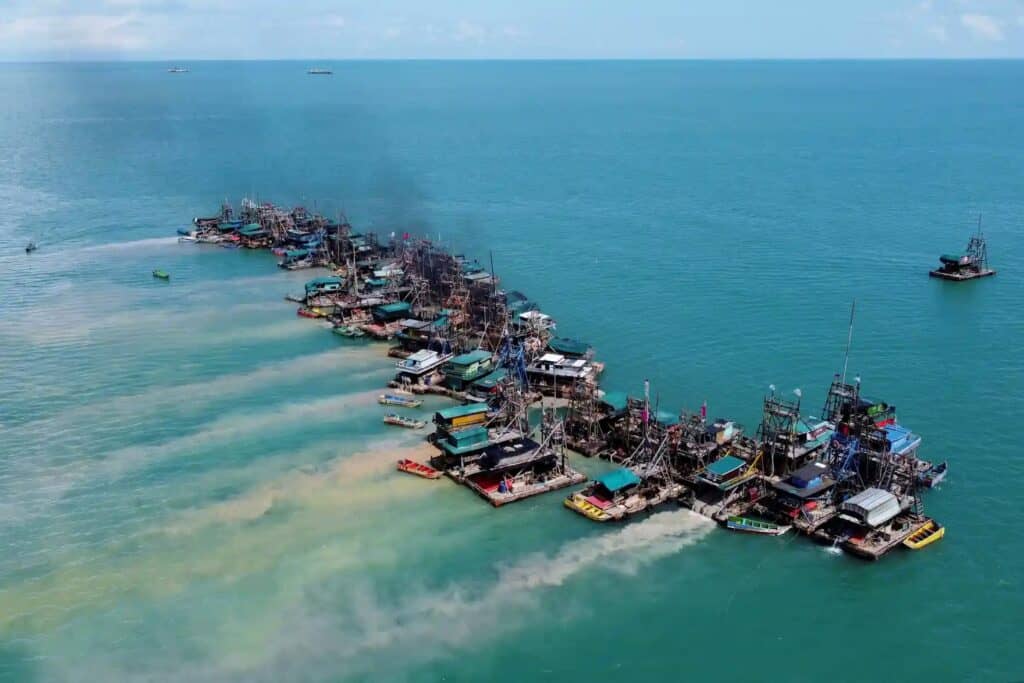
The Guardian did a great piece on offshore dredging, which you can read here.
If you’re thinking, “Wow that doesn’t look stable/safe/reliable/low-cost at all,” you’re right. Unfortunately, for mega-producers like Indonesia, this is their future. All the easy, high-grade tin has been mined onshore. What’s left is this offshore McGeyver experiment.
Next, let’s examine supply on a company and mine level.
Company and Mine Concentration
The top ten largest tin producers account for 75% of global production (furthering the uranium similarities).
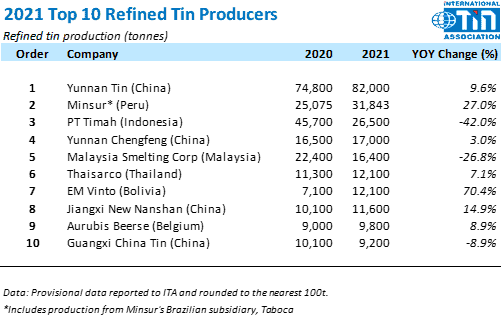
Four of the top ten largest producers are Chinese companies (Yunnan Tin, Yunnan Chengfeng, Jiangxi New Nanshan, and Guangxi China Tin).
But as we’ll see next, the world’s largest producers face significant production challenges from declining grades, reduced reserves, and a spot price that doesn’t incentivize exploration.
Peak Tin: The Best Days Are Behind The World’s Largest Producers
From the 1980s until around 2002, China was the fastest-growing tin producer in the world. Much of that was due to the country’s significant tin discoveries in places like Gejiu. Gejiu had 900,000 tons of tin reserves at its peak, which it didn’t start mining until the 1950s.
However, Gejiu has become the poster child for what’s happening in China. Reserves are depleting at an alarming rate. For example, Gejiu was “tin bankrupt” by 2008, with ~10% of its former 900,000-ton reserve base left.
The result is 20 years of stagnant tin production with the remaining ore being lower-grade and more expensive to extract.
Indonesia, the world’s second-largest producer, faces similar problems. All the easy ore has been mined. What’s left is offshore dredging. PT Timah is a state-owned operator and Indonesia’s largest producer.
Here’s an example of all the easy tin being mined in numbers. In 2006, PT Timah produced 45kt of tin. In 2021, they produced just 26.5Kt.
This happens when you switch from high-grade, lower-cost mining to lower-grade, higher-cost mining in complex areas like offshore dredging.
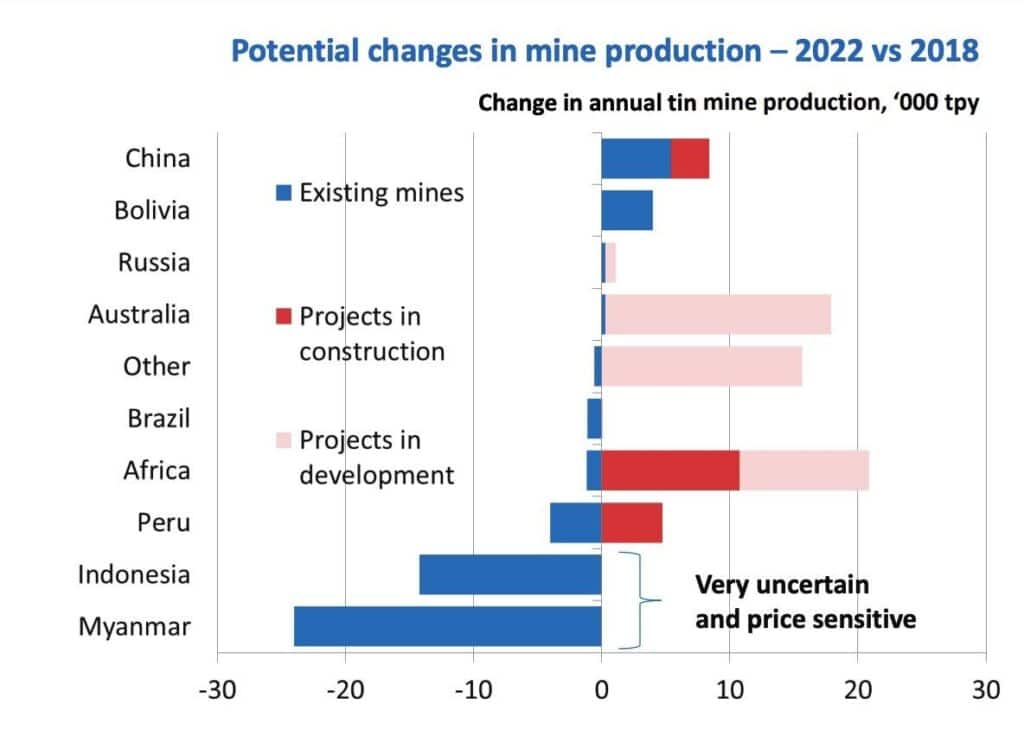
Every major global producer faces these same challenges.
Myanmar has a reserve issue and hasn’t invested in production with tin under $30K/t.
South American supply peaked in 1988, came close in 2004, but then trailed off to ~50Kt today.
Africa has one legitimate producer: Alphamin Resources (AFM)
Australia has one mine in operation (Renison Bell) that generates 8Kt per year.
When you look at the data and the trajectory for the world’s largest producers, it’s hard to feel anything but bearish about future primary production.
What about secondary supply?
Secondary Supply: What It Is & Where It Comes From
Tin has two sources of secondary supply: scrap recycling and scrap refining.
Scrap recycling accounts for ~18Kt in annual supply, with ~52Kt coming from refined secondary tin.
That would require refineries and recycling facilities to operate at near maximum capacity, which is something they haven’t done historically. We’ll assume ~60Kt in annual supply in our model.
Future Tin Projects
I’ll repeat what I say for every commodity thesis … yes, in theory, this enough tin in the world to meet our wildest demand expectations. The problem, of course, is incentive prices, government policies, geographic feasibilities, and public sentiment.
I love how our resident metals and mining expert, Adrian Godas, explained the issues with tin’s project pipeline (see slide below, edit: updated image to reflect Elementos DFS/permitting position).
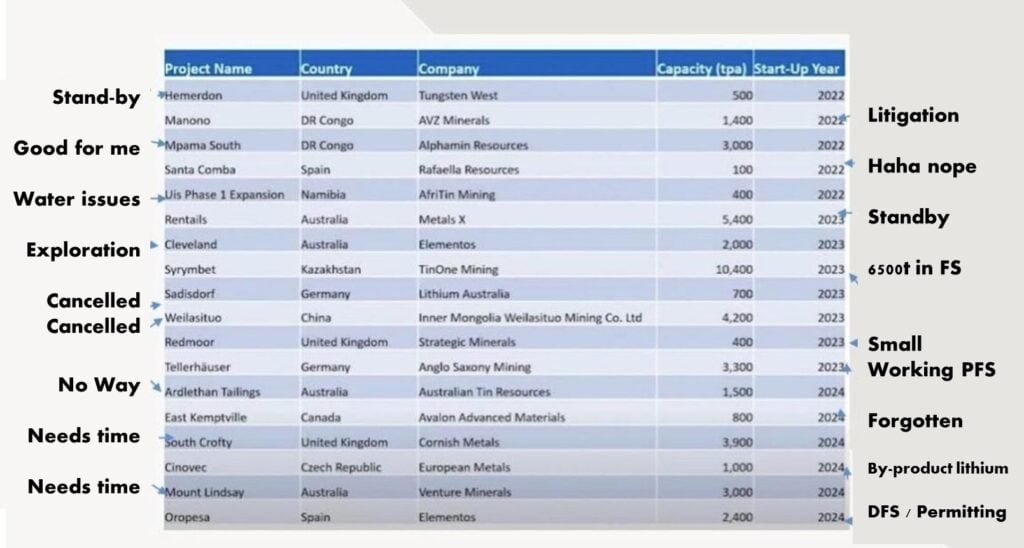
Adrian estimates the industry will add ~34Kt in annual supply by 2026. The reason for the expectations gap is the incentive price.
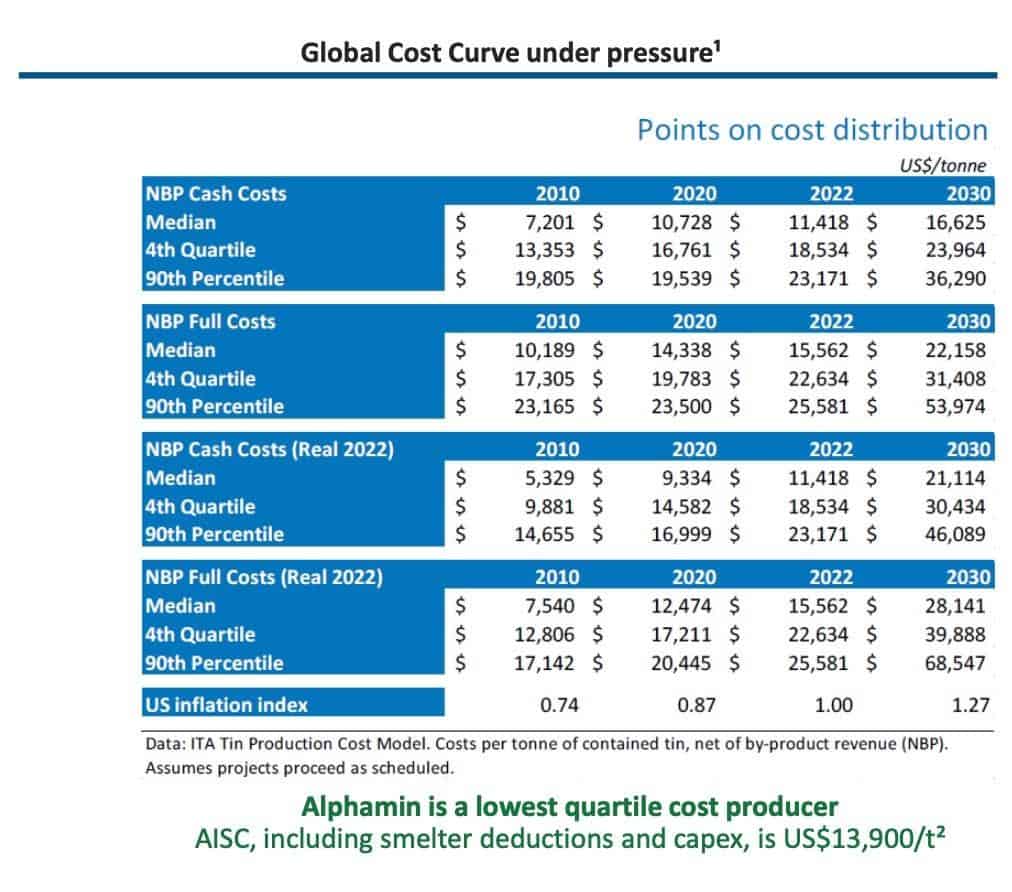
Tin trades at ~$24K/t or below the $30K/t marginal cost of production curve (see below).
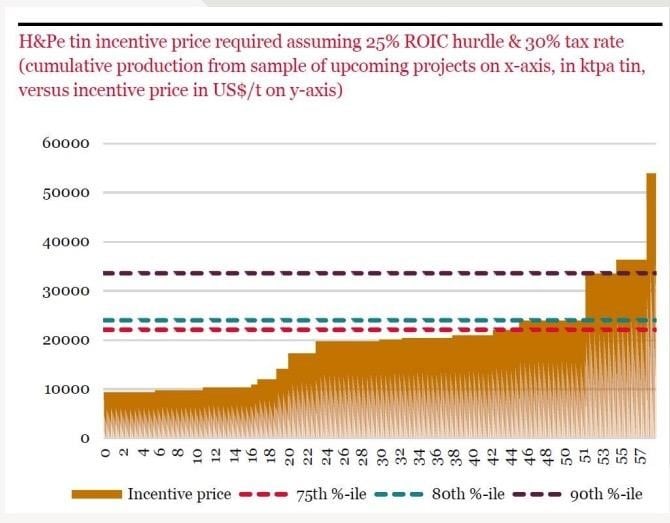
In other words, there’s no incentive to bring new supply to market until tin prices pass $30K/t.
Making The Supply Side Of Our Model
Now, we’re ready to build the supply side of our model. We have primary and secondary production figures for 2021-2022E. Our job is to estimate what supply will look like over the next 18-24 months.
I assume that primary production will decline by ~9% from 2022 to 2024, or roughly 4.5% annually. This includes the shift from onshore to offshore dredging in Indonesia, falling grades and reserves in China, and a lack of new mine supply coming online.
It’s important to note that it does not include metallic nationalism events like export bans, which we’ve already seen.
I also assume that secondary supply remains unchanged at ~70Kt per year.
How To Update Our Supply-Side Model
There are a couple of ways to update our supply-side model. First, create a “Tin” watchlist in Koyfin and monitor the public company supply data.
I’d also recommend following the International Tin Association (or ITA) for any news on tin supply.
Finally, there are a few great tin investors on Twitter worth following … @Respeculator and @TinBaron come to mind.
Concluding Supply
Tin faces a tight supply market even if we assume countries continue to export and face no geopolitical or geographic risks. However, that will change as countries like Indonesia classify tin as a “Critical Mineral” and choose to export fewer products.
Prices remain below the marginal cost of production, and substantial new supply won’t come online within the next 2-3 years.
Our base case is that by 2024, global tin supply will reach ~353Kt with a ~9% cumulative decline in primary production and stagnant secondary supply.
The good news is that we don’t need a dramatic supply estimate to reach a significant supply/demand deficit. Even the slightest increase in projected demand will create a massive supply gap that cannot be filled for years.
That’s the blessing and the curse of small commodity markets. It’s too small for the larger players to care. But it’s big enough for us to make a ton of money in.
Onto demand.
The Demand Side: Primary & Secondary Drivers
We can divide tin demand into primary and secondary drivers. Primary drivers include Soldering, Chemicals, and Tinplate.
Secondary drivers include Lead-Acid batteries, Solar Ribbon, Data Centers, and EVs.
Let’s start with primary demand drivers.
Soldering represents ~50% of demand (~178Kt). It’s the “glue” that holds the consumer electronic world together.
Chemicals account for 17% of demand (~60Kt) and include things like PVC pipe stabilizers, polymer and ceramic additives, and mobile phone screens (fun fact: tin is why we can use mobile touchscreens).

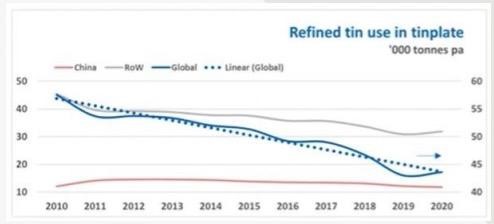
Finally, tinplate represents 12% of demand (~43Kt) and is in structural decline. Tinplate includes things like food packaging. Over time, companies have switched from tin to the cheaper alternative, aluminum.
These three main demand sources comprise ~281Kt in annual primary demand. But that’s not without demand headwinds.
For example, semiconductor miniaturization has reduced solder tin demand as smaller semiconductors use less tin. There are also substitution threats from solder pastes, which require less tin.
Tinplate demand will eventually become a rounding error as packaging companies switch to aluminum or clear cans and tin-free steel products.
Offsetting these headwinds are the long-term secular tailwinds from secondary demand.
The Great Electrification: Boosting Secondary Demand
Tin is the most-impacted metal in The Great Electrification transition, according to MIT/Rio Tinto (see below).
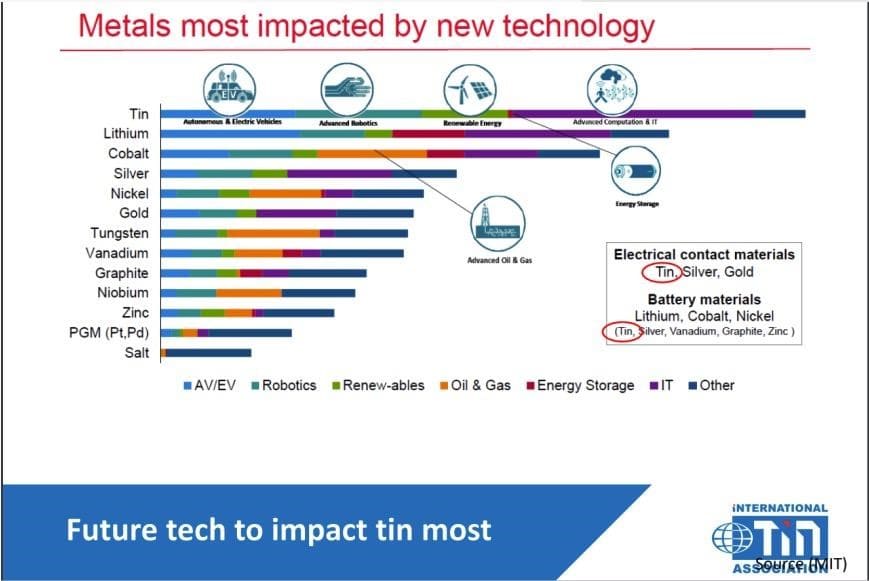
Data centers, wearable devices, solar panels, semiconductors, and EV batteries require a lot of tin.
An electric vehicle, for example, has twice the amount of tin as an ICE car.
The other important thing about future tin demand is the government’s appetite to swap lead for tin in the soldering process. Wood Mackenzie explains the lead ban impact (emphasis added):
“The EU Restriction of Hazardous Substances (“RoHS”) directive already limits the lead content in electronic goods to below 1000ppm and requires its elimination in solder by 2030. Similar regulations have been passed in China, Japan and Korea, and while no regulations yet exist at a national level in the US, several individual states do restrict the use of lead in certain products.
A global alignment to the 2030 EU standard could add a further 20 kilotonnes per year (kt/a) to demand by 2030. But even before such legislation, electronics manufacturers are already voting with their feet in adopting lead-free solders.”
Predicting demand is both impossible and futile. The best we can do is throw grass in the air and see where it blows.
But take something like semiconductors. The world has an insatiable demand for more data centers, advanced AI/ML, autonomous vehicles, and wearable devices. That’s not stopping, either.
Here’s McKinsey’s latest AI Hardware report on semiconductor demand (emphasis added):
“AI applications generate vast volumes of data—about 80 exabytes per year, which is expected to increase to 845 exabytes by 2025. In addition, developers are now using more data in AI and DL training, which also increases storage requirements. These shifts could lead to annual growth of 25 to 30 percent from 2017 to 2025 for storage—the highest rate of all segments we examined.”
Let’s look at Data Center spending from 2017 to 2025E to put that into perspective. In 2017, Data Centers had a market value of ~$5-6B, split between “Inference” and “Training” data storage.
By 2025, McKinsey estimates that Data Centers will reach a market value of ~$13-15B, with $9-10B coming from “Inference” data and $4-5B from “Training” data.
In fact, we’ve been pounding the table on semiconductor demand since 2020.
Sure, technology and semiconductor demand will decline in a global recession. But the only thing that does is push the long-term thesis back 1-2 years.
Companies like Intel are spending $20B+ to build two new semiconductor foundries in the United States.
Solar Panels: Small But Growing Demand Driver
Tin is the preferred soldering metal for solar ribbons due to its high conductivity, malleability, and low price.
Solar ribbon is a minor source of demand at less than 20,000 tons per year. However, according to the ITA, demand for solar panels, specifically solar ribbons, will double by 2030.
The significant increase comes from the International Renewable Energy Association’s (IRENA) forecast of ~1,000GW of solar power generation needed by 2050 (see below).
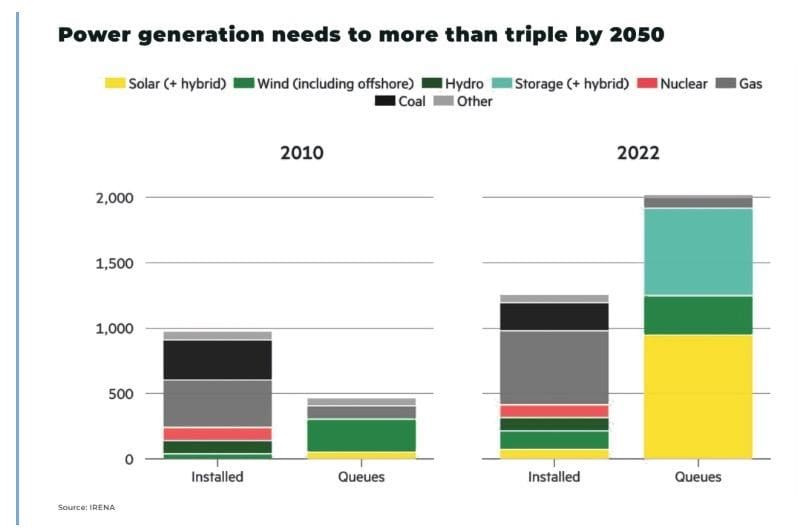
By 2030, we could see 60,000 tons in annual demand from solar panels alone. That’s ~17% of current total usage. Even if you get halfway to your solar goals, you’re still adding ~8% of total usage from one category. Supply simply can’t keep up.
Making Sense of Aggregate Demand
If I were to summarize tin demand in one sentence, it would be that, yes, certain primary use cases will decline over time (particularly tinplate). But it’s overshadowed by the tremendous growth potential of new technology like AI, data centers, EVs, and lead-free transitions.
Let’s build our demand-side model.
Building The Demand Side Of Our Model
You can check out our model below, which includes the growth assumptions for primary and secondary demand drivers.
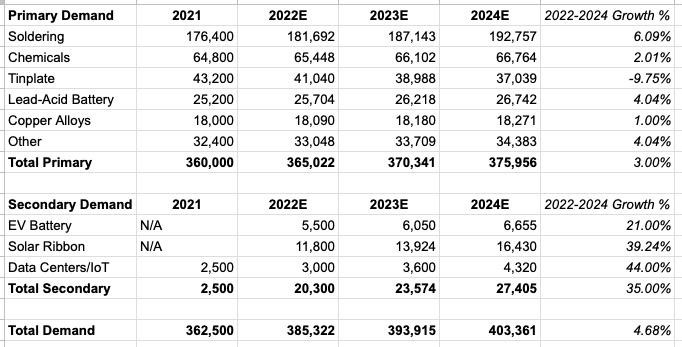
We assume that demand will grow by ~5% from 2022 to 2024 (or 2.5% annually).
How To Update Our Demand Side Model
There are a couple of ways to update our model. First, routinely check the International Tin Association (ITA) for new reports or presentations. Most of their stuff is behind a paywall. But sometimes, they’ll release free news.
Also, monitor primary and secondary demand markets.
Look for companies like Intel and Samsung expanding foundry capacity or investing in chip R&D. Check to see how quickly auto OEMs roll out new EVs. Listen to solar panel manufacturer earnings calls to gauge demand.
Bringing It Together: Estimating Tin Deficits
We’ve built our supply and demand models. Now it’s time to measure the estimated deficits.
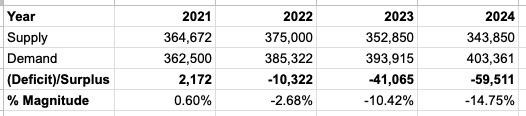
Within a few years, tin’s supply deficit will expand from ~3% of total usage to ~15%.
Again, this is our base case given the structural underinvestment in new supply, a spot price below the marginal cost of production, lower grades and more complex existing reserves, and the long-term secular growth tailwinds in demand.
Moreover, tin is a relatively price-inelastic good. It represents a small portion of a product’s total cost. Smartphones, for example, have around 1g of tin per phone. So even if tin jumps from $25K/t to $50K/t, smartphones only pay an extra $1-2 in tin on a $1,500 device. Tis but a scratch!
So, how can we get rich from this deficit?
How To Play The Deficit In Financial Markets
Like uranium, there are very few ways to get long tin. There isn’t a liquid futures market or tin ETF or mega-cap tin producer. You could buy physical tin and stash it under your bed. But that doesn’t scale well.
We want direct exposure. We want primary producers. And that’s a small list. There are only five investable tin-focused mining companies:
- Alphamin Resources (AFM.TSX)
- MetalsX Limited (MLX.AX)
- Cornish Metals (CUSN.LN)
- Elementos (ELT.AX)
- Andrada Mining (ATM.LN)
Minsur is the largest public tin mining company at ~$4B Enterprise Value. But you need access to the Bolivian Stock Exchange to buy shares (which we don’t have).
Out of the five above options, we prefer Alphamin Resources (AFM) for a few reasons:
1. Highest-grade resource
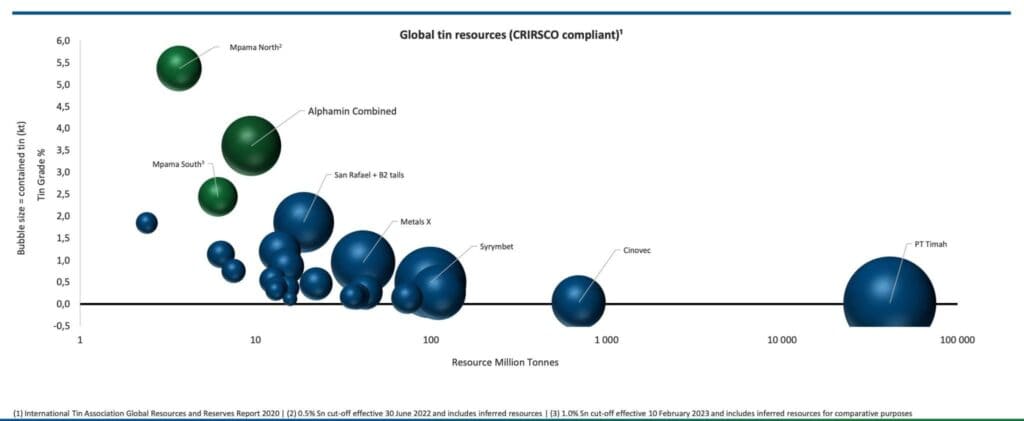
2. Lowest-cost production
3. Most competent management team
AFM management only cares about one thing … mining tin. The company barely has an investor relations team. It isn’t promotional about its stock. And for now, it’s content with trading on the TSX Venture Exchange.
Some might see this as a red flag. I see it as a huge advantage.
4. Most liquid security
AFM is a ~$1B EV stock with decent liquidity (average 10D volume of 237K shares). It’s in that sweet spot where it’s liquid enough for us to enter/exit whenever we want. But also illiquid enough that a large institution dying for tin exposure can move the market.
We’ve written in-depth reports on AFM over the past two years, which you can read here and here.
Conclusion: Tin Squeeze Ahead
Tin is a great setup. There are long-term secular tailwinds from EVs, Green Energy, and semiconductor/data centers on the demand side. On the other side, structural supply headwinds from lower grades, geopolitical risks, and long-term underinvestment due to low tin prices.
This results in a potential supply deficit of ~60K tons or ~15% of total demand.
You can’t live with supply deficits like that for long. The market will eventually realize the gap. In response, tin prices will rise above the marginal cost of production. And assets like AFM will make money hand over fist.
Eventually, hedge funds, family offices, and institutions will want a piece of the action. They’ll be forced to buy the most liquid instrument to express their tin views … Alphamin (AFM).
There are few instances where the supply/demand imbalances coincide with a shortage of ways to express such imbalances.
Tin is one of them. And the squeeze will be epic.
We hope you enjoy the ride.