The concept that a market’s discounting mechanism is based on speculator participation, not price, is the most important thing that I know. ~ Jason Shapiro, “Unknown Market Wizards”
In this week’s Dirty Dozen [CHART PACK] we update the end-of-month technical, sentiment & positioning, and macro outlook for the broader US market (hint: odds still favor more upside), we then update our bullish USD thesis and end with a number of actionable trade setups, plus more…
–
**Note: Enrollment to the Macro Ops Collective closed yesterday. But due to the 4th of July holiday, we’re extending it for an additional week to give you more time to join.
The MO Collective is a community of like-minded investors who share a passion for building wealth and pursuing the path of mastery. By joining, you’ll gain access to a range of resources including expert analysis, macro quant tools, and networking opportunities.
Extended enrollment will close on Sunday, July 9th, at 11:59 pm CST. You have a few extra days to become a member and make sure you’re prepared for this unpredictable macro environment.
Click Here To Join The Collective!
–
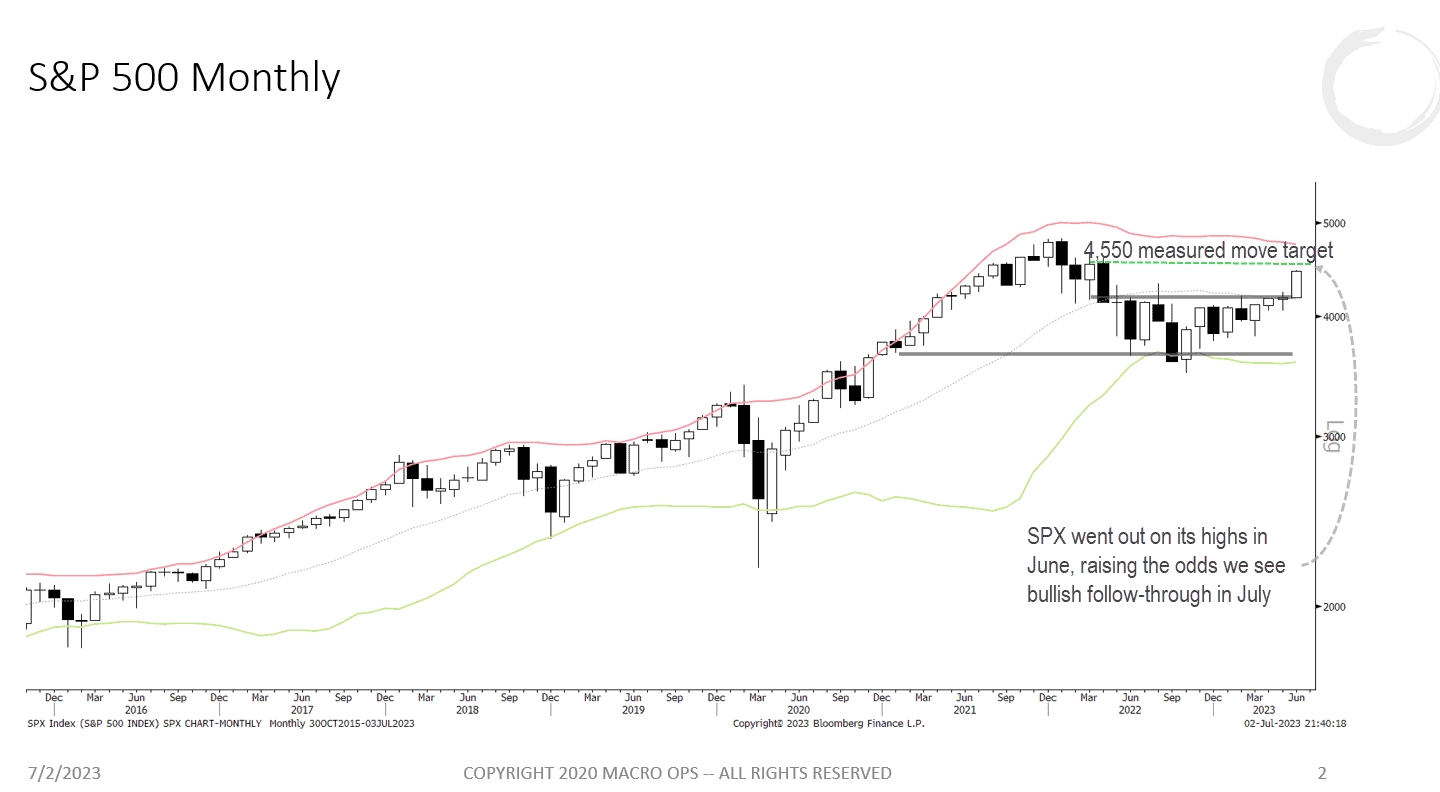
- June went out near its highs giving us a strong bullish breakout confirmation from the SPX’s year-long sideways consolidation. The measured move target for this breakout is around the Mar/Apr high at roughly 4,550’ish.
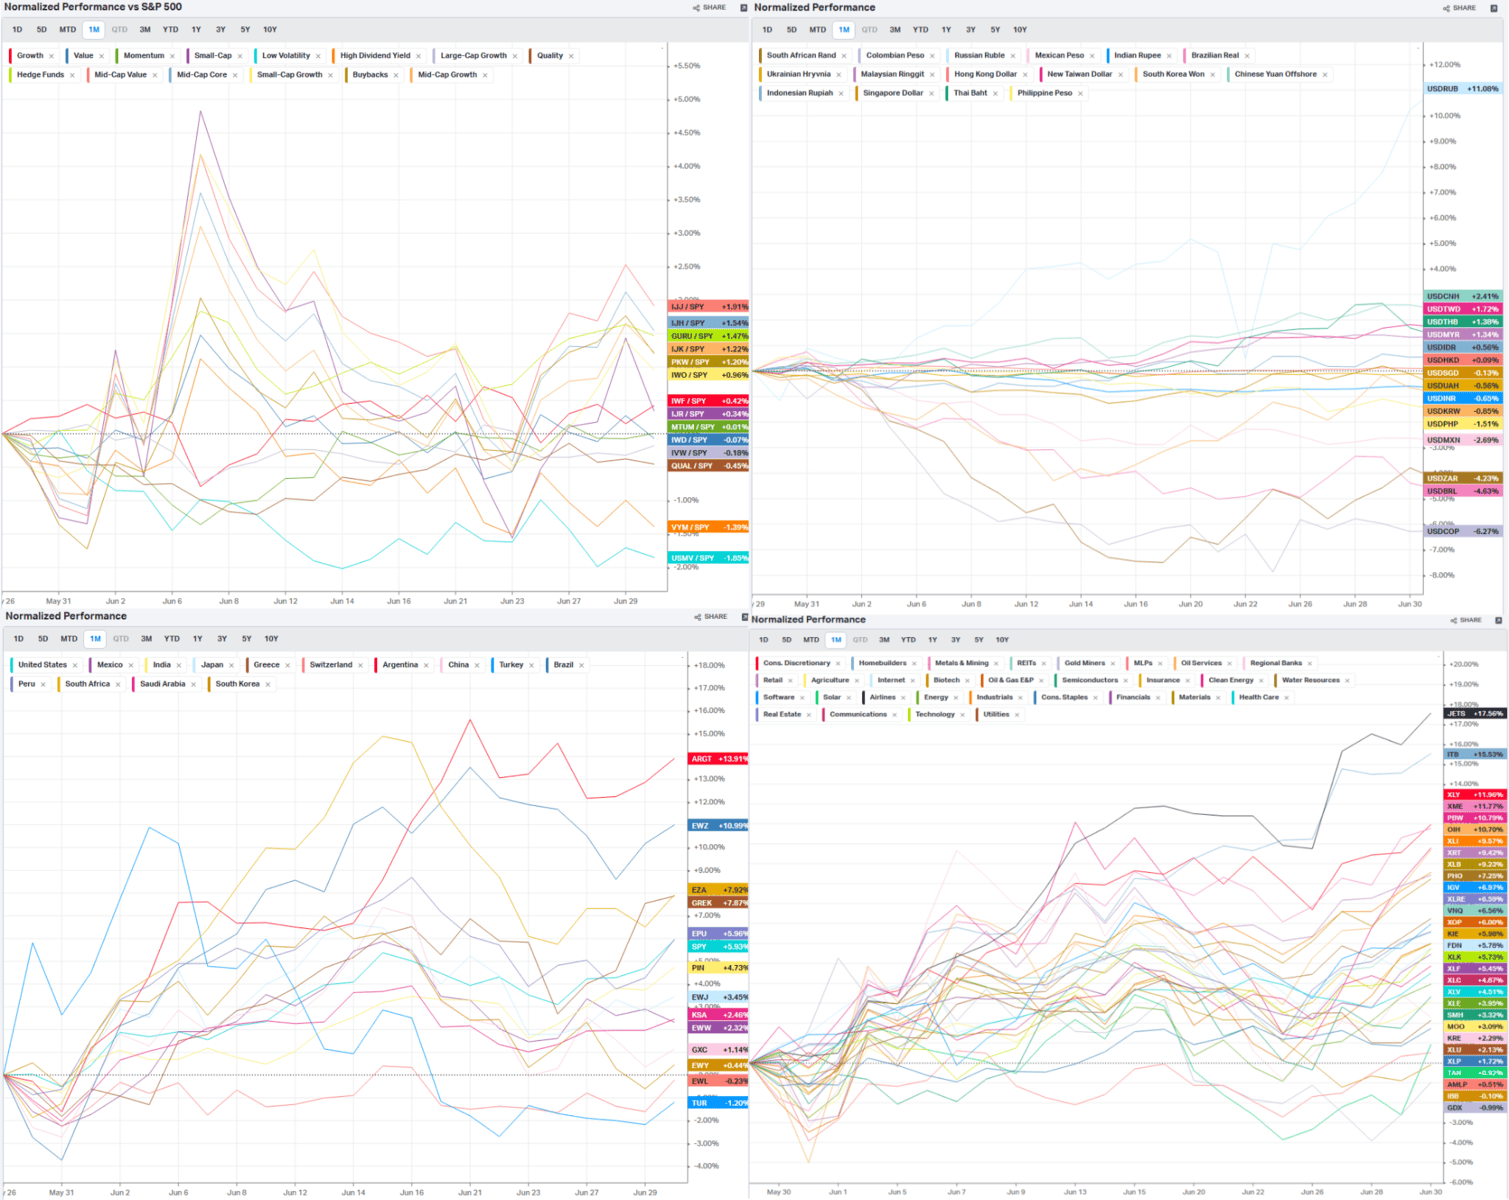
- This is where the money has been flowing over the past month:
The Colombian Peso, Brazilian Real, and the Mexican Peso were some of the best-performing currencies against the US dollar over the last 30 days, while the Chinese yuan and the Russian Ruble were the worst.
The top three performing sectors and industries were Global Jets (JETS), US Home Construction (ITB), and Consumer Discretionary (XLY) — this is not bearish…
Midcap Value (IJJ) and Midcap Core (IJH) took top spot with smallcap and momentum leading in the style factors.
And lastly, Argentina (ARGT), Mexico (EWZ), Nigeria (NGE), and Greece (GREK) were the top-performing countries globally.
The charts below are from Koyfin.
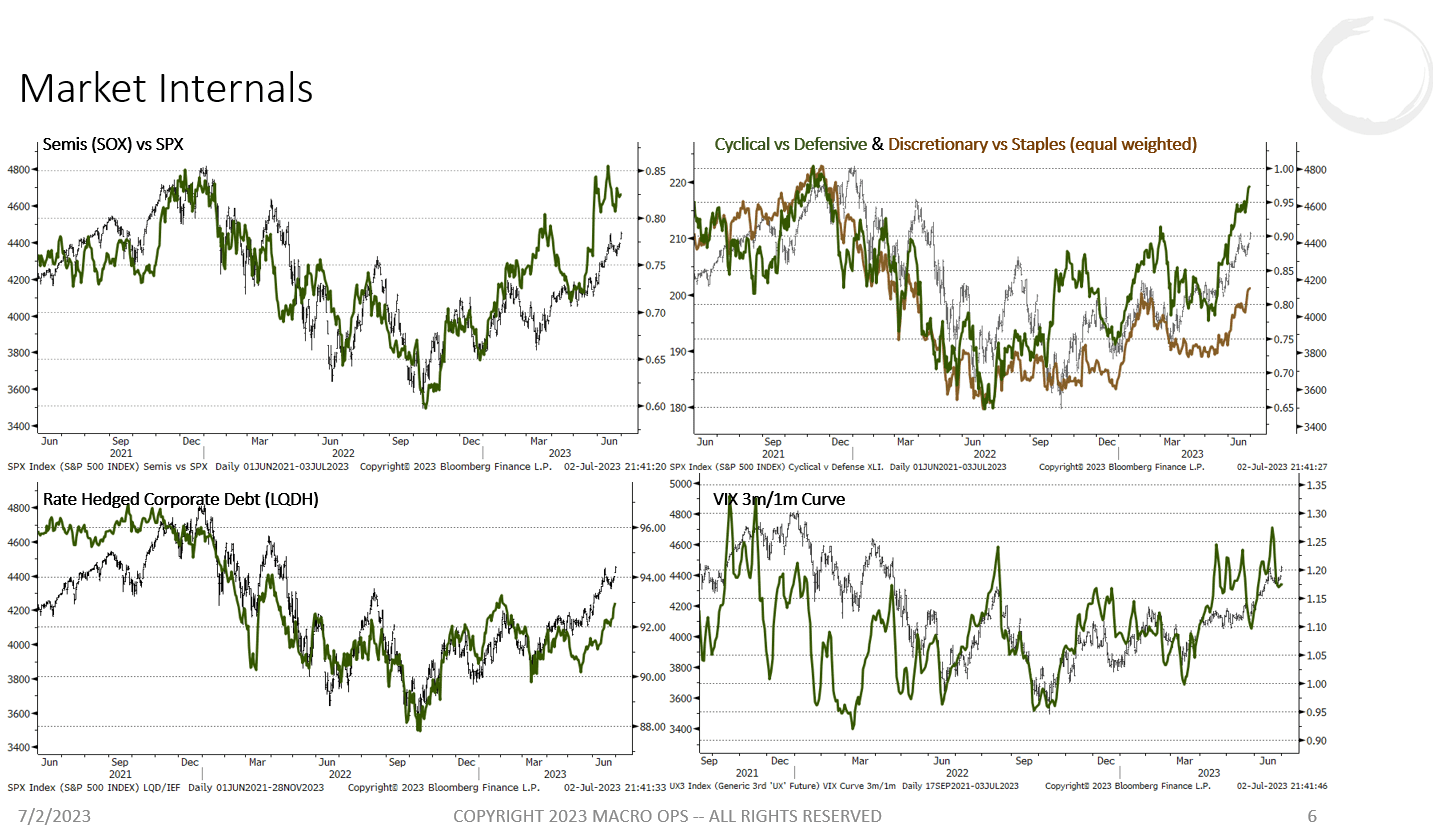
- Market internals (pictured below) continue to confirm the upward trend. A larger selloff is off the table until we see weakness and negative divergence in these areas of the market.
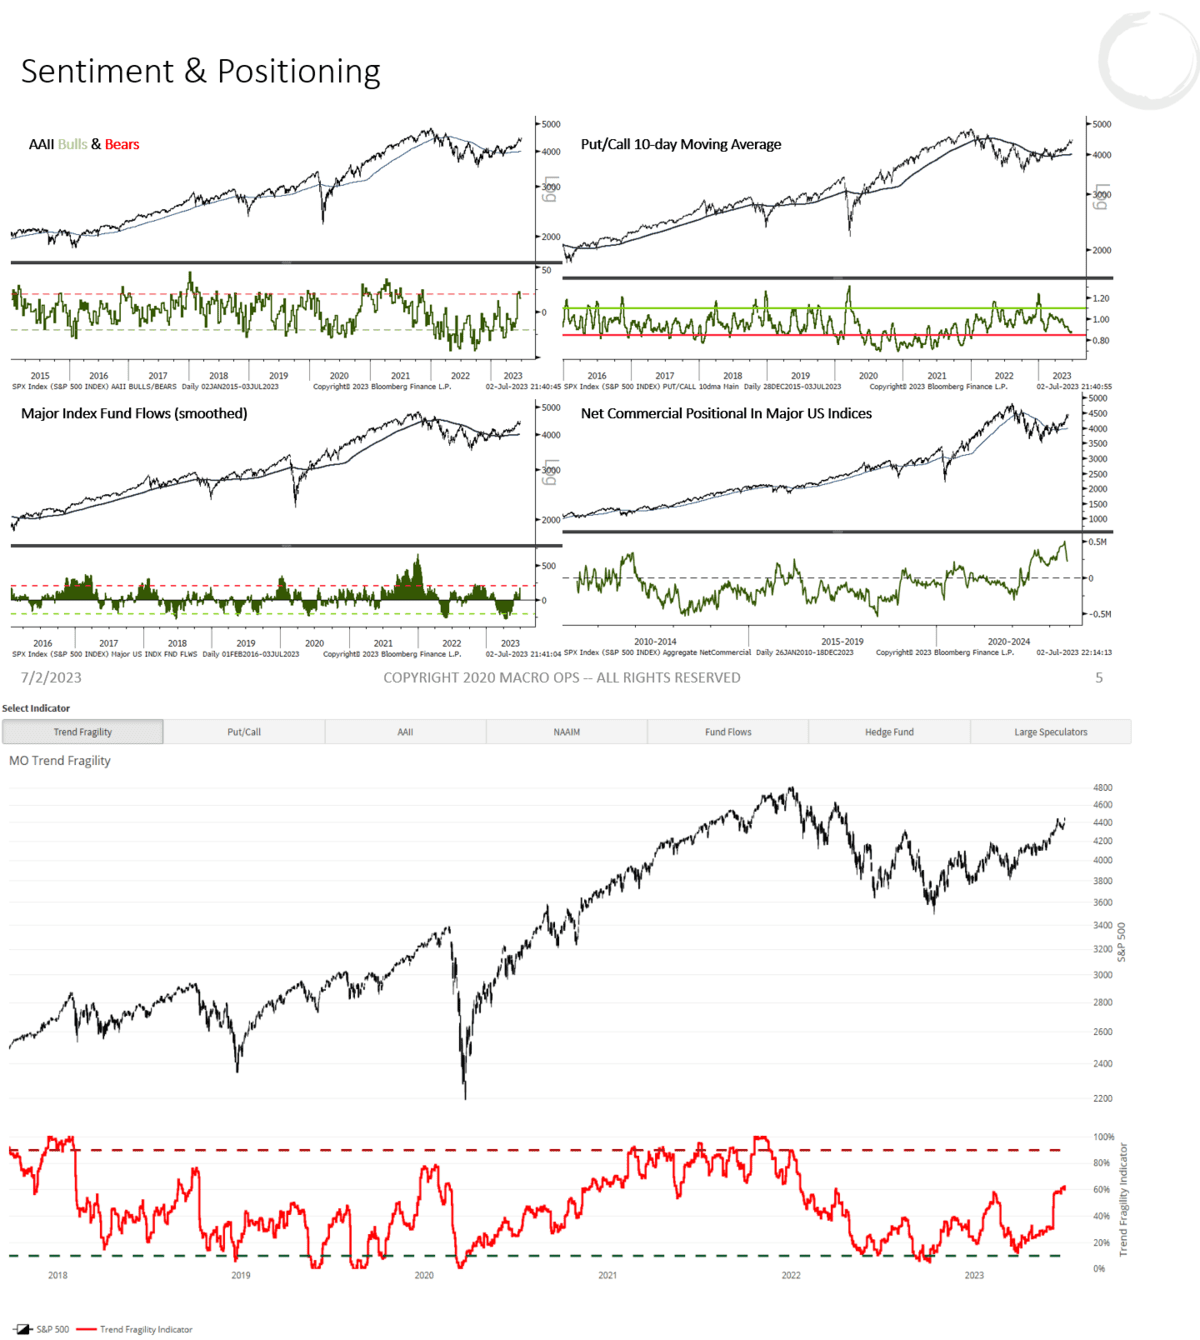
- This year started off with a consensus in negative sentiment and bearish positioning. This is why we turned bullish in late 22’ and continue to be so. And while the Narrative Pendulum is swinging, the bears have been incredibly stubborn in admitting their error. As such, the market will keep moving higher until the last of that group cries uncle.
Two short-term sentiment/positioning indicators are stretched (AAII Net and Put/Call 10dma). But longer-term indicators such as aggregate US index fund flows and aggregate US equity index commercial positioning (bottom two charts) still have a ways to go before a proper sell signal is triggered.
Our Trend Fragility indicator is now at its highest level since Jan 22’ but needs to get to 80%+ for a proper sell signal.
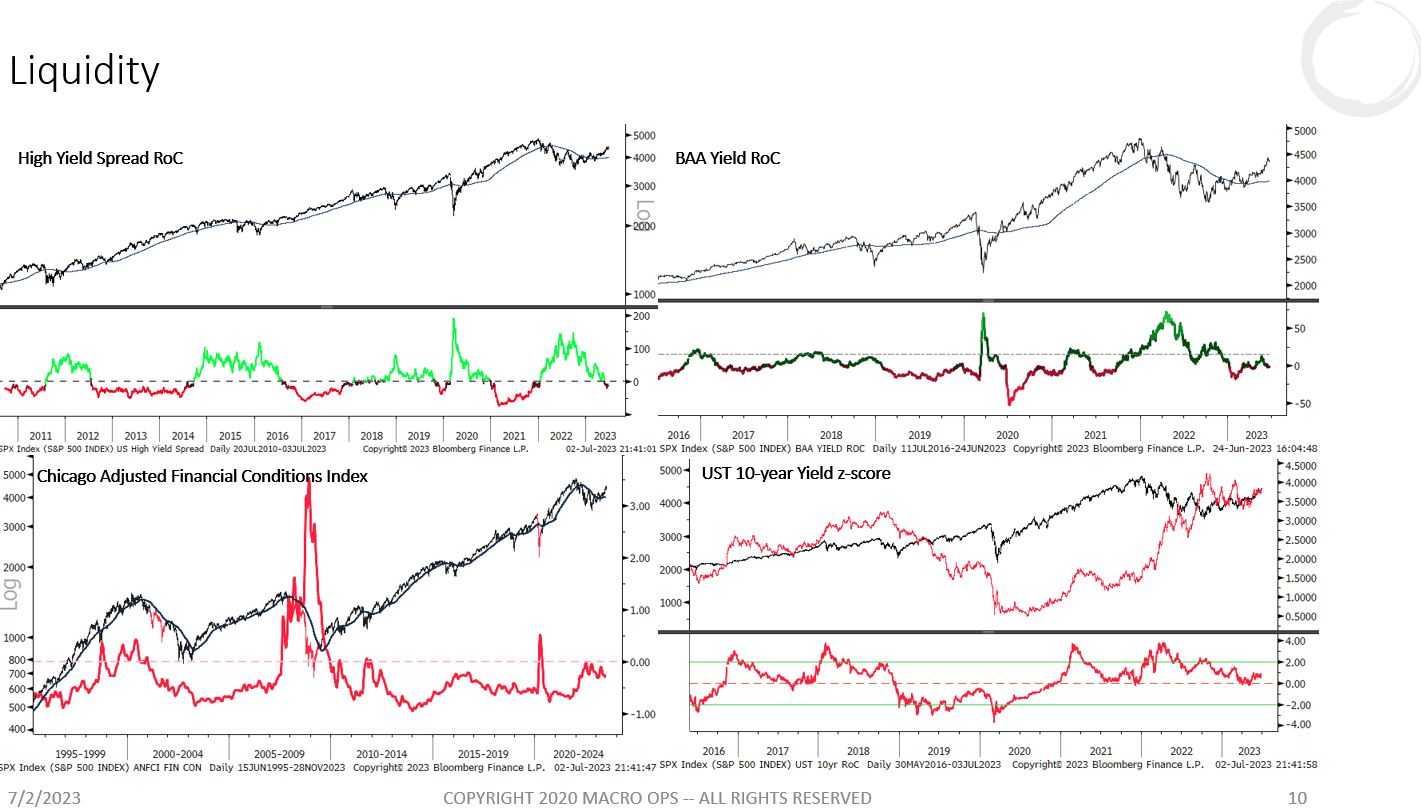
- Liquidity remains robust as the rate of change in yields and high yield spreads has come down since last Fall.
I suspect we’ll see liquidity begin to tighten once again over the coming weeks/months as the market prices in higher for longer rates. But liquidity often has a long lead time on stocks.
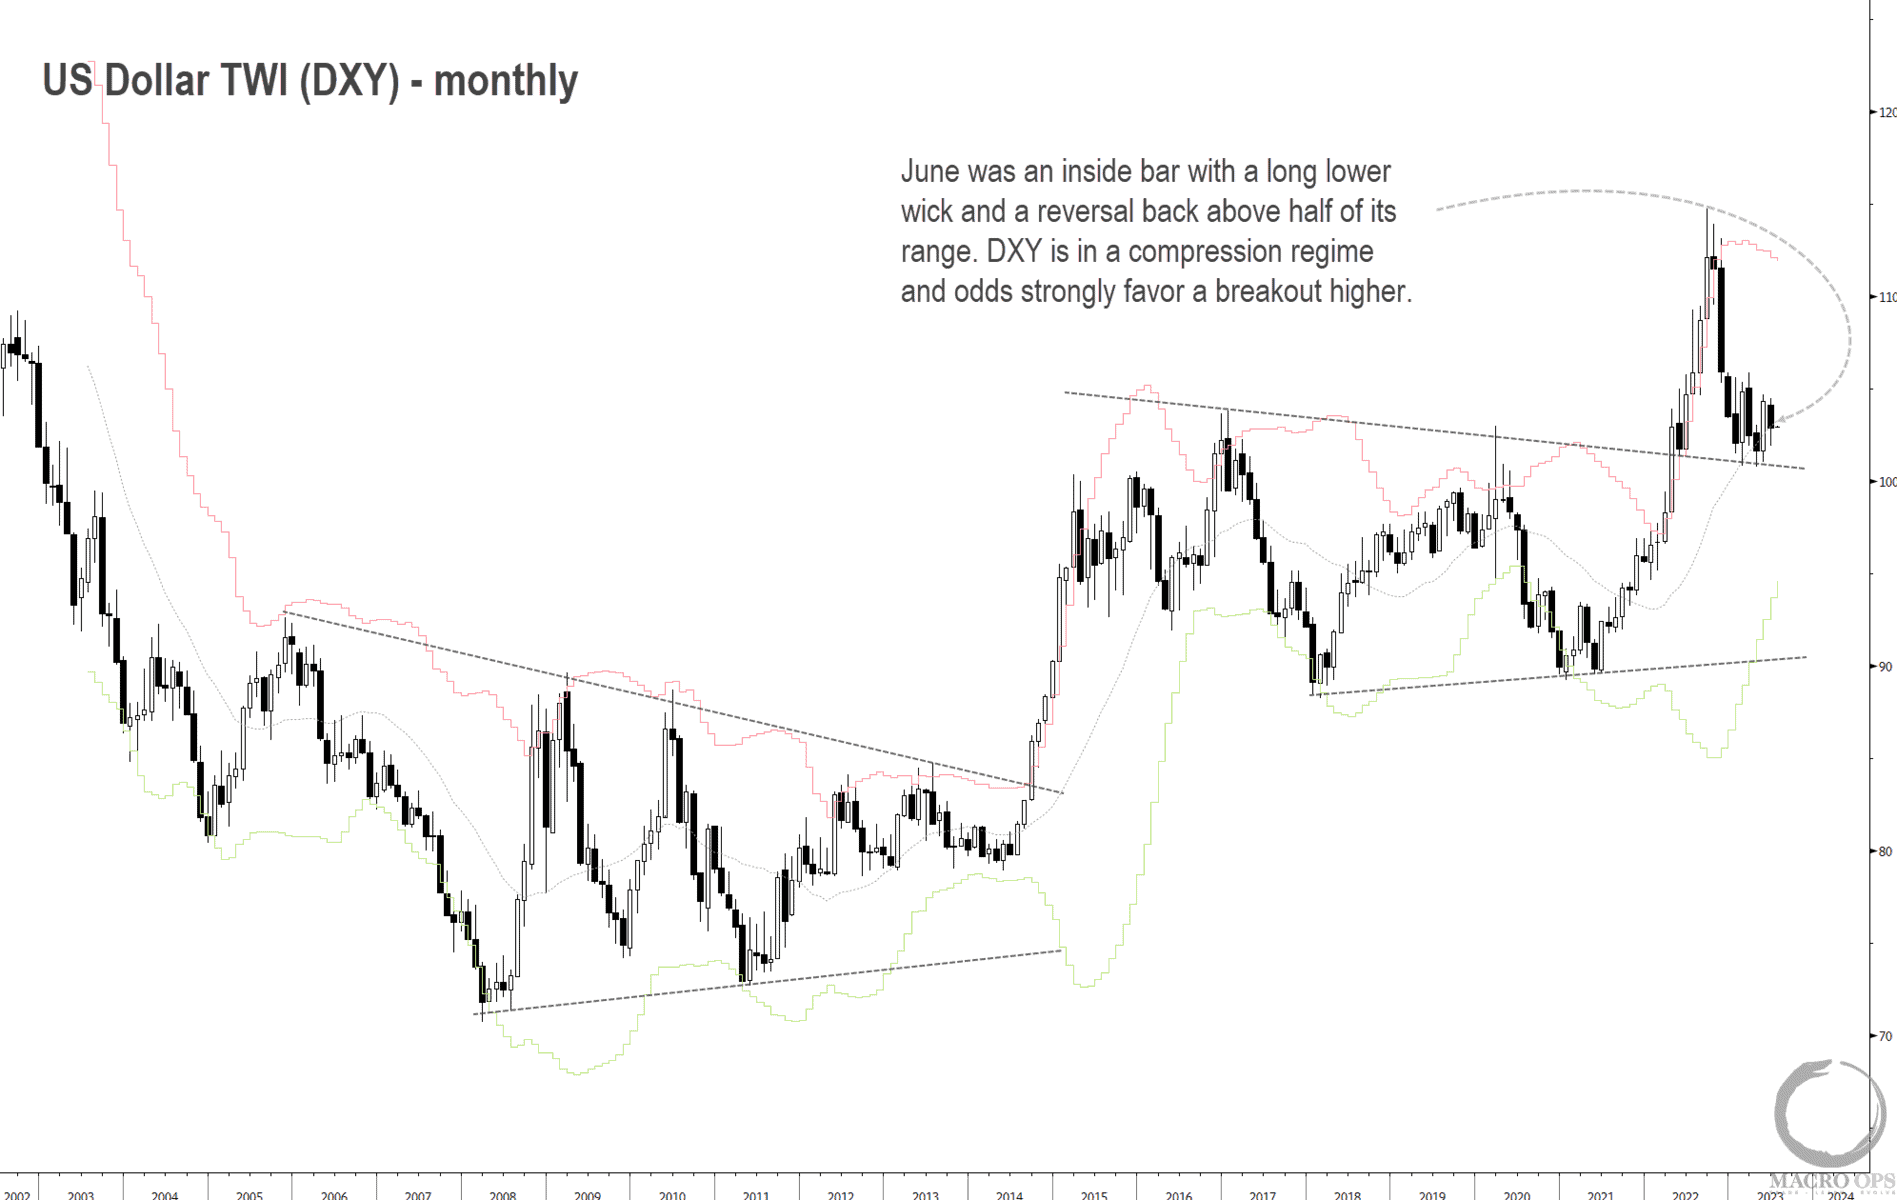
- The US Dollar (DXY) has been consolidating along the breakout level of its previous 7-year trading range. It’s in a developing compression regime, compression regimes lead to expansionary regimes (big trends). My guess is that we’ll see bonds break down and yields drive the DXY on another leg higher soon.
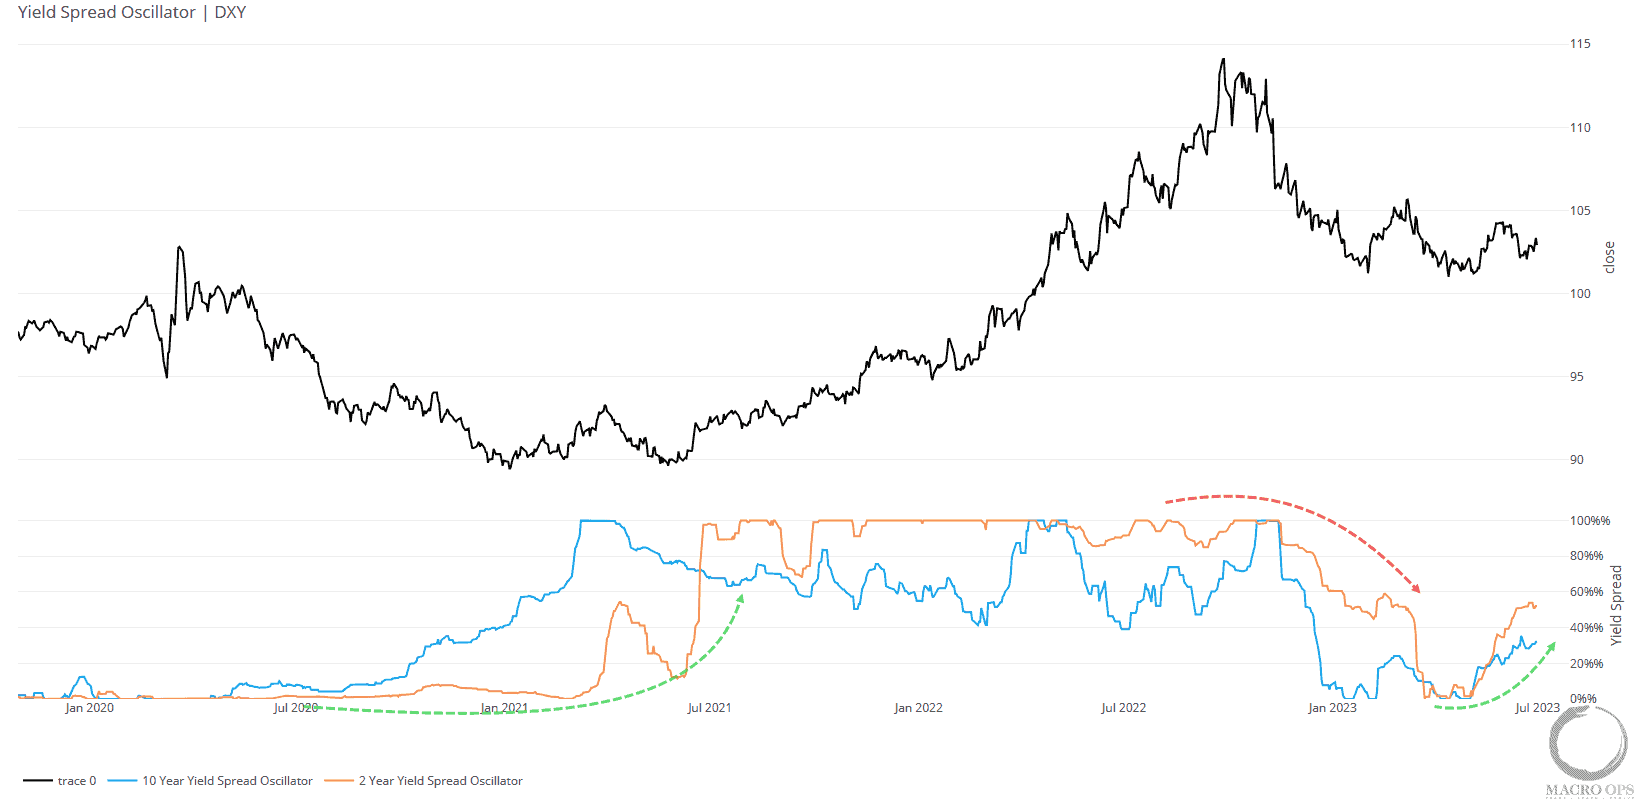
- Below is the aggregate trade-weighted yield spread oscillator for the DXY’s 2 and 10-year yield spreads. It turned up off its lows in May and continues to head up, providing an increasing tailwind for USD.
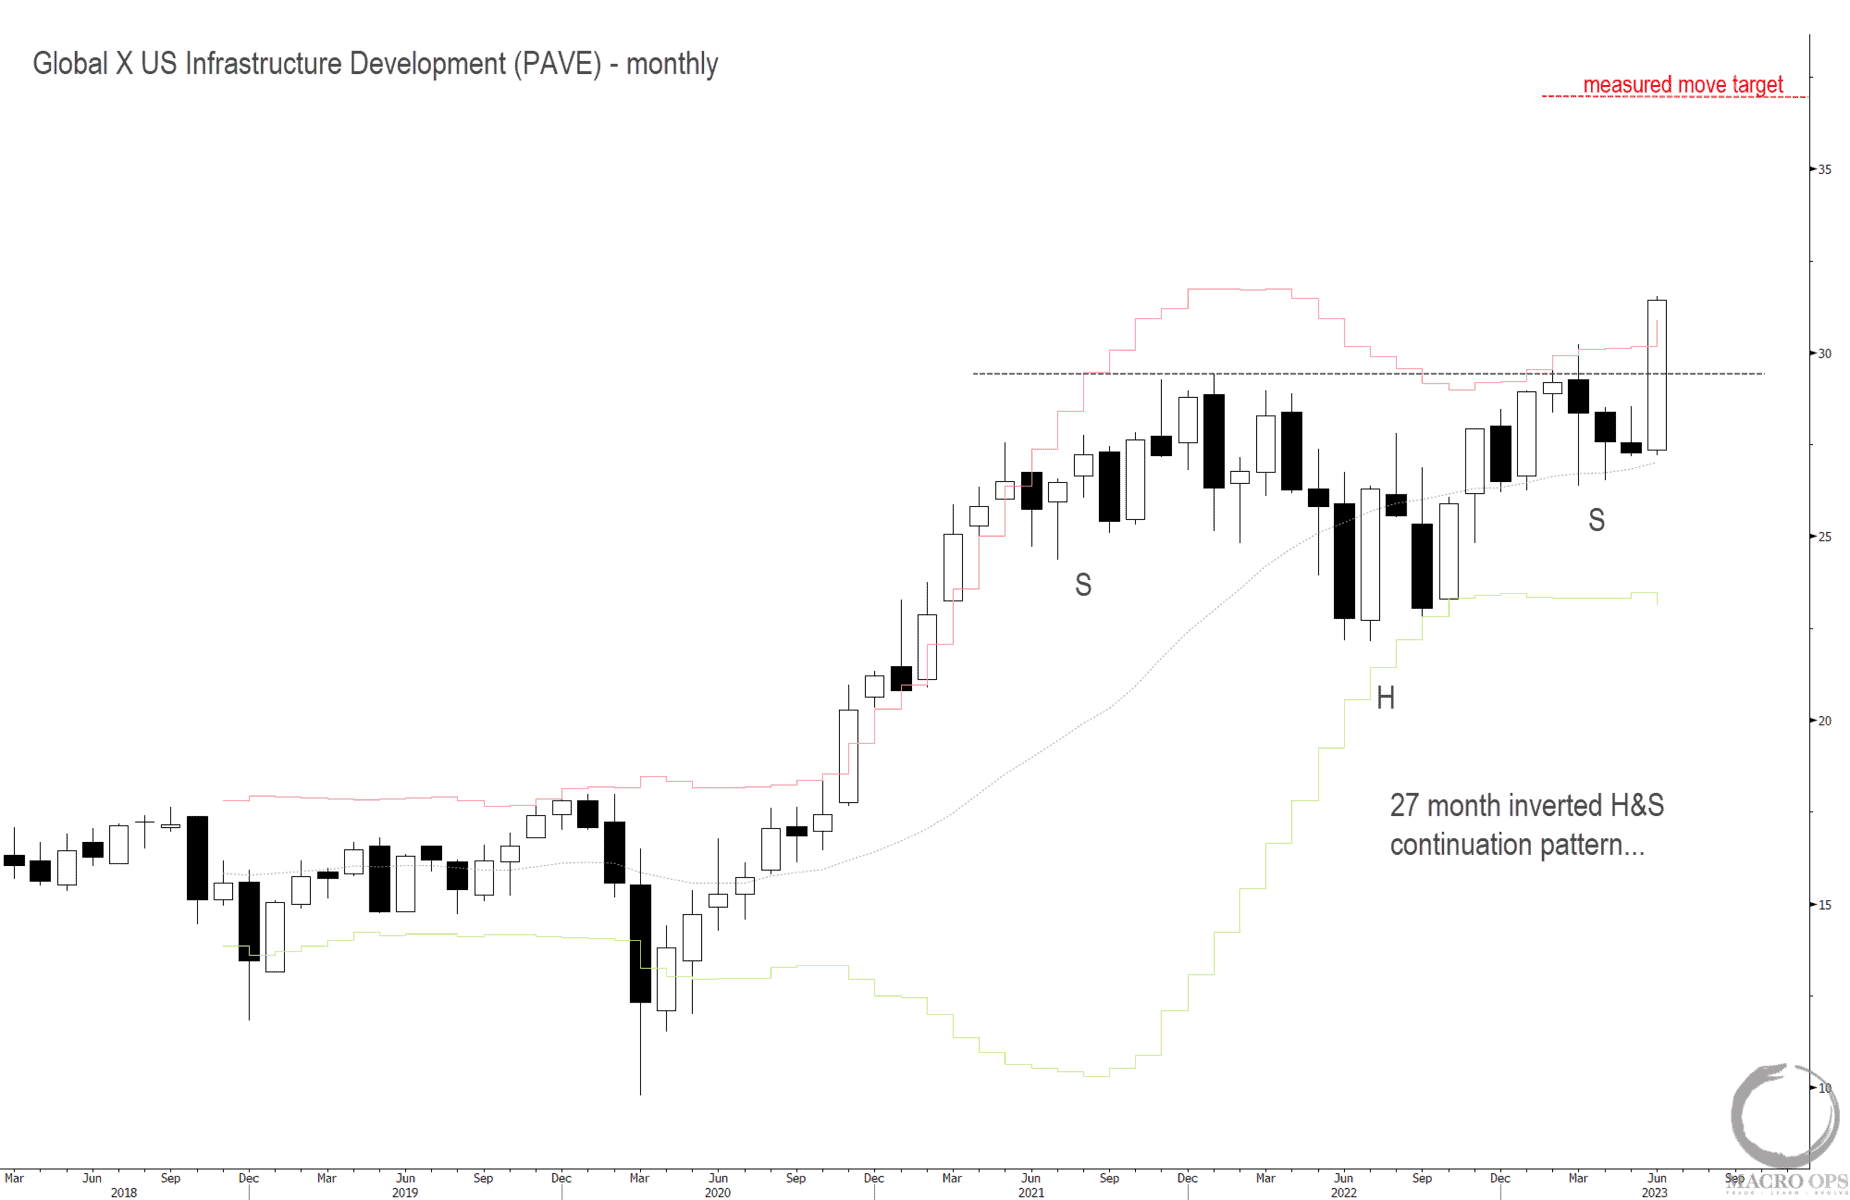
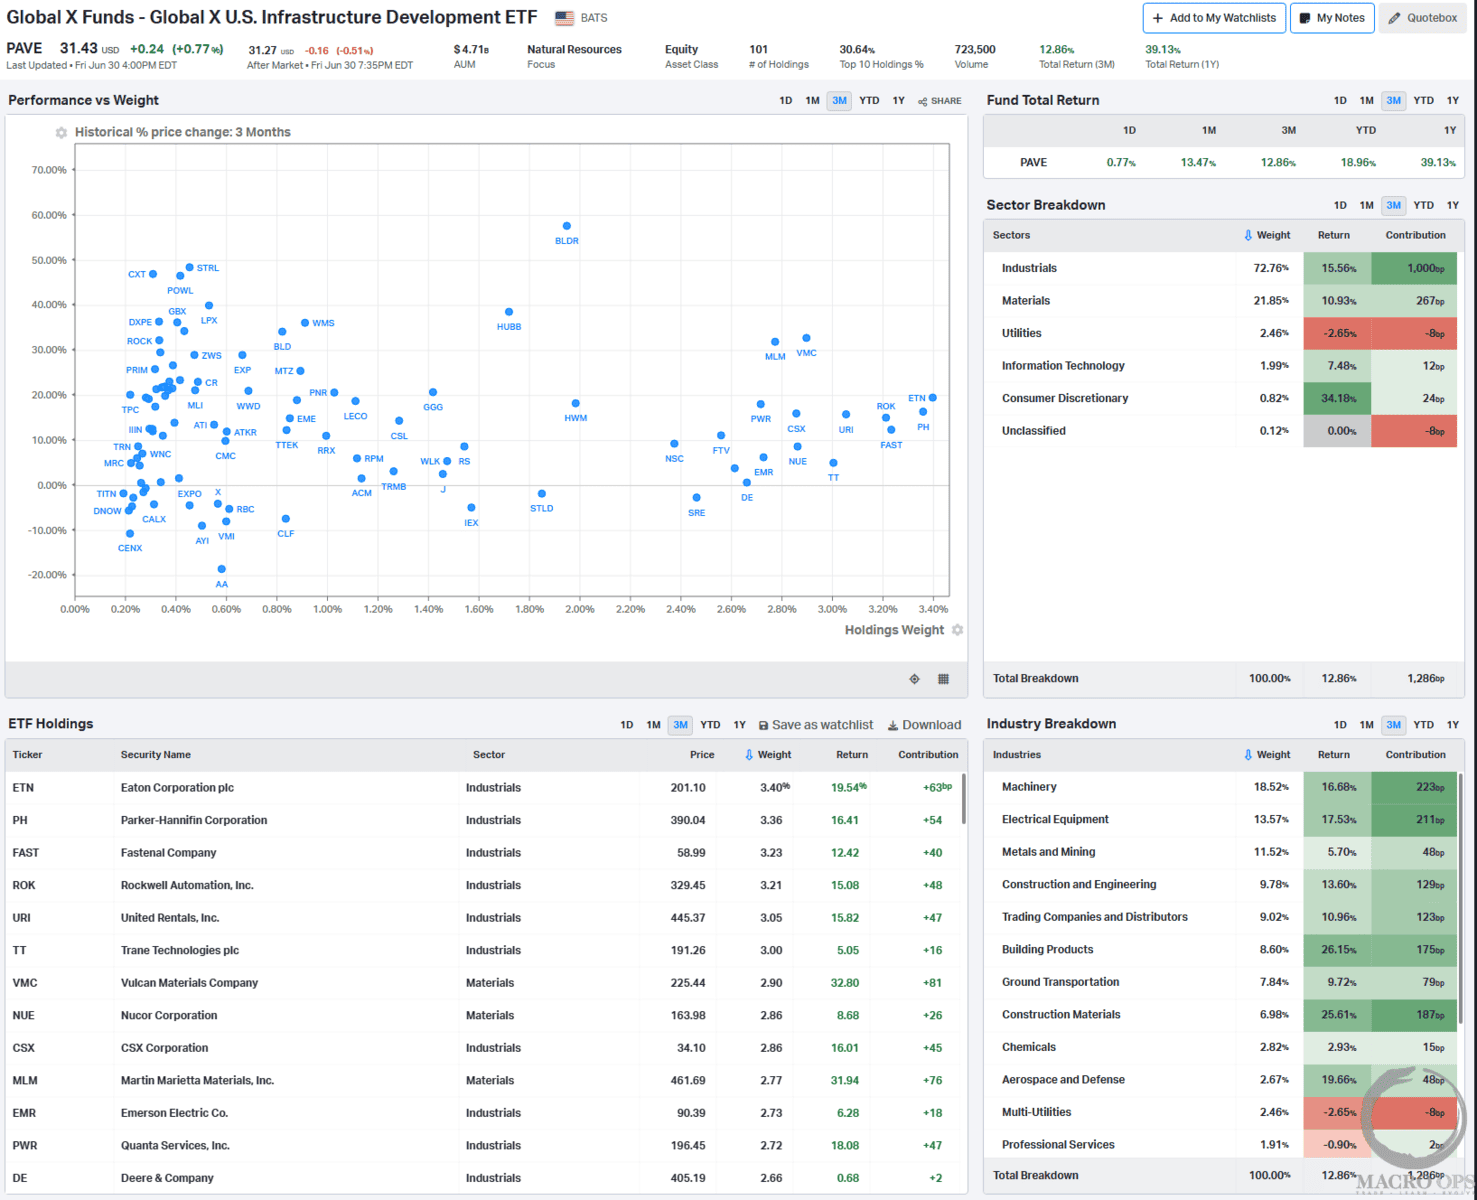
- PAVE, Global X’s Infrastructure development ETF broke out from a 27-month inverted H&S continuation pattern in June.
- Here’s a snapshot of the ETF’s holdings along with the 3m % price change / holding weight for each. BLDR, a stock we highlighted in Jan (link here), has led the pack.
Graph via Koyfin.
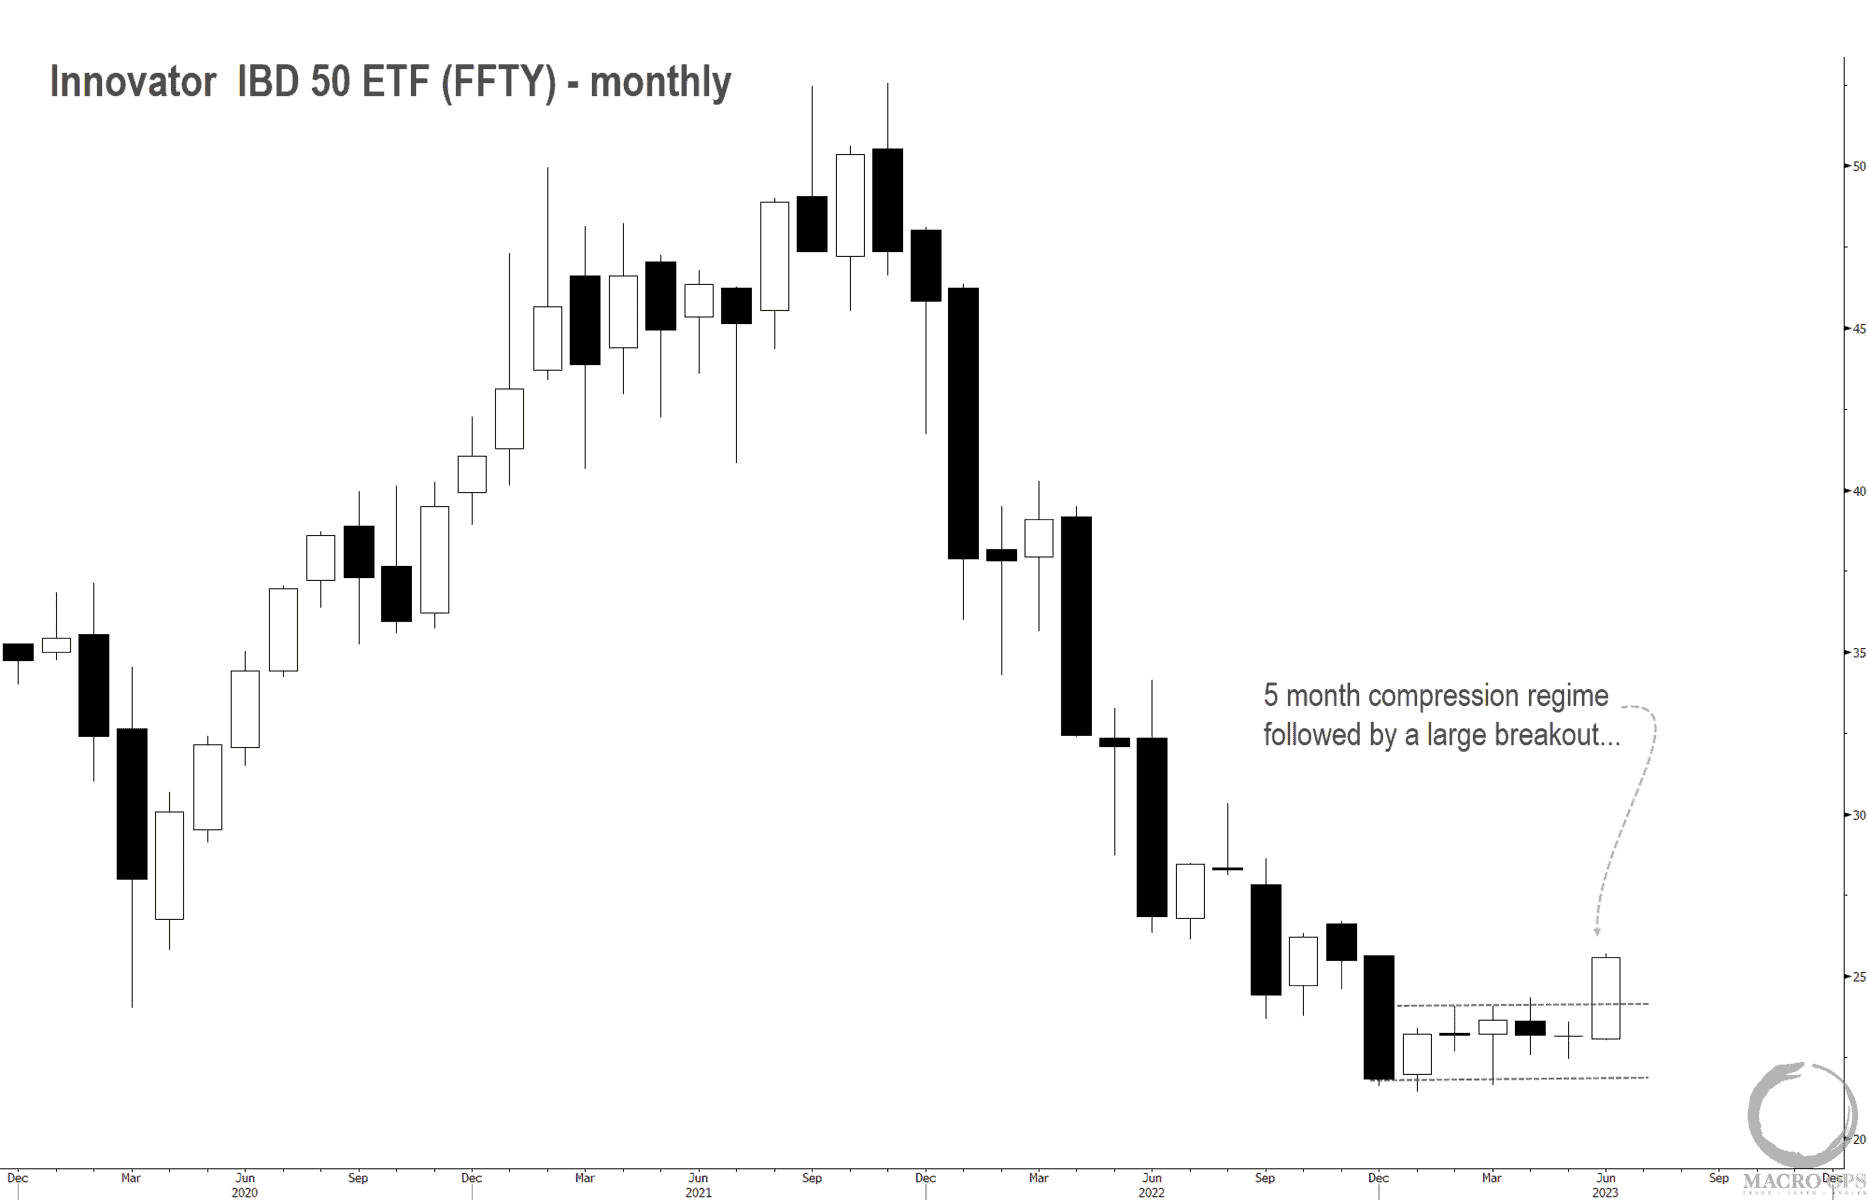
- Innovator IBD 50 ETF (FFTY) completed a bullish breakout from a 6-month rectangle-basing pattern/compression regime.
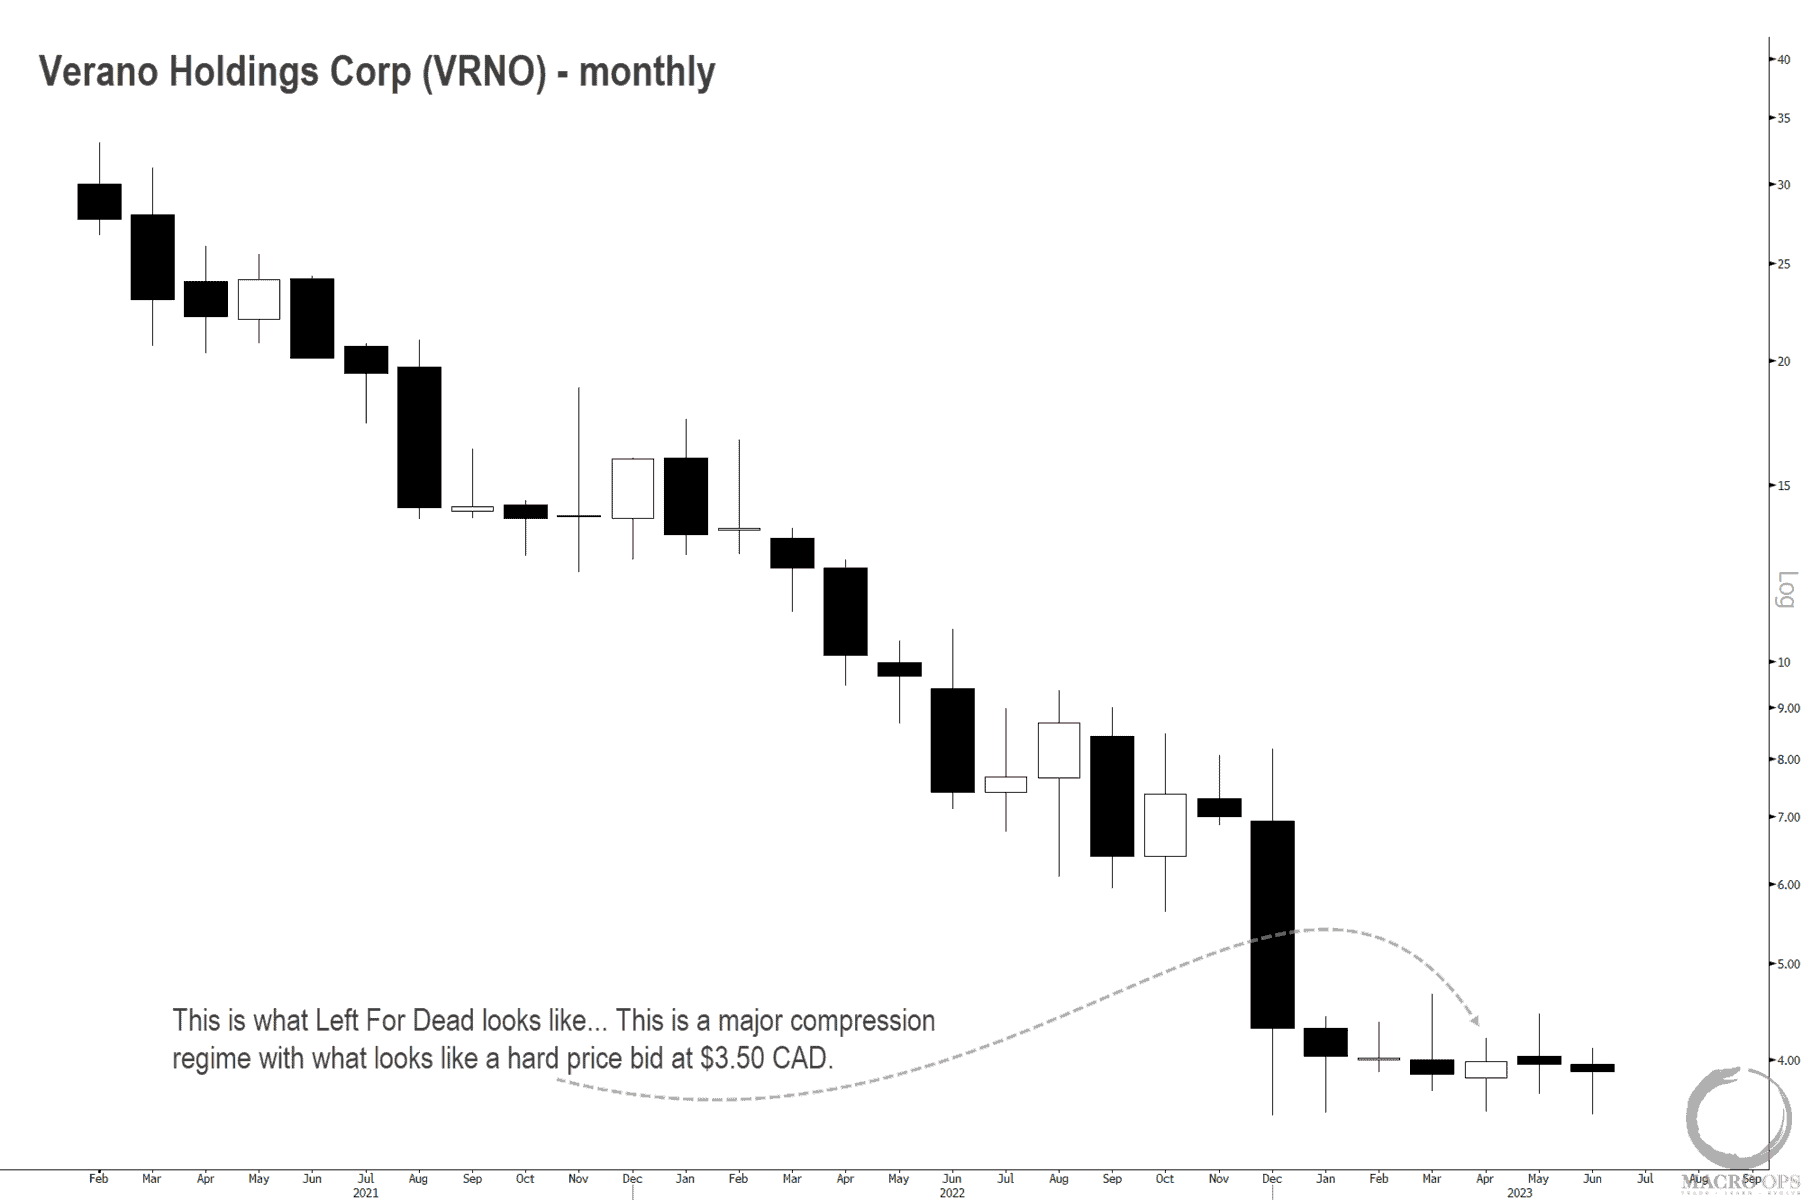
- Nobody talks about the cannabis trade anymore. It’s a completely bombed-out sector. And VRNO, which is one of our favorite operators in the industry, has a left-for-dead stock chart.
I don’t have an edge on when needed regulatory reforms will finally get passed but this stock can be played like a call option. Put a small position on. Have a mental stop below the $3.50 CAD level that has acted as support, and then apply a time stop for the trade to work out.
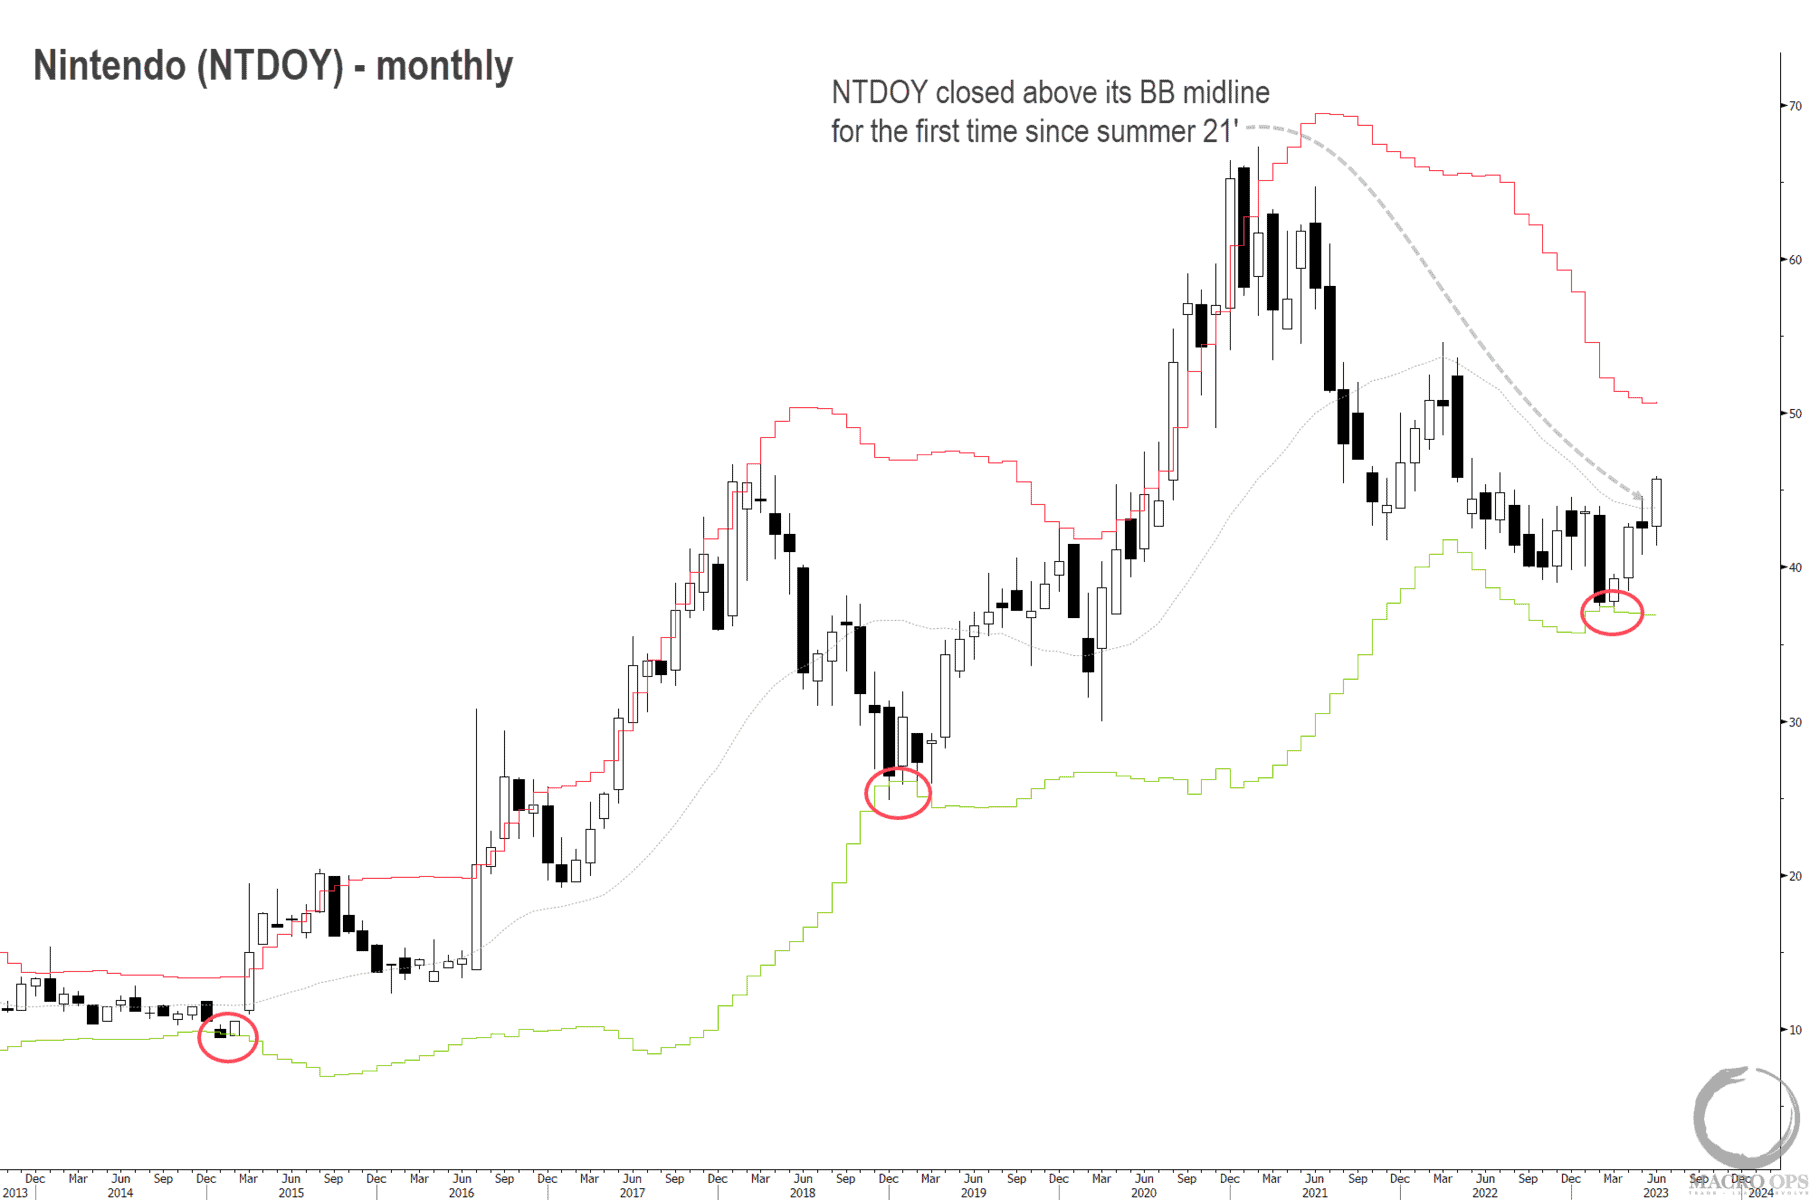
- I wrote about the bullish setup in Nintendo (NTDOY:US ADR) back in April (link here). We’ve since seen positive follow-through and the stock is back to trading above its monthly BB midline for the first time since the summer of 21’.
I think this one has a lot of room to run.
Thanks for reading.


