The thing to do is watch the market, read the tape to determine the limits of the get- nowhere prices, and make up your mind that you will not take an interest until the price breaks through the limit in either direction. ~ Jesse Livermore
Every weekend I scroll through probably a 100+ charts. I figured I’d try sharing a dozen of the more interesting ones that catch my eye. Let me know if you find any value in this.
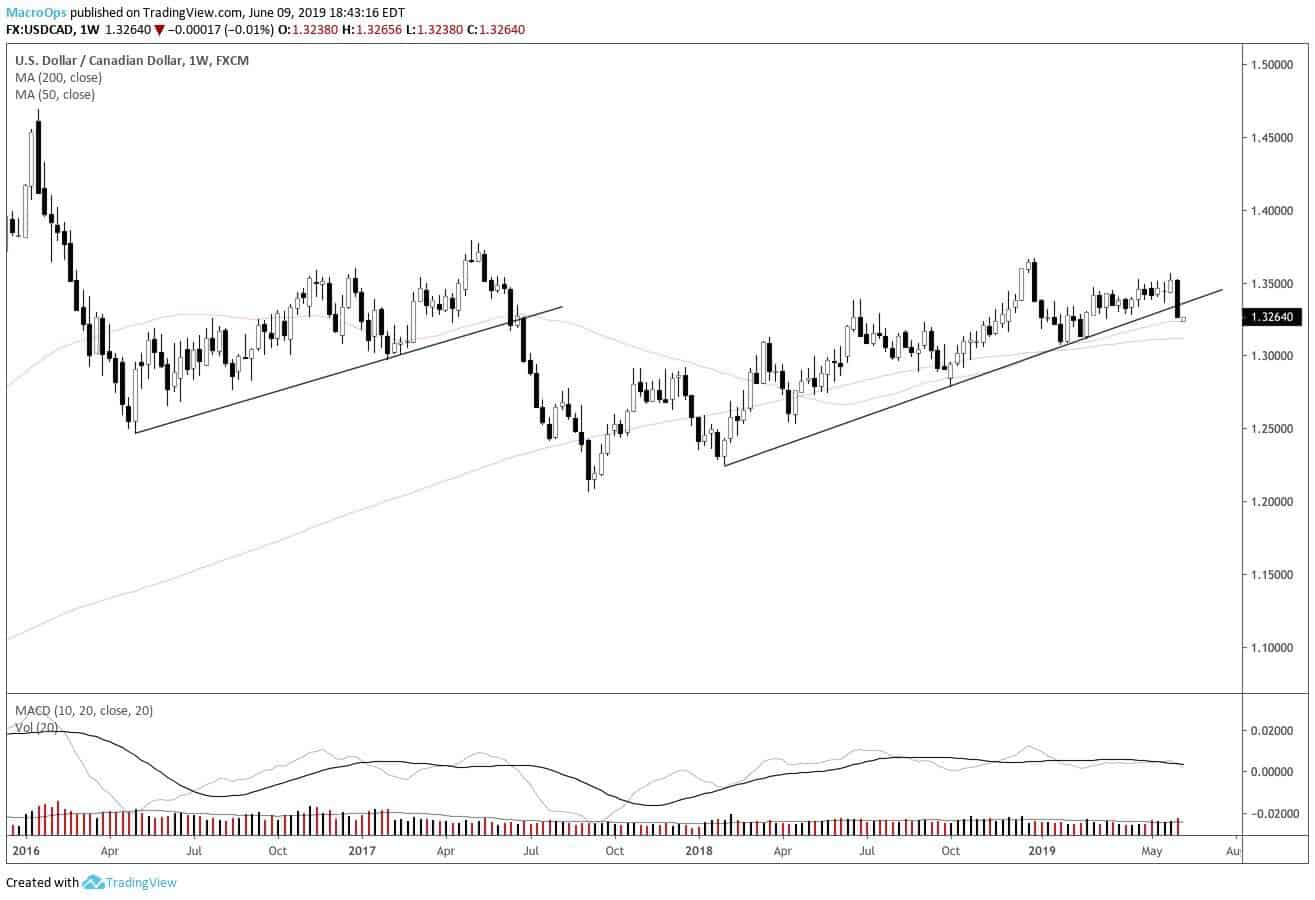
1. USDCAD has broken below a major support line (chart is a weekly).
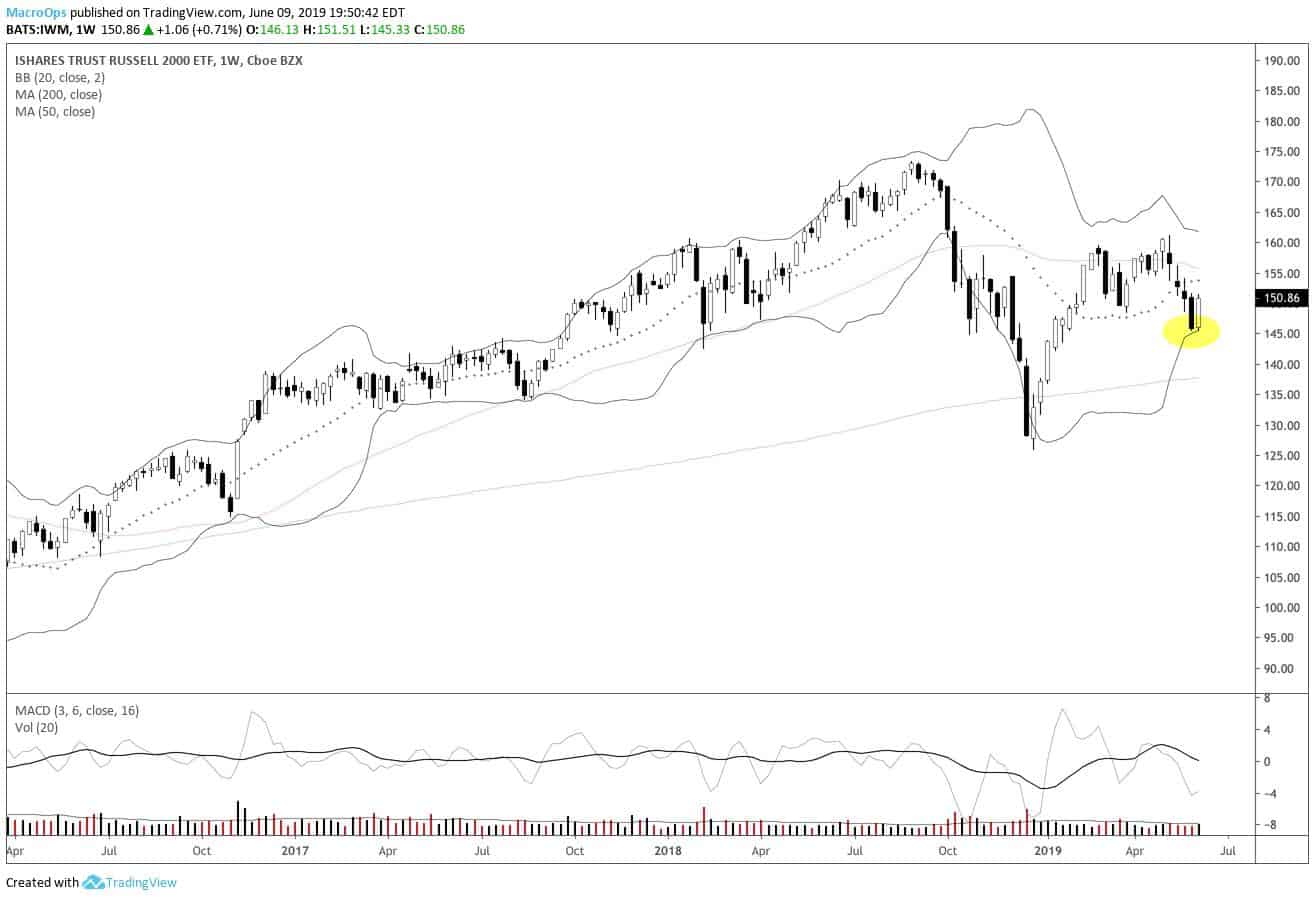
2. Small-caps (IWM) bounced off their lower Bollinger Bands this past week (chart is a weekly).
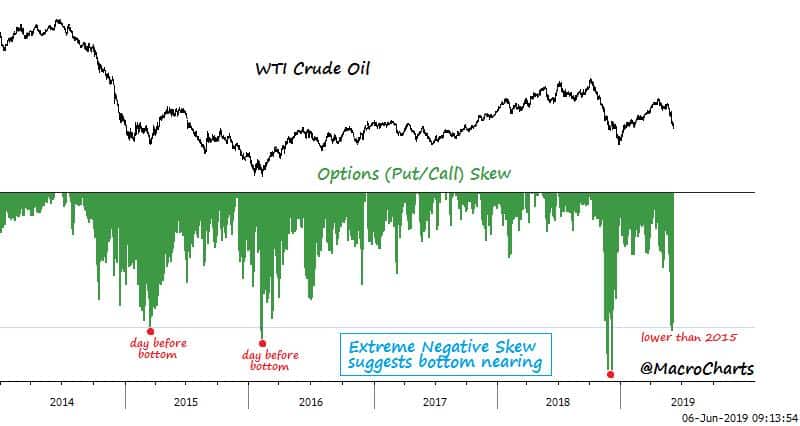
3. As did crude (CL_F) (chart is a weekly).

4. Crude’s skew is at extremes suggesting a bottom is near (chart via @MacroCharts).
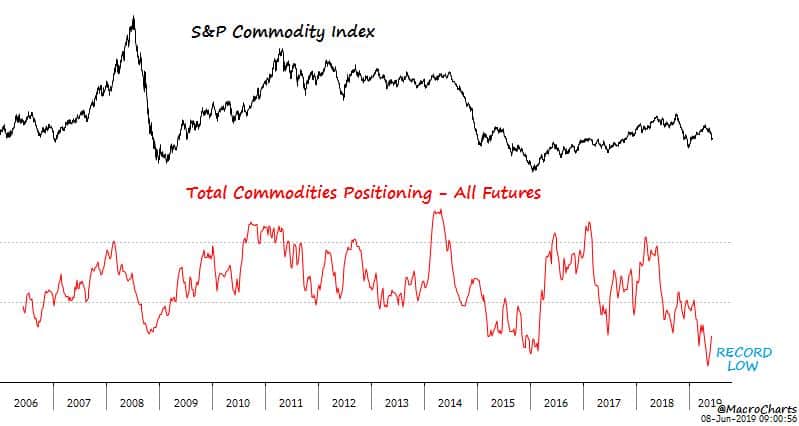
5. Total spec positioning in commodities futures at RECORD low levels (chart via @MacroCharts).
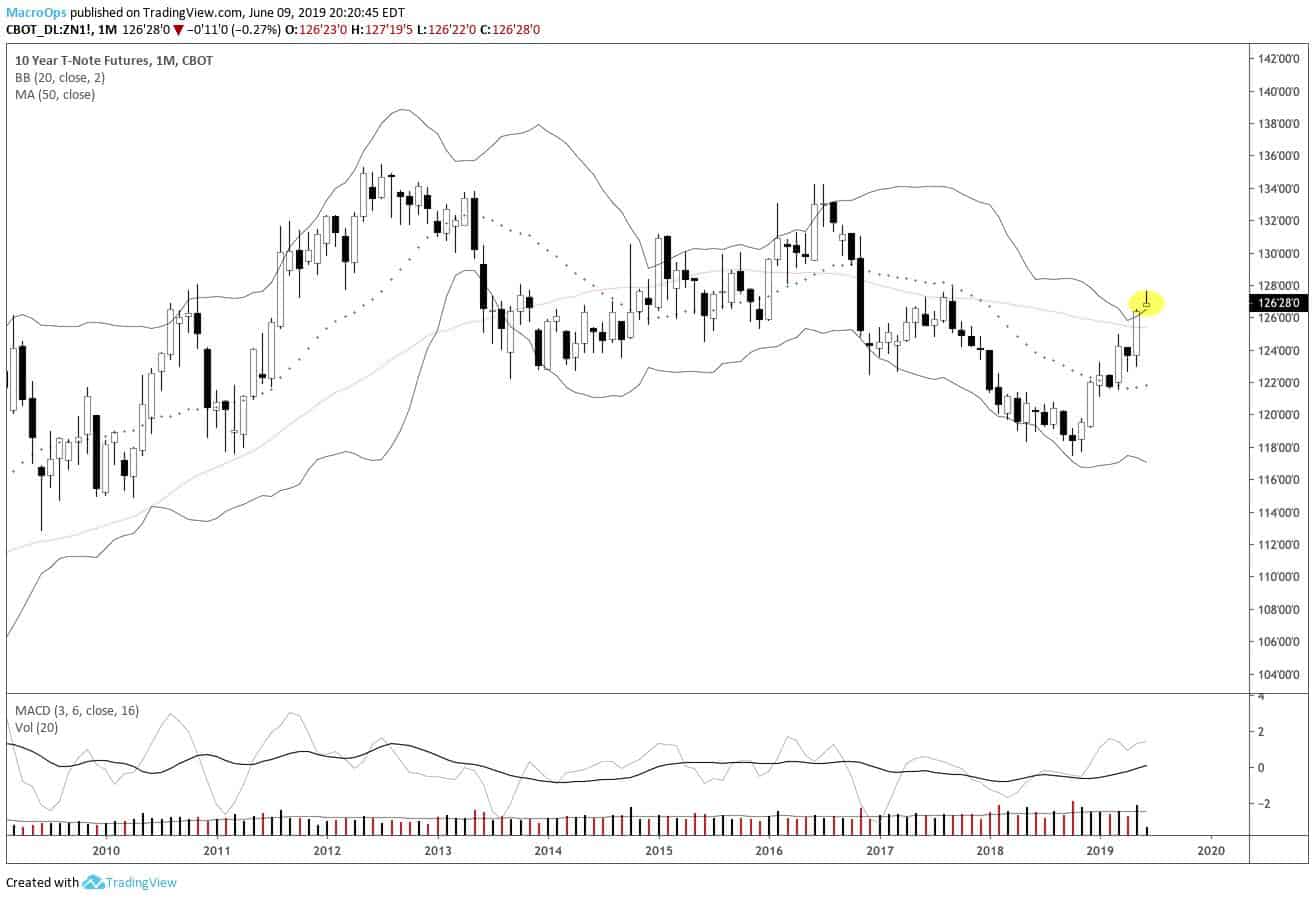
6. 10-year USTs (ZN_F) are trading above their monthly Bollinger Band. Reversal coming soon?
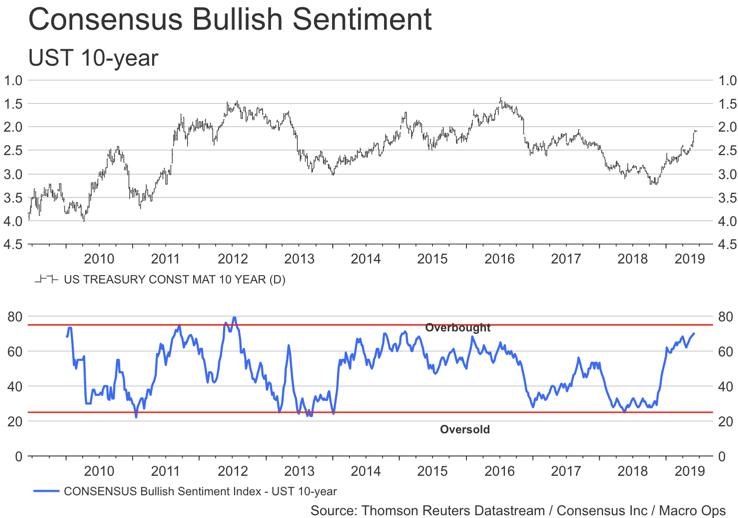
7. Consensus Inc. UST 10yr bullish sentiment nearing overbought levels.
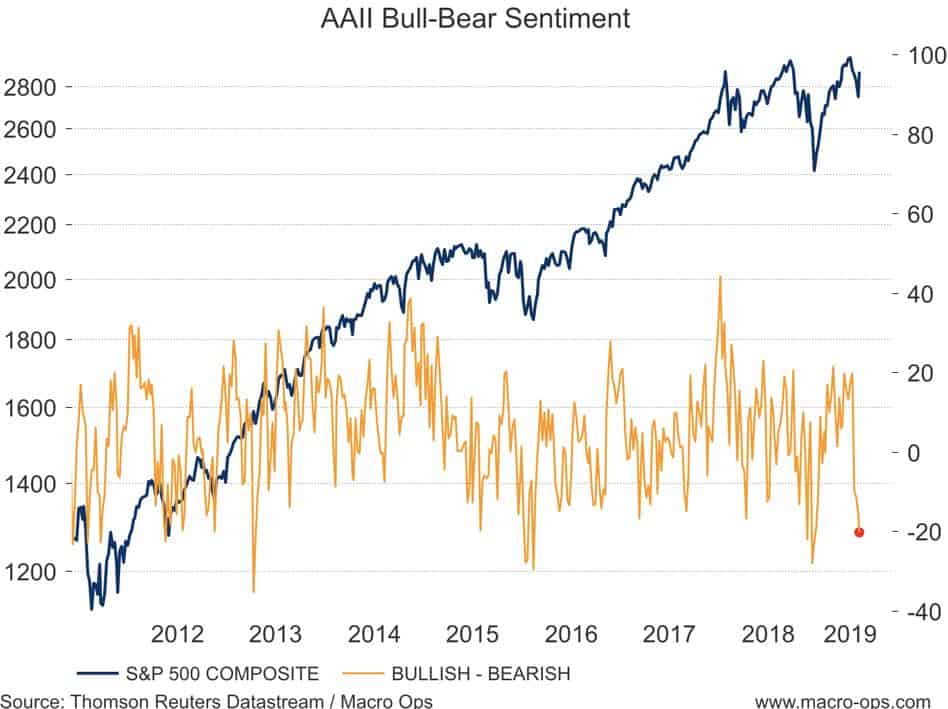
8. AAII Net Bull/Bear Sentiment near Dec 18’ lows despite recent rally in stocks.
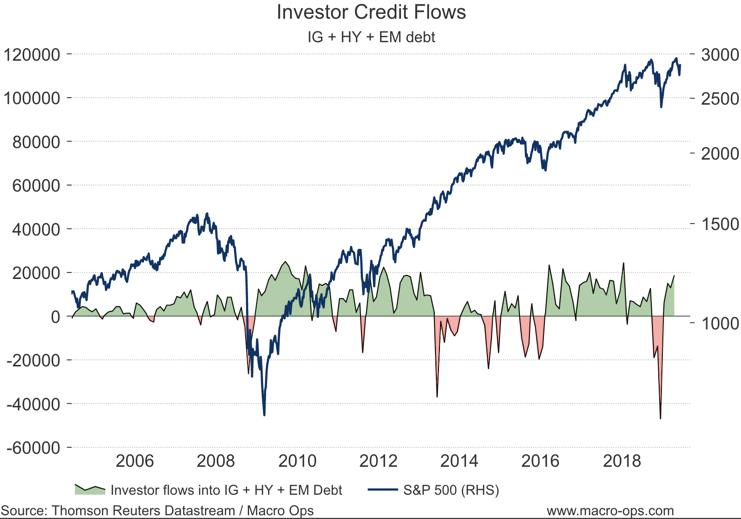
9. Investors continue to pile into credit after record outflows in December. This is a bullish sign for stocks as credit tends to lead equities.
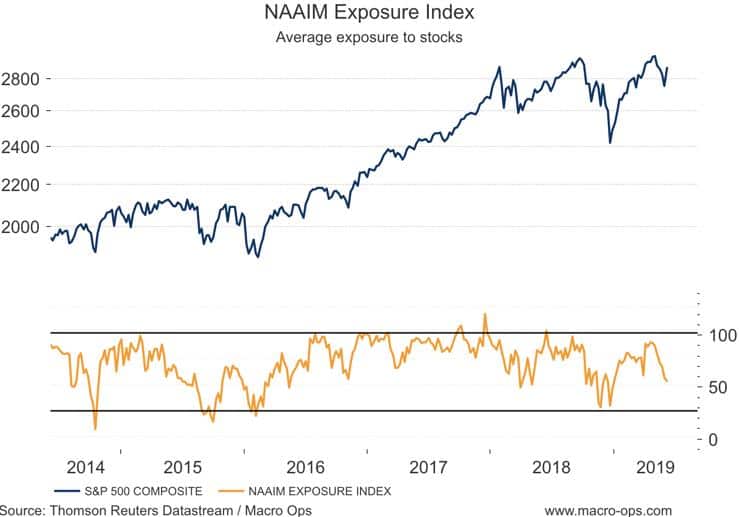
10. NAAIM Exposure Index shows that investors are not buying this rally.
11. Morgan Stanley’s US Cycle indicator recently entered the “Downturn” phase.

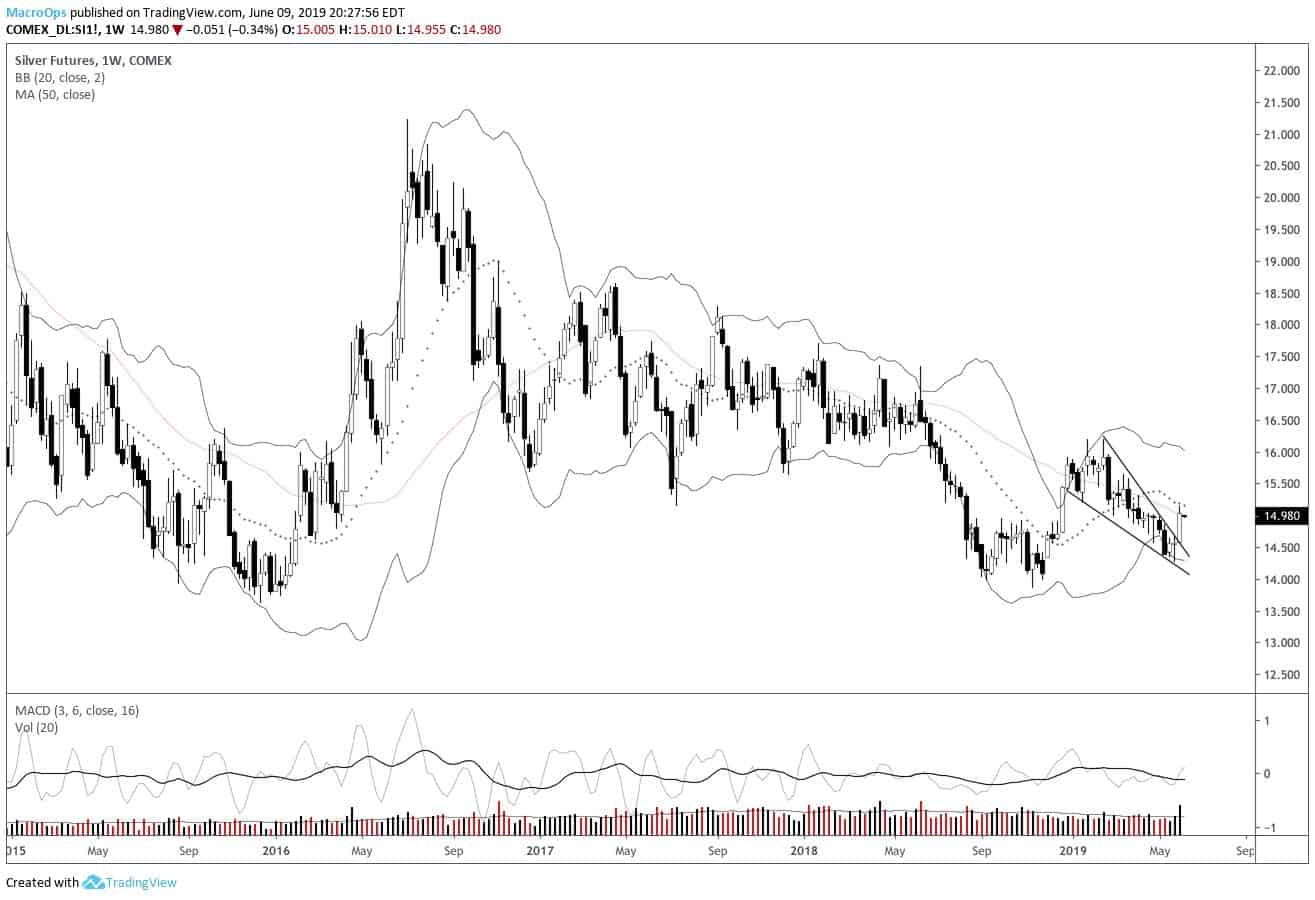
12. Silver (SI_F) broke out of a descending wedge last week on strong volume. Commercial hedgers are net-long silver for only the second time in history.