Technical analysis reflects the voice of the entire marketplace and, therefore, does pick up unusual behavior. By definition, anything that creates a new chart pattern is something unusual. It is very important for me to study the details of price action to see if I can observe something about how everybody is voting. Studying the charts is absolutely critical and alerts me to existing disequilibria and potential changes. ~ Bruce Kovner
Good morning!
In this week’s Monday Dozen we take a look at anxious markets and discuss the fuss over the inverted yield curve, plus we check in on liquidity, sentiment, and relative valuations and end with a sector that has all three going for it.
1) In last week’s Musings I shared a compilation of recent front-page newspaper headlines warning about an imminent recession, a painful bear market, and general hysteria over an inverted yield curve. My weekly copy of The Economist arrived yesterday in the mail with the following cover. I’m not aware of any significant market top in history that was so widely predicted by the mainstream media. #sentimentcheck

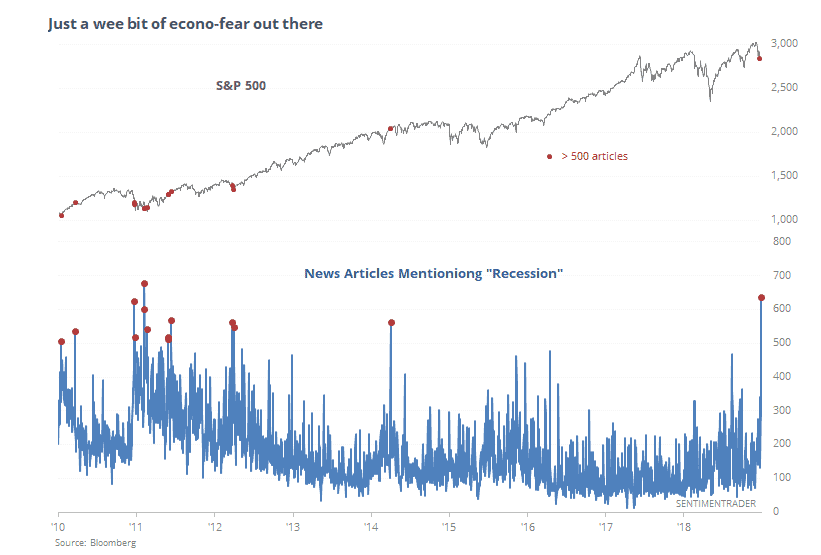
2) This great chart from Sentiment Trader shows just how loud the recession calls have become.
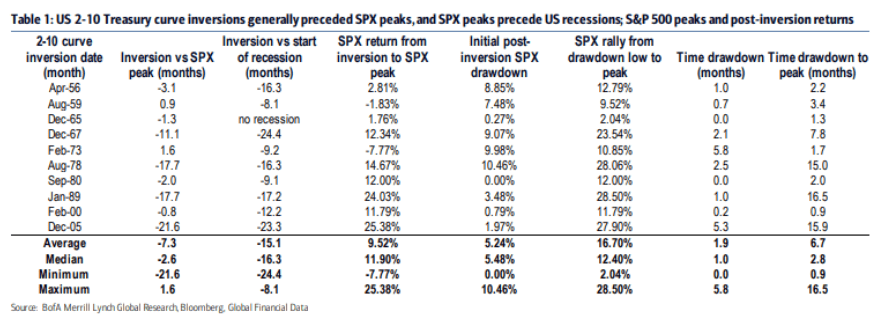
3) I wrote earlier in the year about why the “recession signaling” ability of the yield curve may not be as reliable this time around (link here). Regardless, an inversion of the 2-10 yield curve precedes a top in the SPX by an average of 7.3 months where the SPX averages a gain of 9.52%. It’s important to keep in mind that in markets the more something is closely observed the more likely it is to be altered in the process and/or already priced in.
4) Rather than being prescient in their recession calls, maybe the media is late? NDR’s Global Recession Probability Model has been signaling a high likelihood of a global recession since the middle of last year when much of the world entered a downturn. Global ex. US recessions last 14-months on average which would put the current global slowdown ending sometime in the next few months (chart via NDR and CMG Wealth).

5) BofAML’s Composite Recession model is still showing a very low likelihood of a US recession in the near-term.

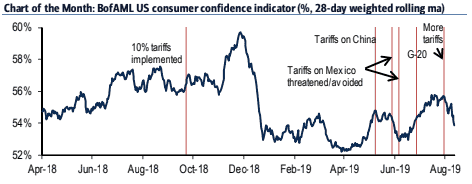
6) BofAML’s US Consumer Confidence Indicator shows that Trump’s trade war hasn’t been helping with the overall mood of things. But it looks like the latest market vol is getting to the Tweeter in Chief and the odds are rising that he’s going to fold his hand.
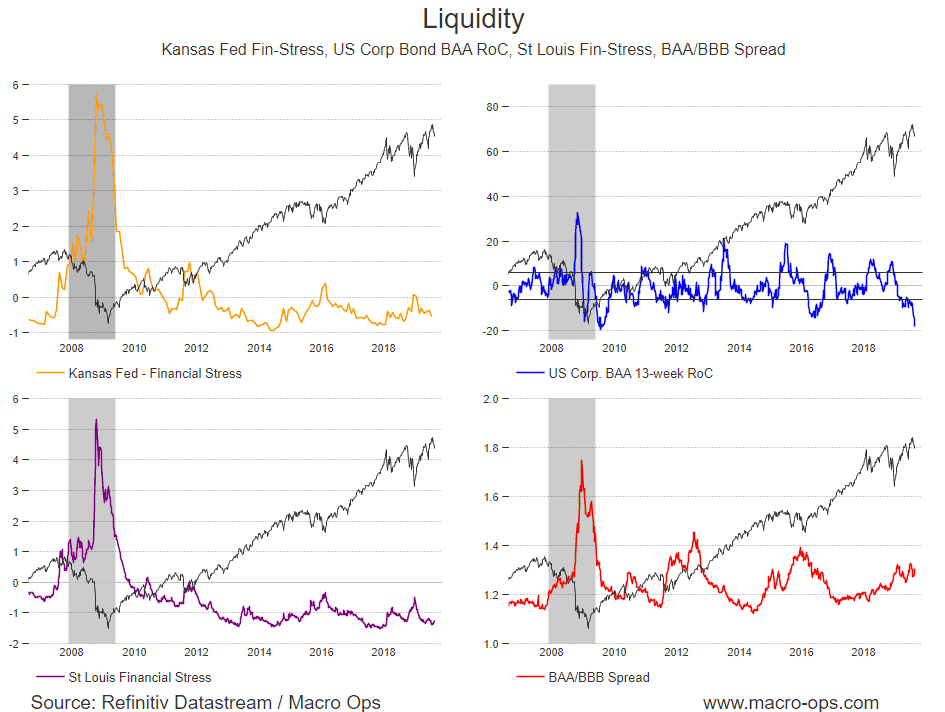
7) Liquidity is still very loose… Both Kansas and St. Louis Fed show little financial stress in the system, the 13-week rate-of-change in BAA bond yields is at its lowest point since the GFC (which make stocks more attractive on a relative basis), and BAA/BBB bond spreads are somewhat elevated but still below levels that should cause concern.
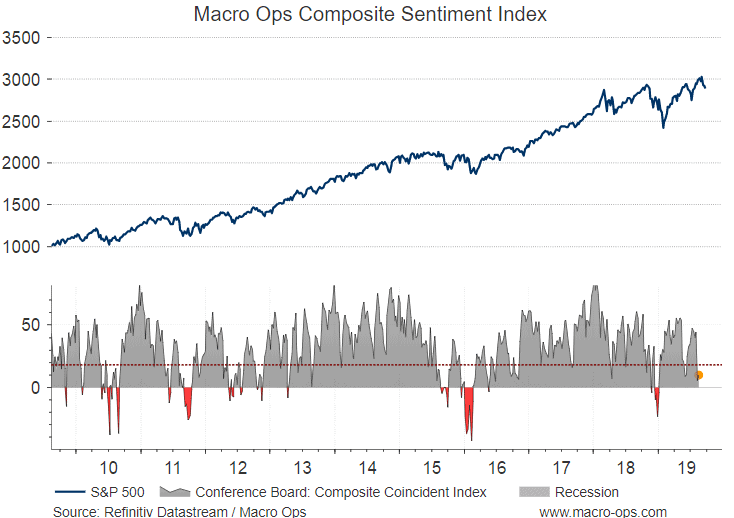
8) The MO Composite Sentiment and Positioning Index is now in buy territory (below the horizontal red line). I’d like to see it go negative but as of now the conditions have been met to switch my bias from bearish to bullish/neutral. My base case is that we see a rise from here followed by more sideways chop and vol but the larger macro conditions look to be setting up for another major global rally starting before year’s end. We’re just waiting on a catalyst (European stimulus, Chinese Stimulus, uber dovish Fed etc…).
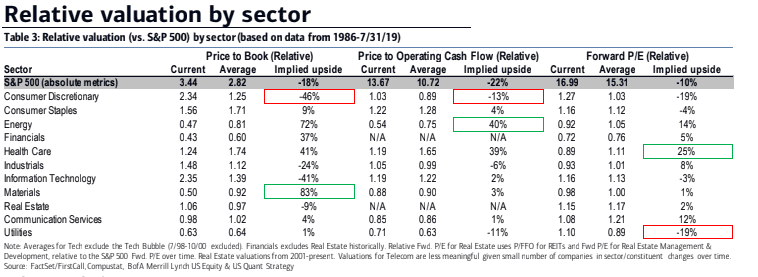
9) Relative sector valuations show that materials and energy are trading on the cheap (chart via BoAML).
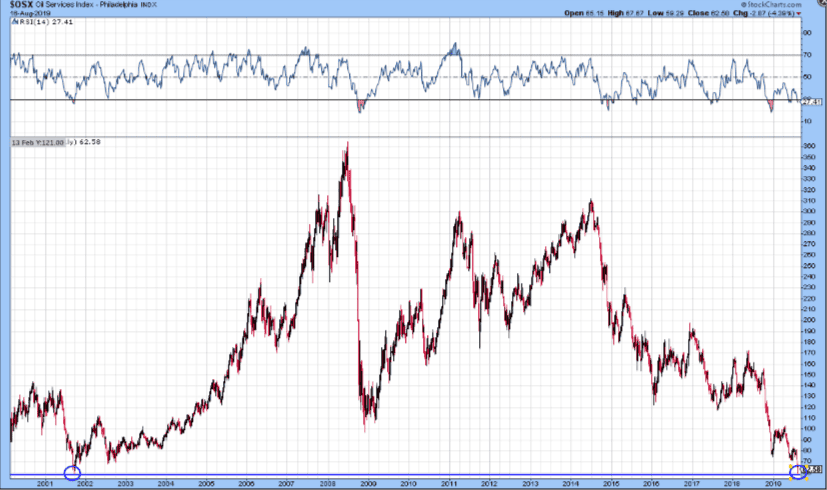
10) Speaking of energy, according to Sentiment Trader “The oil services fund is showing a pretty drastic drop in optimism over the past 2 weeks. According to the Backtest Engine, it’s only been this bad twice before.”

11) Jesse Stine shared the following in his latest market letter (link here),“Oil servicers nailed it to the penny on Thursday. Sure smells like a cycle low is close.” I agree.
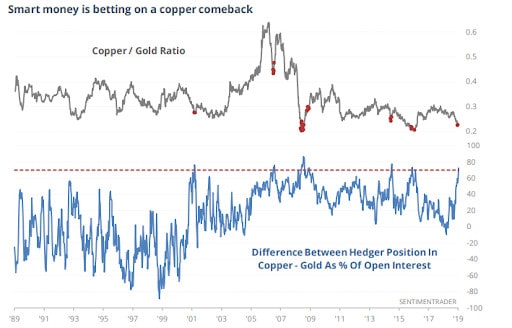
12) Also from that same letter and via Sentiment Trader is this great chart showing the difference between Hedger positioning in copper relative to gold as a % of opening interest. A reversal in the key copper/gold ratio would spell trouble for long bonds. To understand why you can read my writeup on the hierarchy of markets here.