Economic history is a never-ending series of episodes based on falsehoods and lies, not truths. It represents the path to big money. The object is to recognize the trend whose premise is false, ride that trend, and step off before it is discredited. ~ George Soros
Good morning!
In this week’s Monday Dozen we ask the question: Is FX volatility the last shoe to drop? Plus, we have wage growth and rising margins in the eurozone, fund managers pulling money out of EM, and a big-data machine-learning analyzing the US economy.
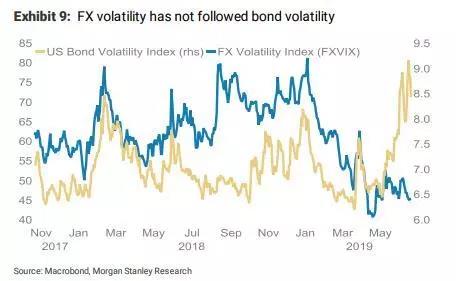
1) Back in March, I wrote a piece titled “There’s a Big Macro Move Brewing in Markets” noting the compressed volatility across the wide range of macro instruments; from rates and precious metals to major FX pairs. Since then, we’ve seen bond volatility rip (chart via MS).
2) And then precious metals vol followed… Vol compression regimes tend to lead to expansionary regimes (ie, big trends).

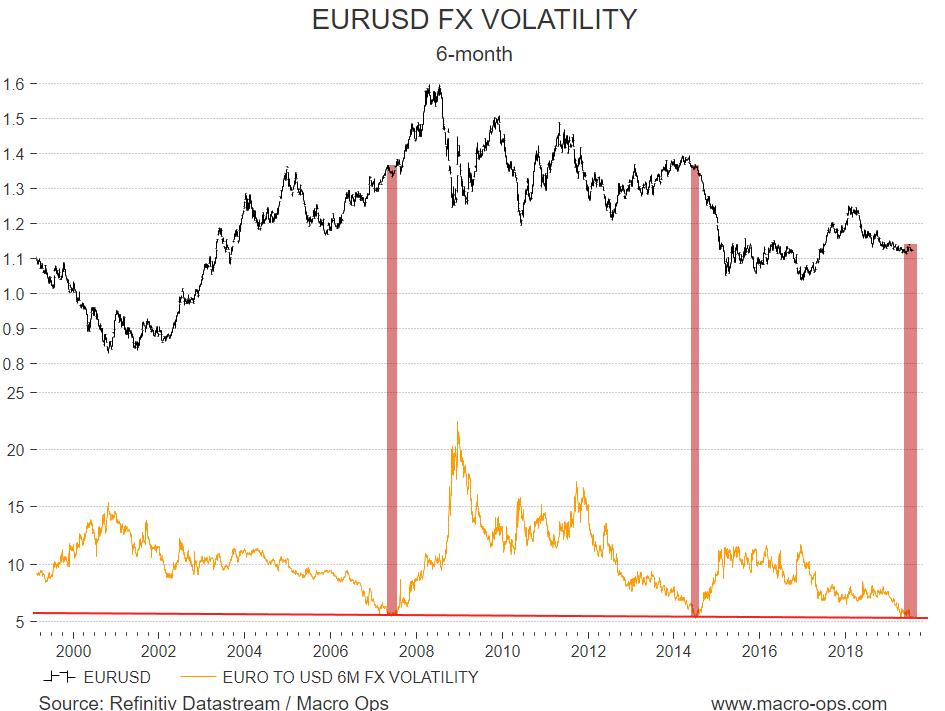
3) Now we’re waiting for the last shoe to drop (major USD pair FX volatility). EURUSD 6-month vol has only been this low two other times (2007 & 2014). Both compression zones led to massive trends. Vol compression doesn’t dictate direction, it just signals that a major move is coming. But… gold does tend to lead USD at major turning points and rising gold points to a lower dollar.
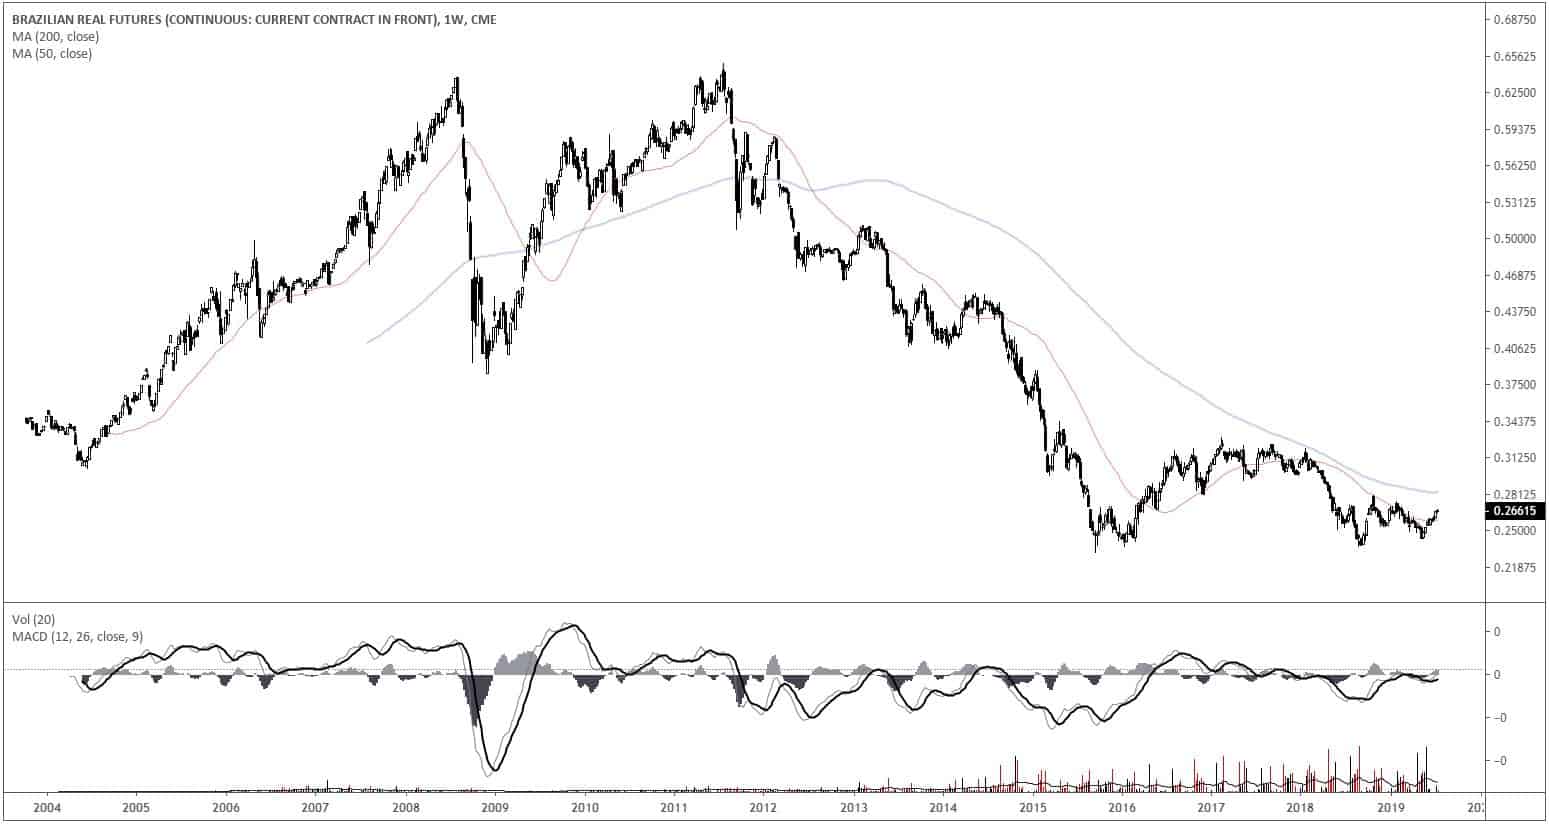
4) There are a lot of good looking long-term USD pair charts out there (USDJPY, EURUSD, USDMXN, USDCAD, USDCHF etc…). Here’s a weekly of the Brazillian real. If this were a stock, would you want to buy it or sell it?
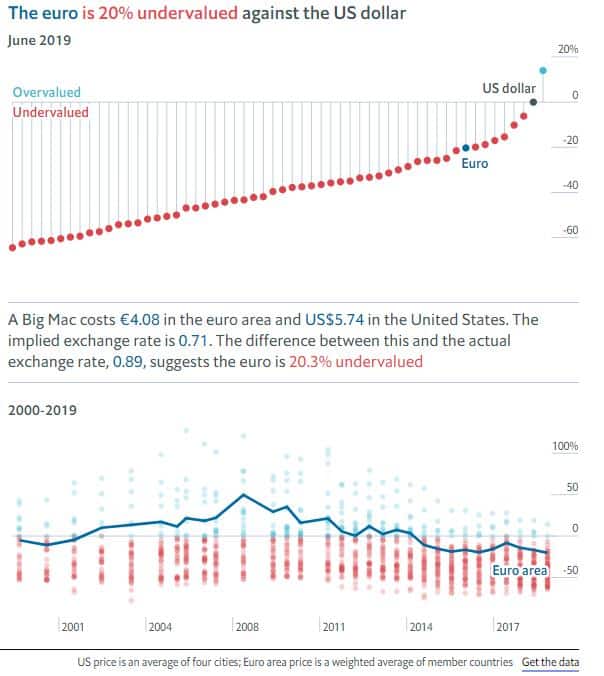
5) The US dollar is one of the most overvalued currencies in the world right now, according to a number of valuation measures. Here’s The Economist’s Big Mac index, showing that the euro is over 20% undervalued relative to the dollar.
6) The history of the dollar in 7-year cycles. The early 80s bull market in USD lasted 1,650 days. The late 90s bull, 1,719 days. If the current dollar bull market is, indeed, still alive, it’ll be the longest at 2,063 days and counting.

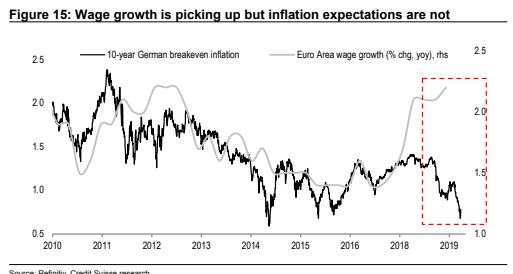
7) Euro area wage growth is picking up while inflation breakevens are plummeting. I’m guessing this divergence closes with breakevens ripping higher — think what that may do to European bonds currently yielding sub-zero (chart via Credit Suisse).
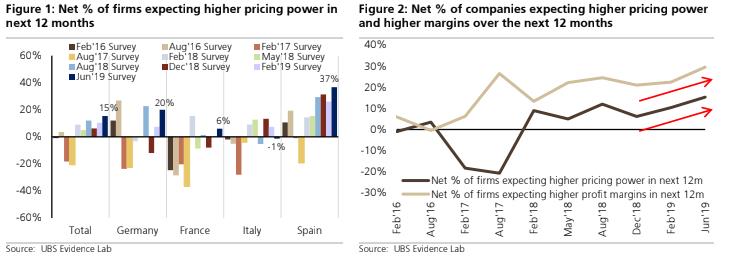
8) UBS’s Evidence Lab finds that European corporates are turning more optimistic on their pricing power and subsequent margin expansion over the next 12-months.
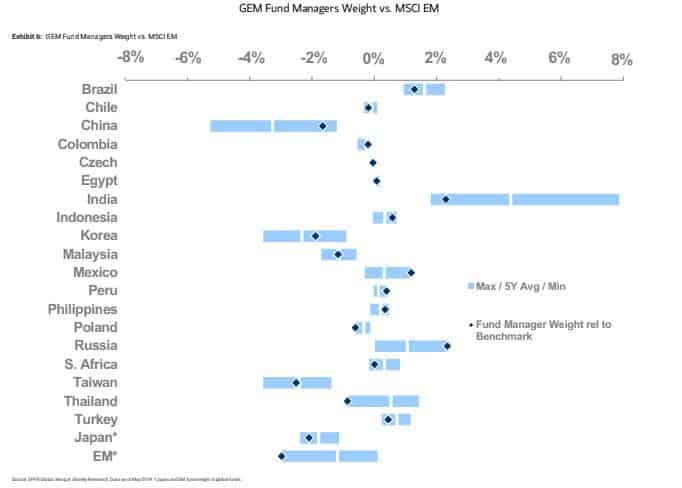
9) GEM fund manager weight versus the MSCI Emerging Market index relative to their 5-year average/min/max. The graph shows that fund managers are underweight EM relative to the index and their 5-year average (chart via MS).
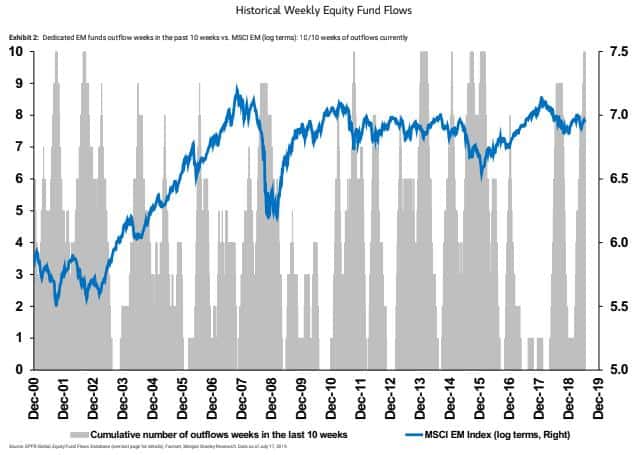
10) And investors have been pulling their money out of emerging markets for 10 out of the last 10 weeks (marked by gray vertical bars).
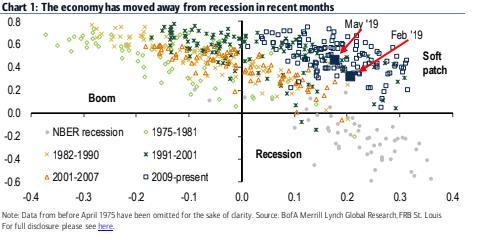
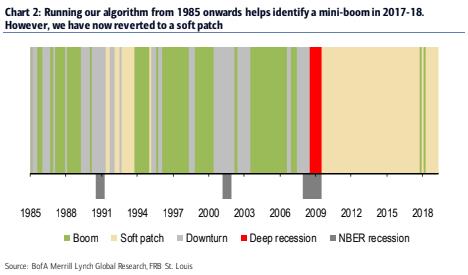
11) BofAML’s big-data machine-learning US Business Cycle Indicator shows that the US economy is moving away from a recession regime and into a “soft patch”.
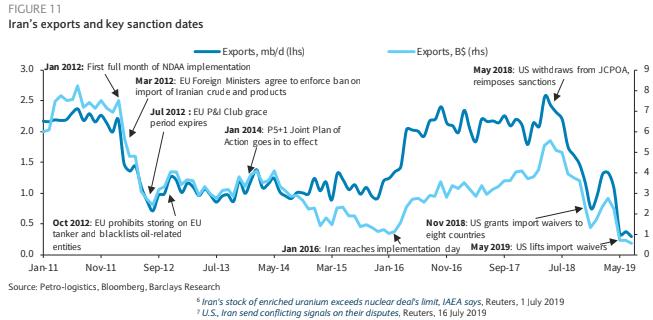
12) This chart from Barclay’s shows Iran’s exports and key sanction dates. Iran has gone from exporting over 2.5 mb/d in 2018 to less than 1mb/d today. When the current deceleration in global growth bottoms, the oil market may become a bit tight…