“The best trades are the ones in which you have all three things going for you: fundamentals, technicals, and market tone. First, the fundamentals should suggest that there is an imbalance of supply and demand, which could result in a major move. Second, the chart must show that the market is moving in the direction that the fundamentals suggest. Third, when news comes out, the market should act in a way that reflects the right psychological tone.” ~ Michael Marcus
In this week’s Dirty Dozen [CHART PACK] we continue to push back on the bears, dissect the negative divergence in a key market internal to show why it should be ignored, go over confirming breadth measures, rising tanker prices, and more…
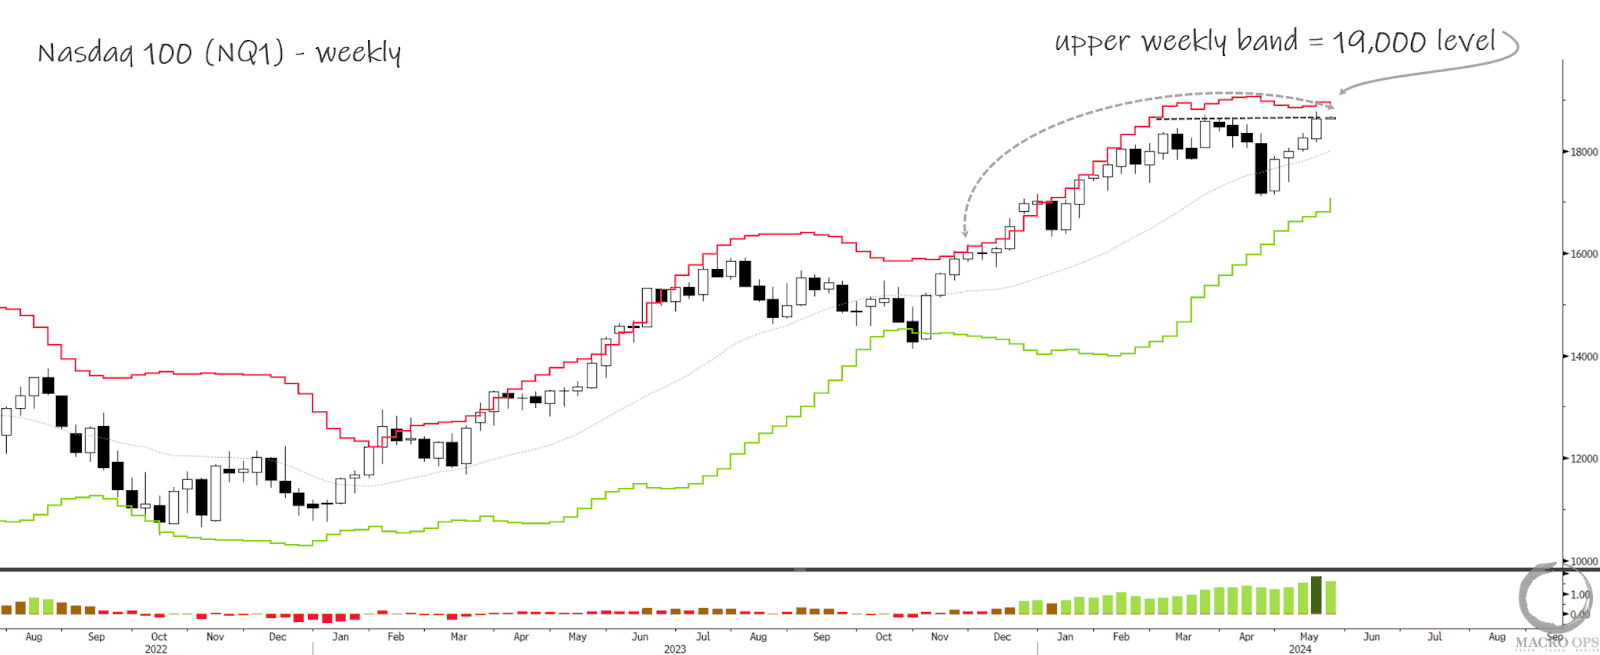
- The play continues to be to buy dips and add on rips and not overthink this trend. We got a new weekly all-time closing high on Friday. The next level of resistance is the upper weekly band at 19k. My best guess is that we see some sideways compression for a couple of weeks along this resistance point, similar to the action we saw in Nov/Dec 23’.
- As we noted last week the only negative development we’re seeing as far as market signals go, is in our Market Internals Aggregator which dropped further last week (chart on bottom right).
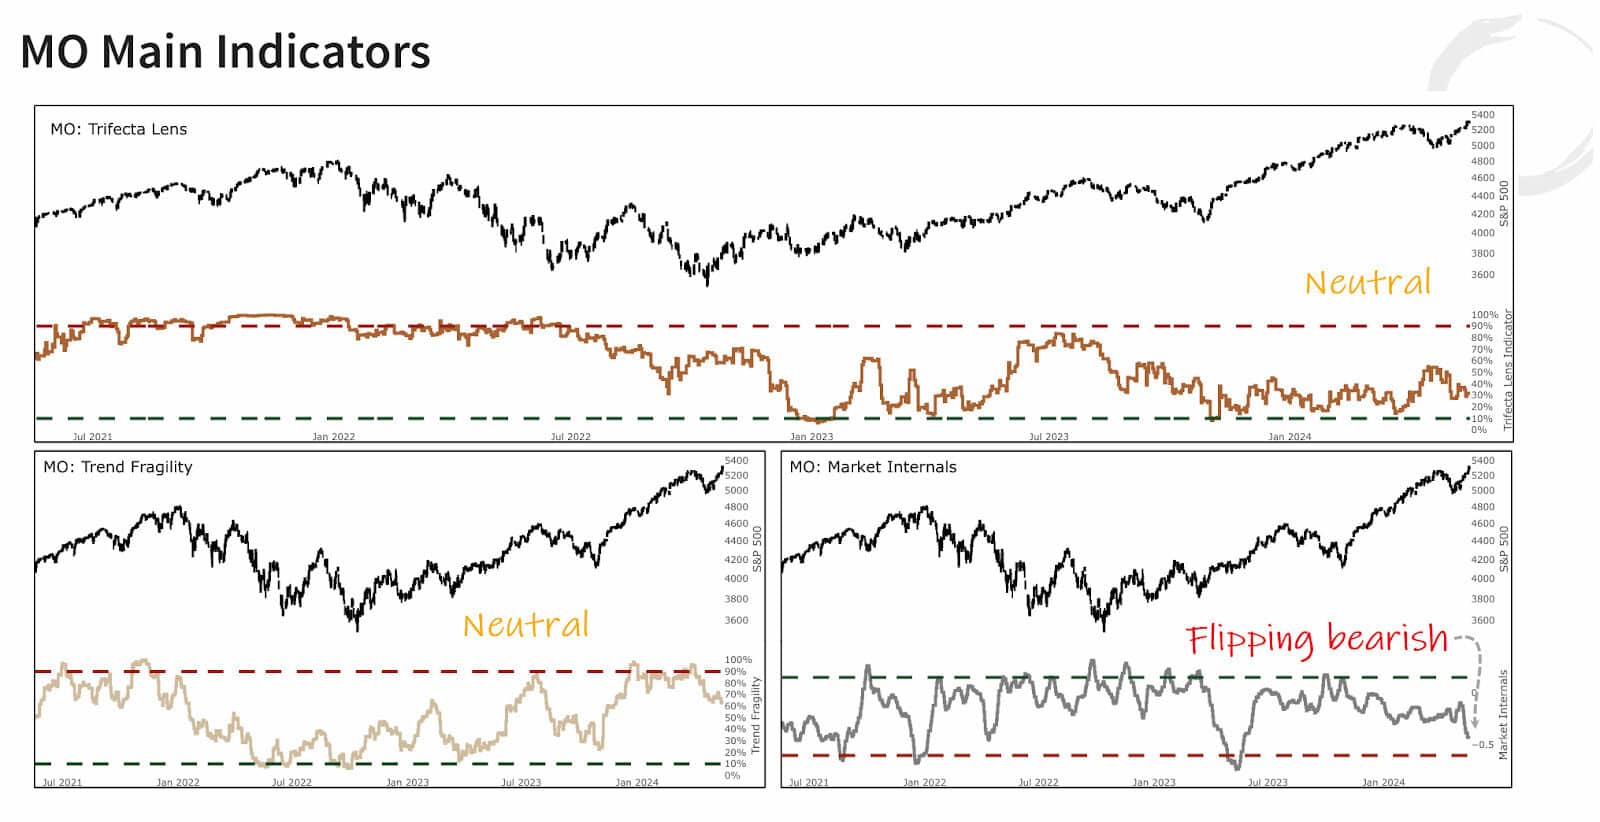
- The primary culprit behind this drop is cyclical vs defensive. We can see that the other internals, for the most part, remain supportive of the broader uptrend.
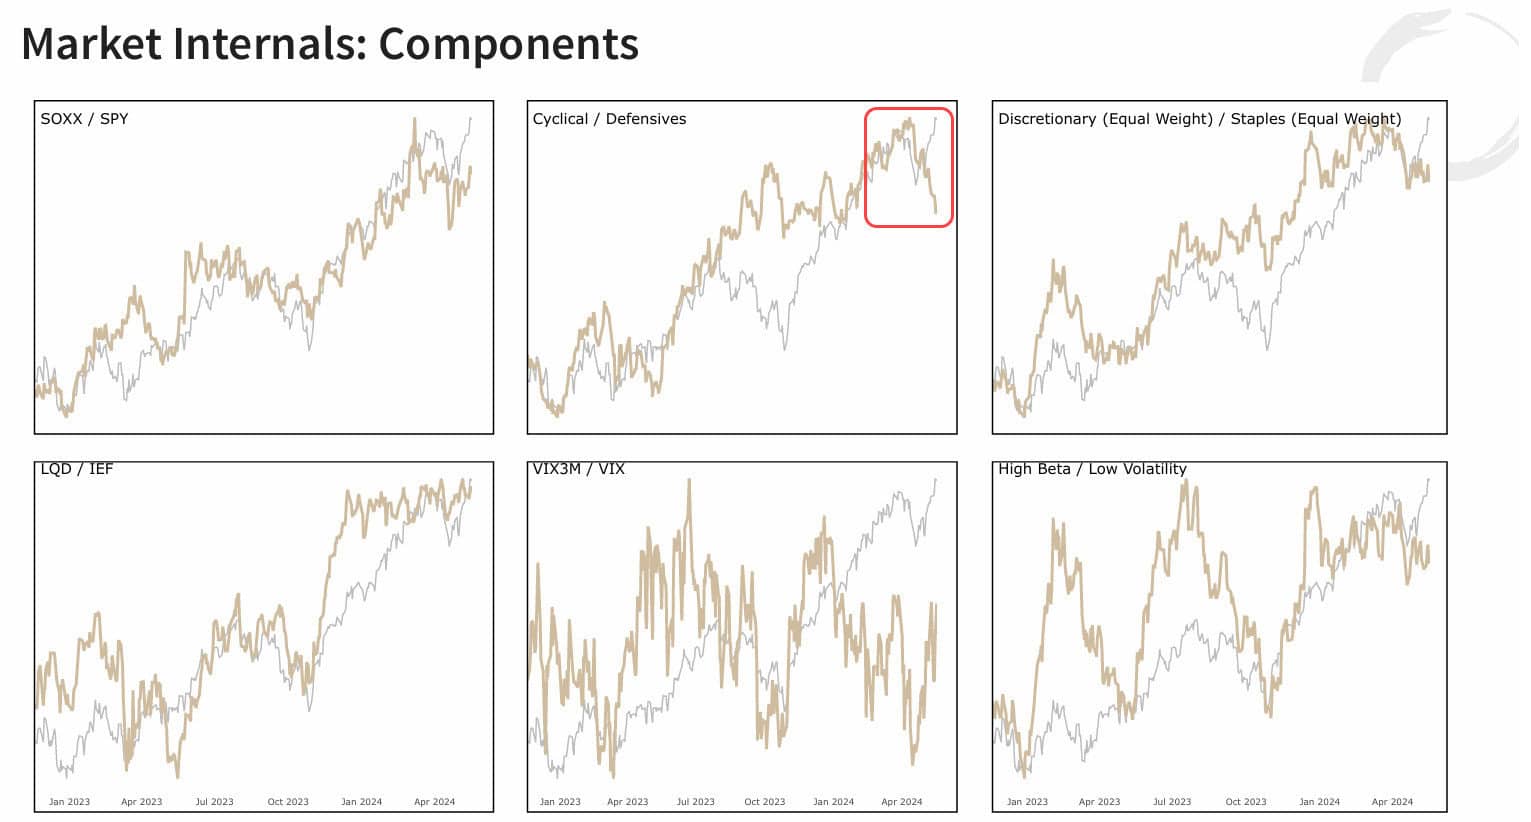
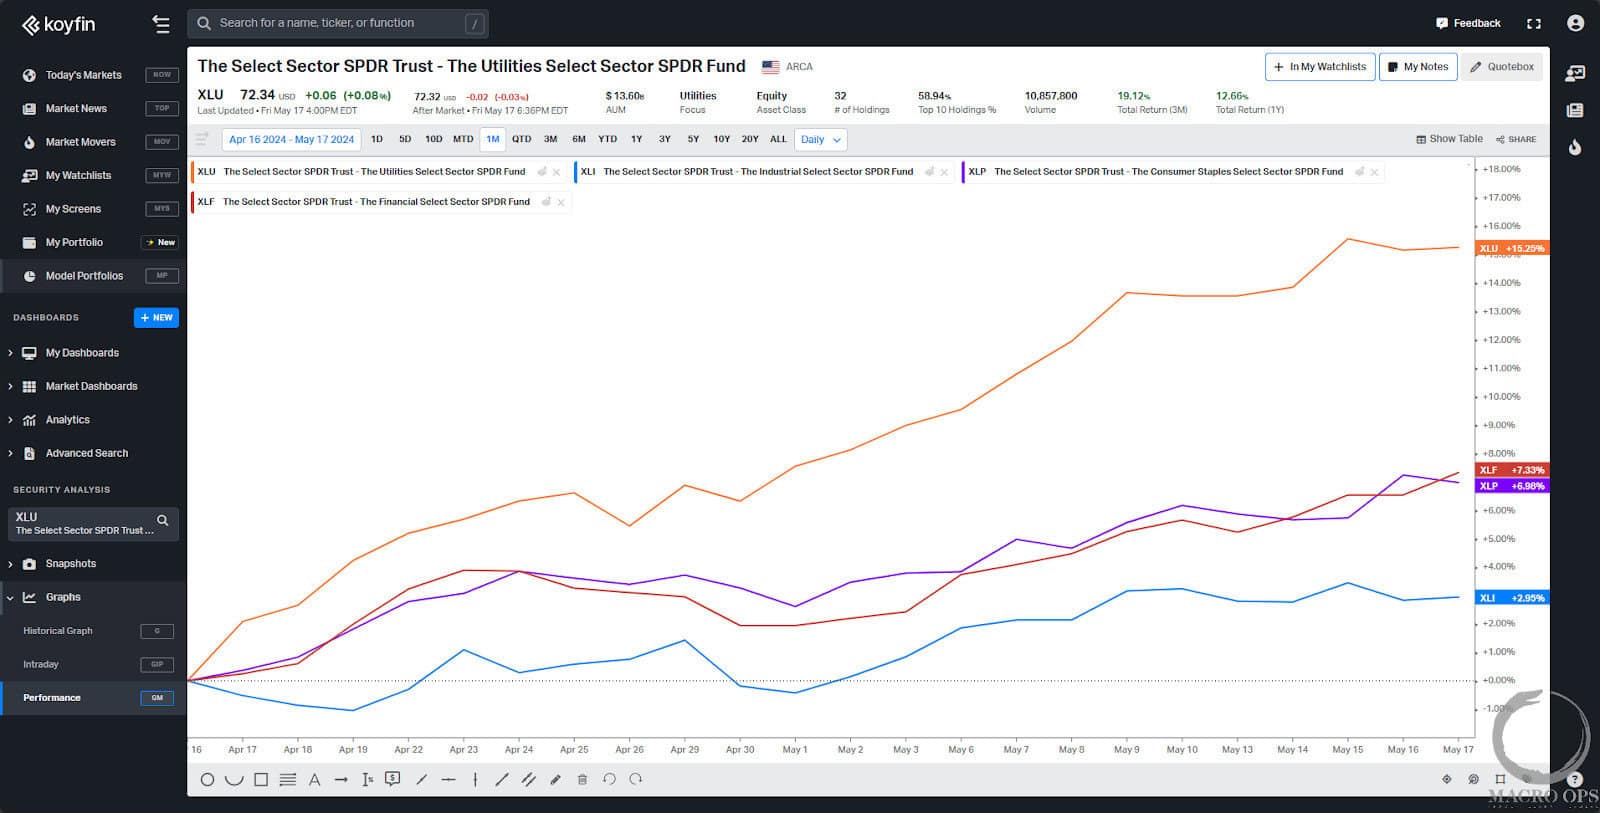
- When you see something anomalous like this you need to dig in to discern whether it’s signal or noise. Cyc v Def is comprised of (Industrials + Financials / Utilities + Consumer Staples). Looking at the one-month performance chart below of these four sectors we can see that the drop in Cyc v Def isn’t so much due to poor performance from our cyclical sectors but rather due to strong outperformance from the utility sector.
Now usually when you see the utility sector begin to outperform it’s a bearish sign that the market is pricing in slower growth and so capital begins to seek out safety. But this time around, it’s not that. The run in XLU is due to latecomers FOMO’ing into the AI theme. They’re buying utilities on projections of data center energy demands and because they’re afraid to buy the direct plays as they’ve “gone up too much”.
This means we should pay less attention to our aggregate internals indicator for the time being, and more attention to how the other individual components continue to trade.
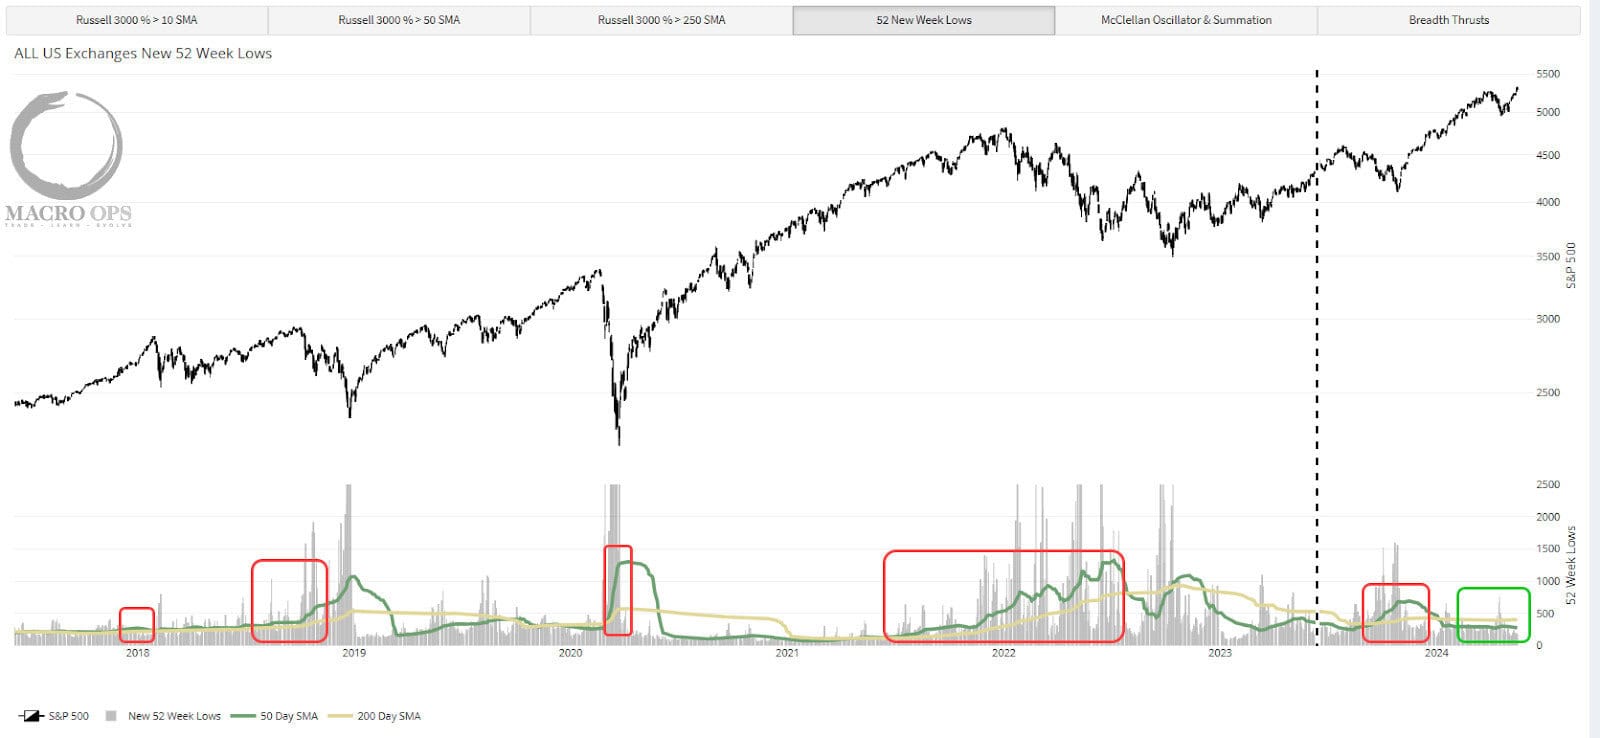
5. Another simple data point we track each week is all US exchange new 52-week lows. Specifically, we look for crossovers in the 50-day moving average (green line) and the 200-day average (yellow line). When the green line crosses above it means broader market breadth is deteriorating, and vice versa when it crosses below the 200dma. It currently remains firmly below the 200-day.
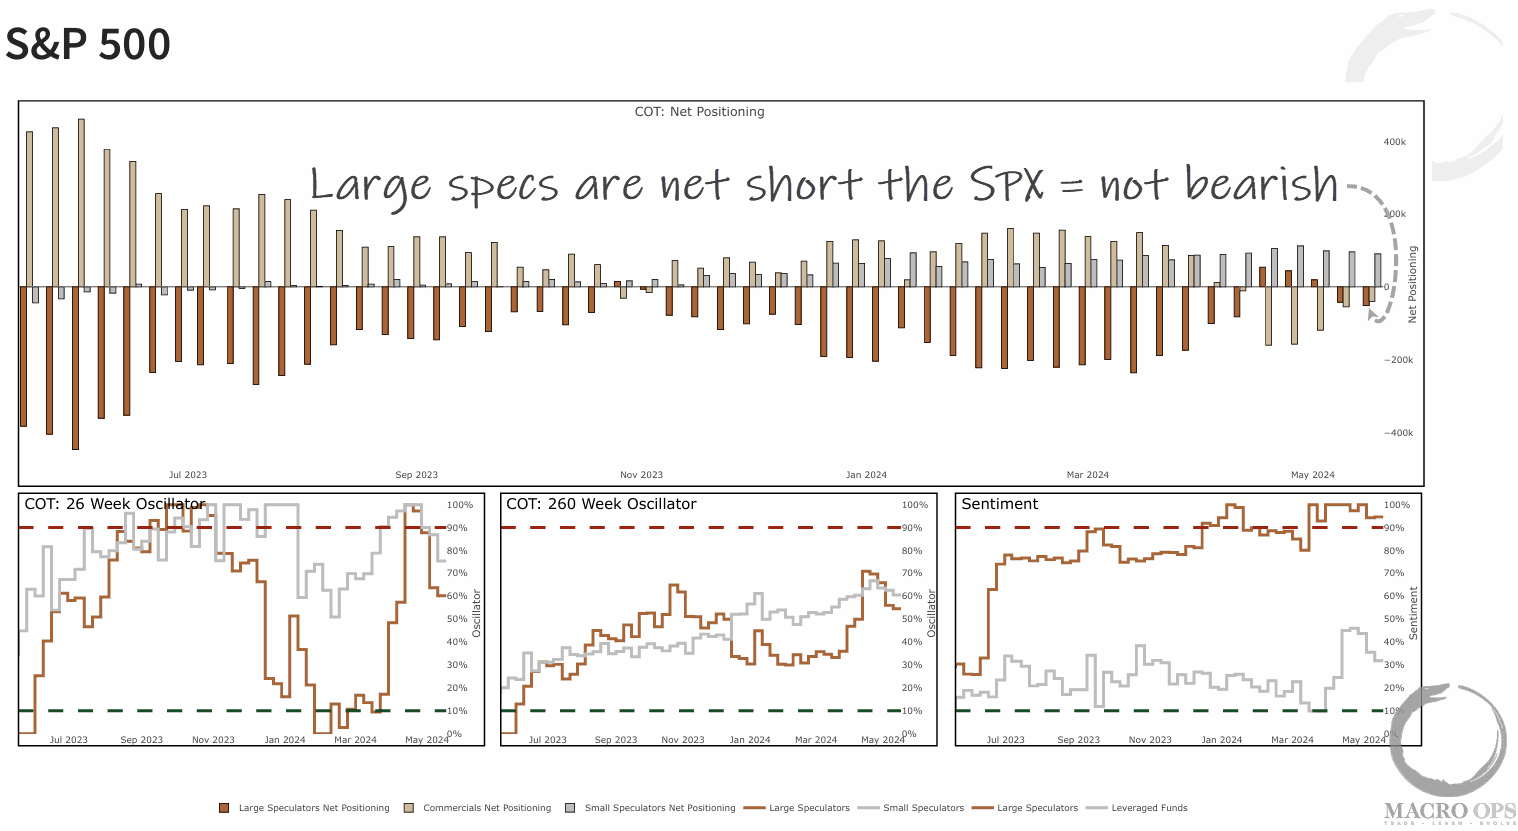
6. Large specs increased their short position in the SPX last week. Again, this is just another thing you don’t typically see at tops.
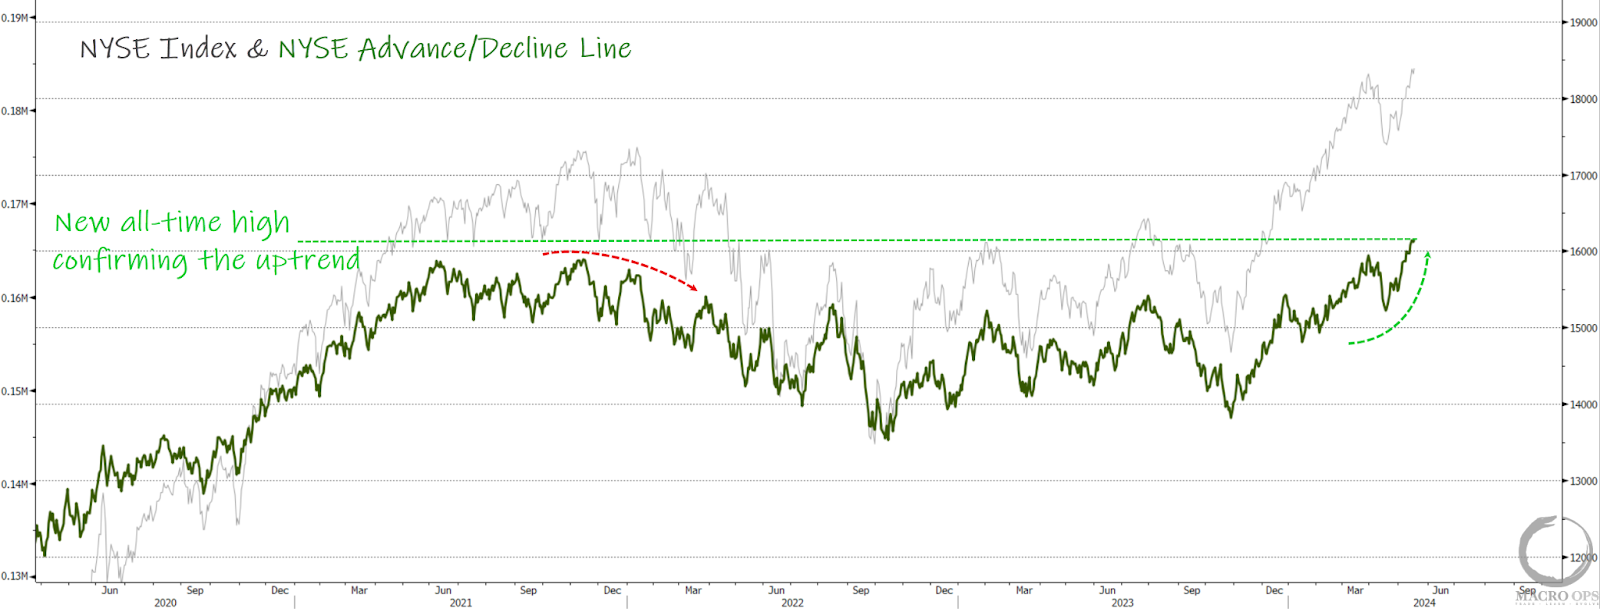
7. And not to beat a bullish horse to death but the NYSE advance/decline line is making new all-time highs, along with the index.
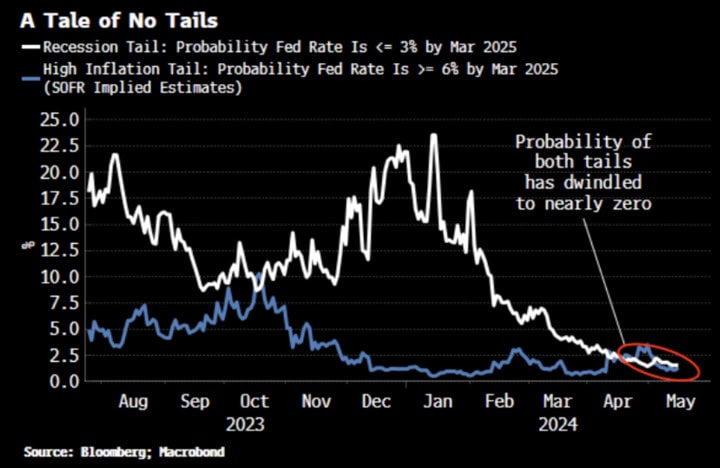
8. And just to keep things sober, I find this to be interesting from BBG’s Simon White:
“Not only are the twin tail risks of a downturn or resurgent inflation being ignored, but a near-impossible ‘immaculate acceleration’ of boomy growth and benign price appreciation is becoming the base case… we can estimate what the probability of those are by inferring from SOFR options the odds the Federal Reserve’s rate drops below 3% or rises above 6%.”

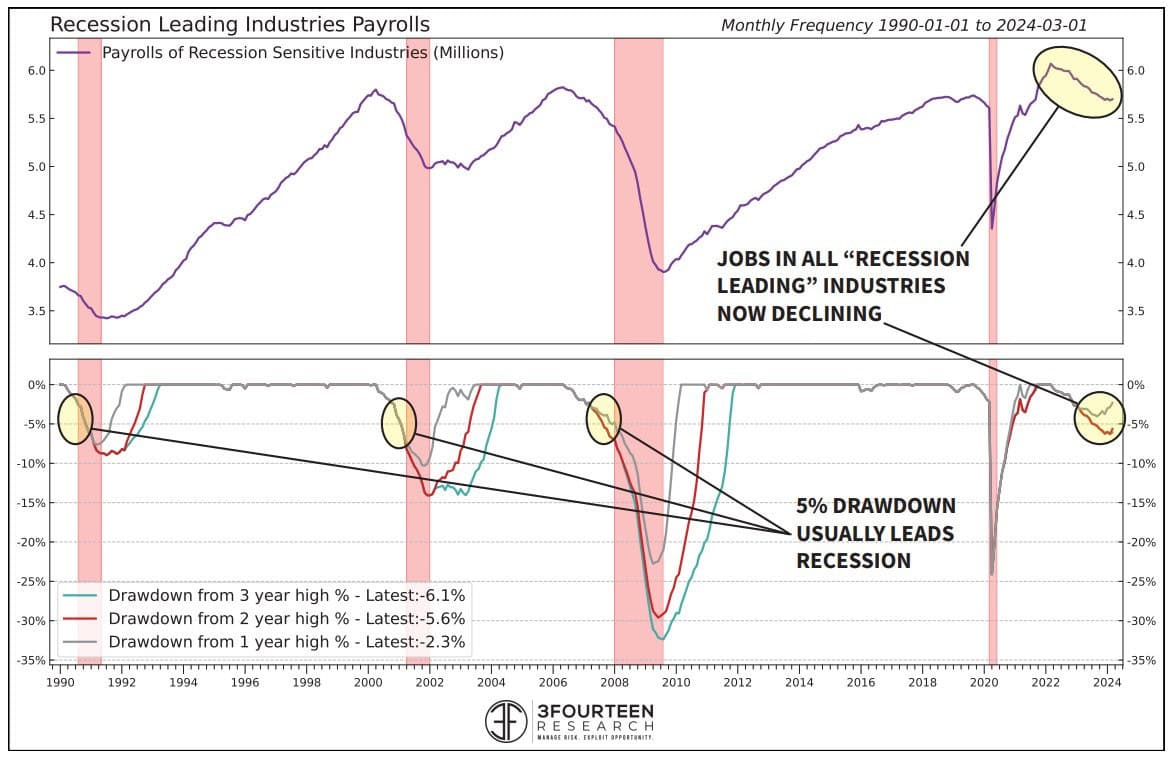
9. As well as this from @WarrenPies who wrote “The are early cracks forming in the labor market. We examined the +700 BLS industries to determine which have demonstrated the best leading tendencies into a recession. This group is now in a drawdown from 3, 2, and 1 year highs”.
My read of the current environment is that yes growth is cooling and along with it, the labor market. But these are from high levels and the data is still nowhere near the point where we should begin to start seriously entertaining concerns of a recession. In addition, we’re in an election year and this admin has shown itself willing to be aggressive in pulling whatever levers it needs to court voter favor.
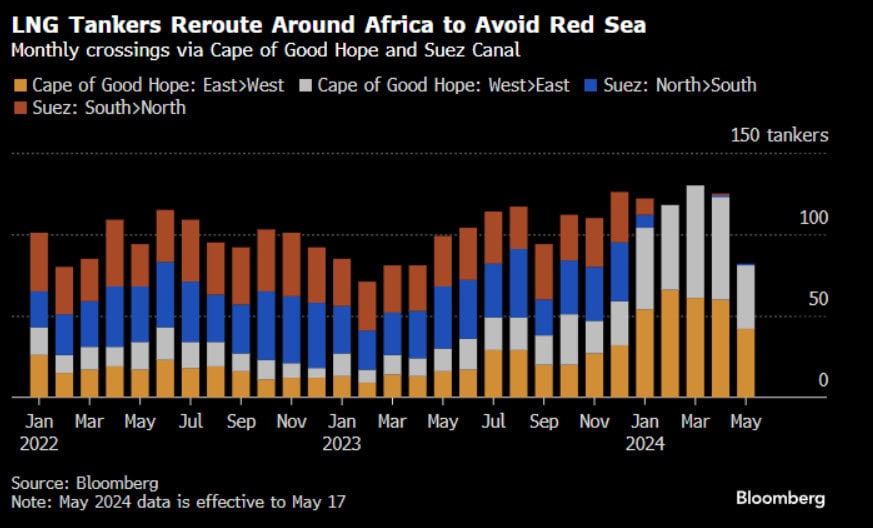
10. It’s been “four months since a liquefied natural gas tanker passed through the narrow strait separating the Arabian Peninsula and Africa, a testament to how violent attacks there have upended global energy trade,” writes BBG.
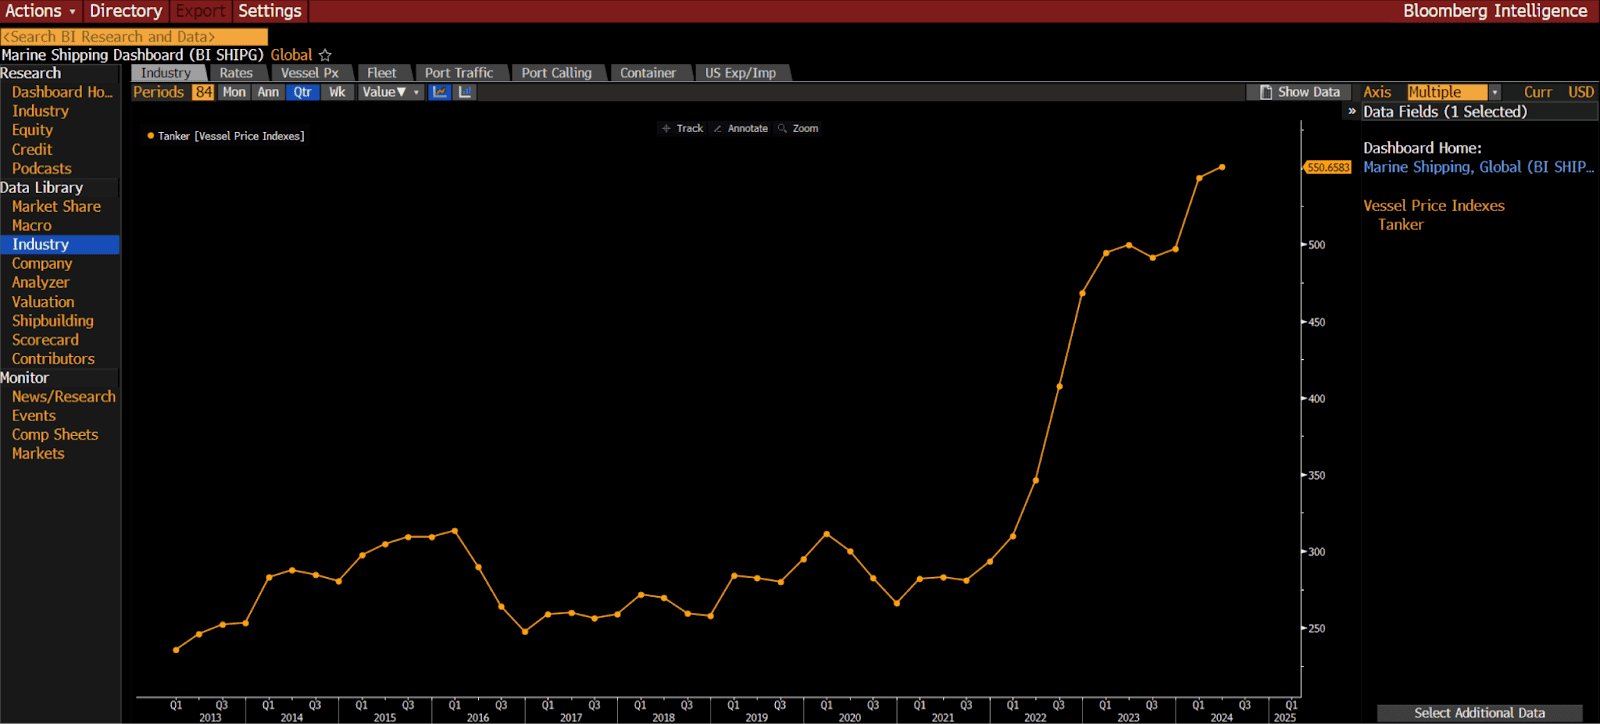
11. Longer shipping routes caused by disruption effectively means less tonnage available to ship things. This means rising costs to ship goods, which means more profits to shippers, and greater demand for ships. We can see on the chart below that tanker vessel prices have doubled over the past two years.
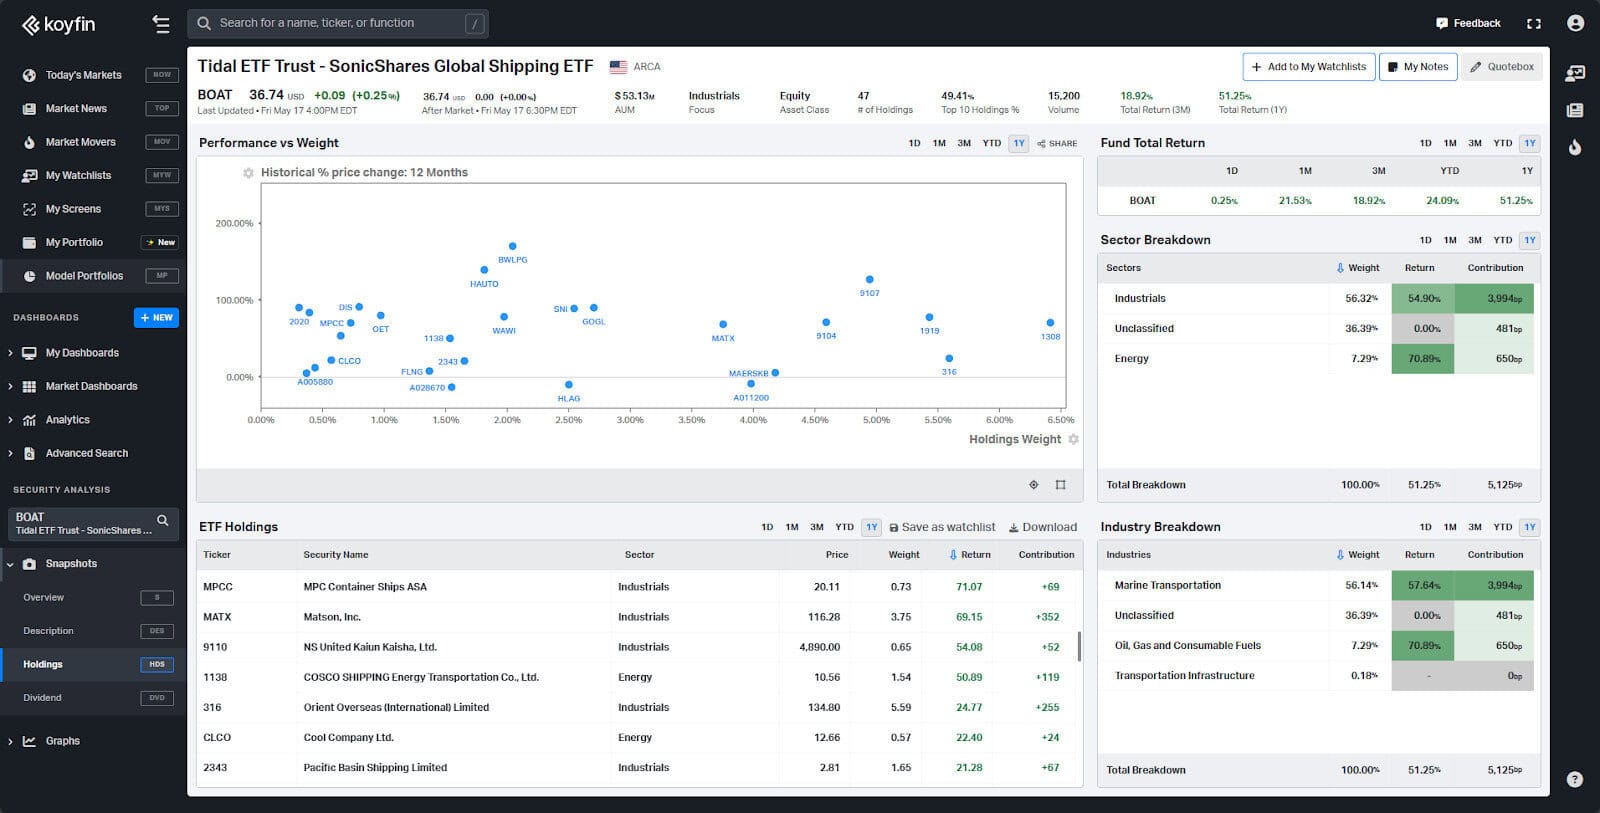
12. Here are some of the top-performing holdings over the past year from the Global Shipping ETF (BOAT) (chart via Koyfin). For tankers check out the charts of STNG, TNK, TK, and the like.
Thanks for reading.