Don’t have an opinion. We used to have a saying in Hong Kong, “Should’ve been up, but it’s down, so short it; should’ve been down, but it’s up, so long it.” That trading philosophy became the basis of what I wanted to do: When the tape is telling you something, don’t fight it; go with it. ~ Jason Shapiro via “Unknown Market Wizards”
In this week’s Dirty Dozen [CHART PACK] we discuss the latest contra-buy signal, go over the route in bonds and what it means for stocks, look at the historic selling pressure in emerging markets, and end with a short oil pitch, plus more…
**Note: Enrollment to the Macro Ops Collective is now open.
The Collective is our premium service that offers institutional-level research, proprietary quant tools, actionable investment strategies, and a killer community of dedicated investors and fund managers from around the world.
If you want to protect your portfolio in this new market regime, make sure you become a member.
**Enrollment will stay open until Sunday, October 29th at midnight CST.
You can learn more about the Collective and what it can do for your investing here.
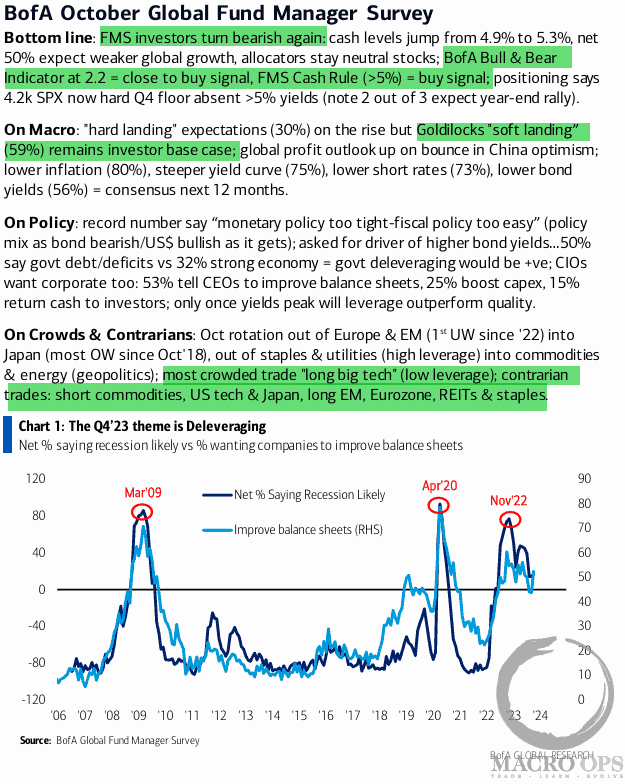
1. Here’s the latest BofA Global FMS summary with highlights by me.
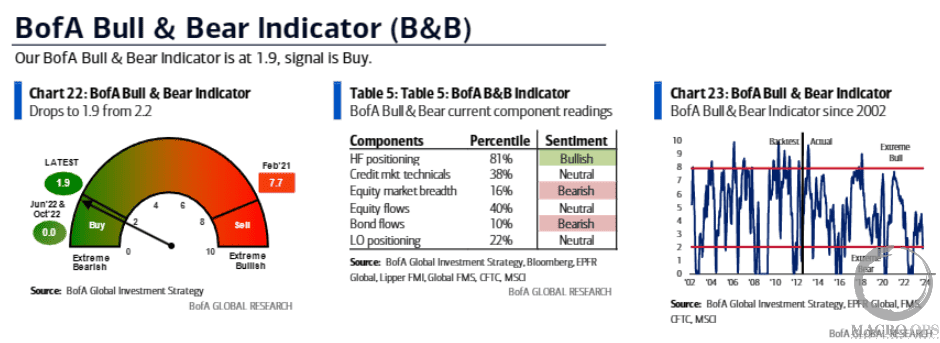
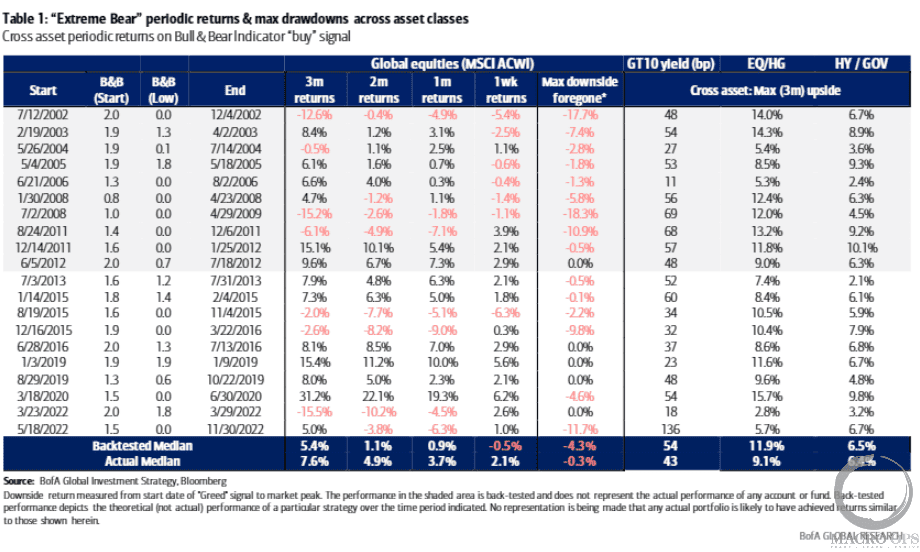
2. BofA’s Bull & Bear Indicator triggered an official buy signal last week. BofA writes that “after 20 BofA Bull & Bear Indicator ‘buy signals’ since 2002 median returns following 3 months (Table 1): US stocks 5.4%, global stocks 7.6%, stocks vs IG bonds 9.1%, HY bonds vs Treasuries 6.4%.”
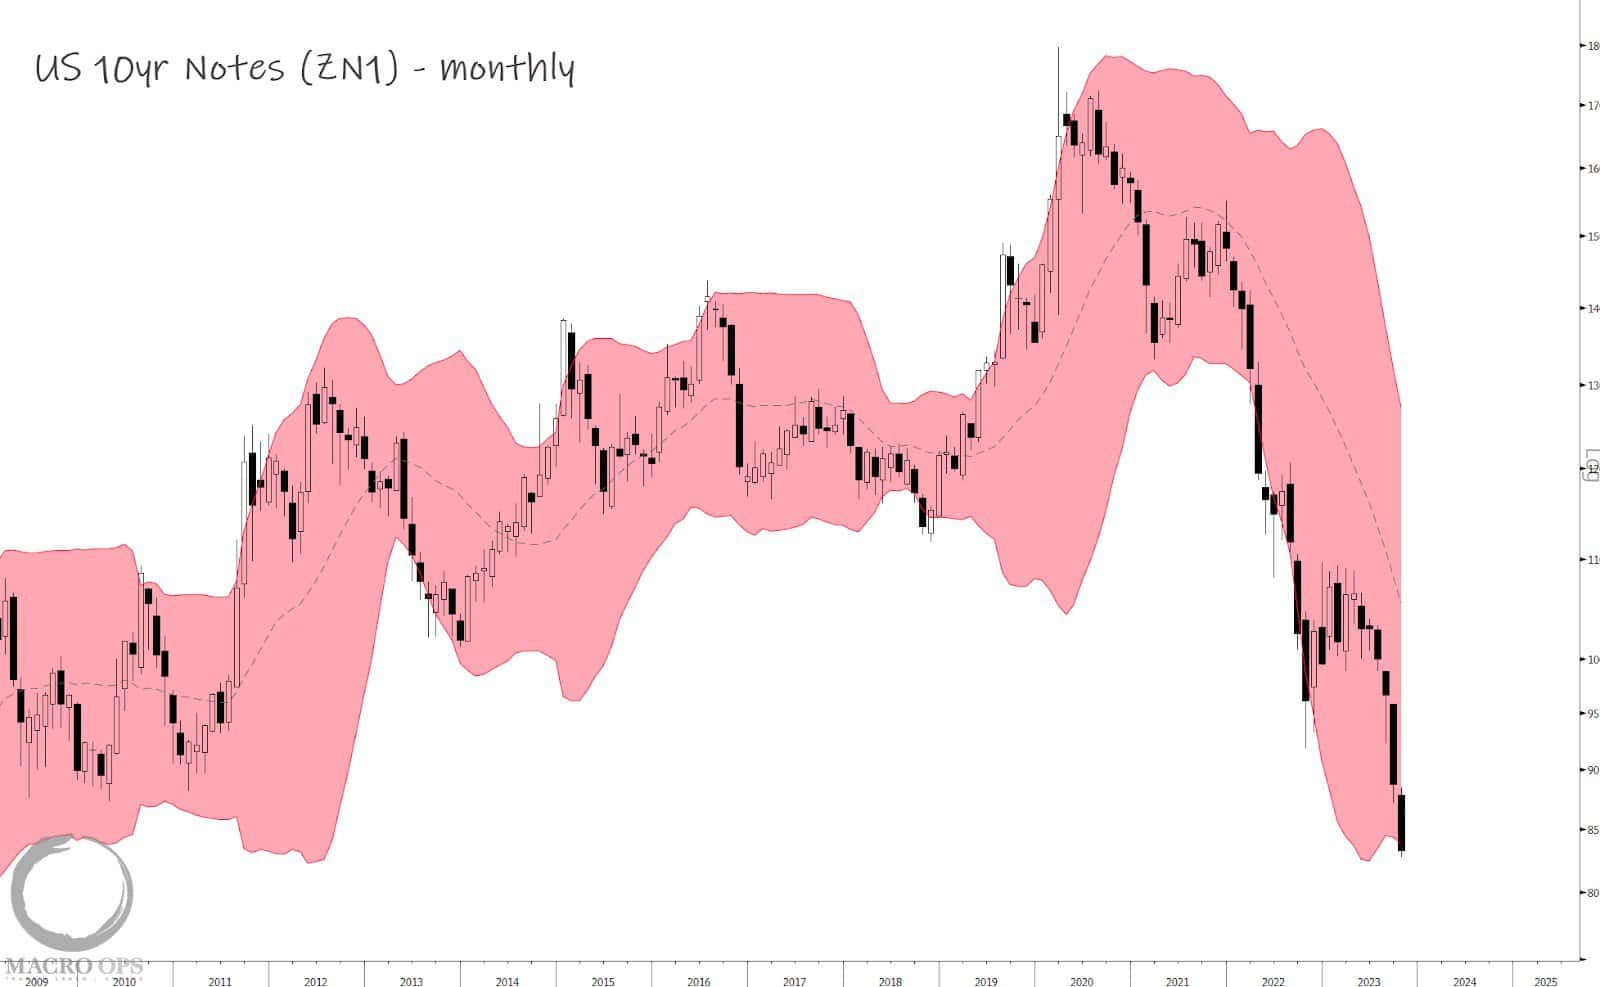
3. Despite the buy signal, this market needs to see bonds find a floor (yields hit a ceiling) before equities can catch an enduring bid. 10s are bumping up against their lower monthly band, though I suspect we may need to see some more risk-off before real money steps in and puts a bid under bonds.
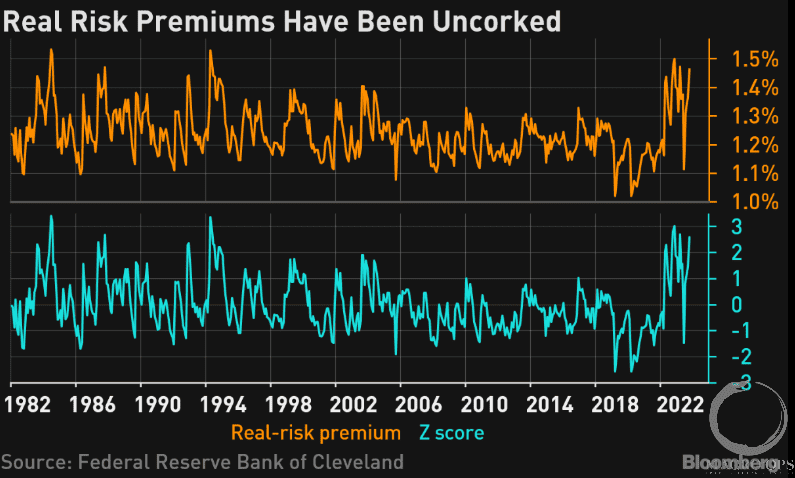
4. BBG points out that “the Federal Reserve’s real-risk premium — which captures the uncertainty that future interest rates will diverge from expectations — is now around 1.46%. That is an occurrence so rare that it could statistically be expected in fewer than 50 days on a sample spanning 10,000 days.”
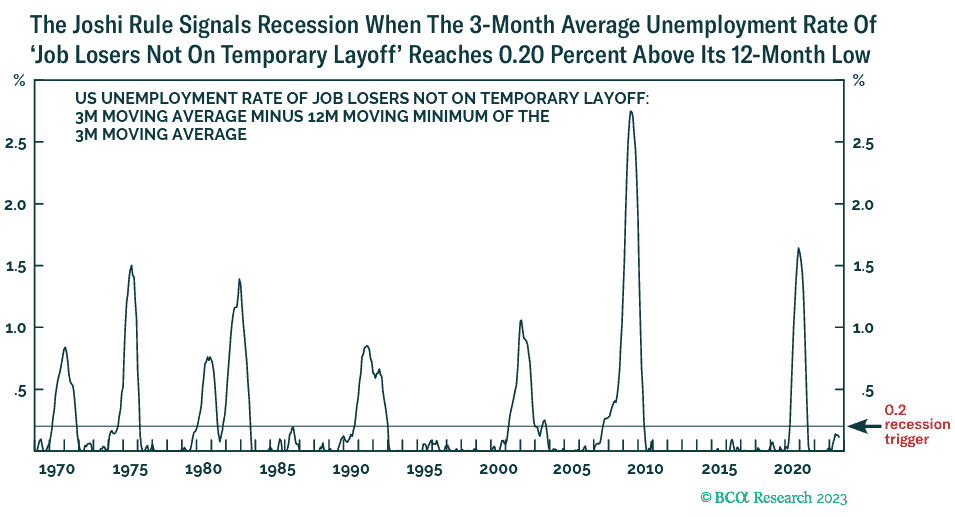
5. BCA’s spin on the Sahm recession indicator. This one uses the 3-month average of the unemployment rate of job losers not on temporary layoff. A recession signal is given after a 0.20% rise off its 12-month low.
The current reading is “close enough to its recession trigger point to be activated this year” writes BCA.
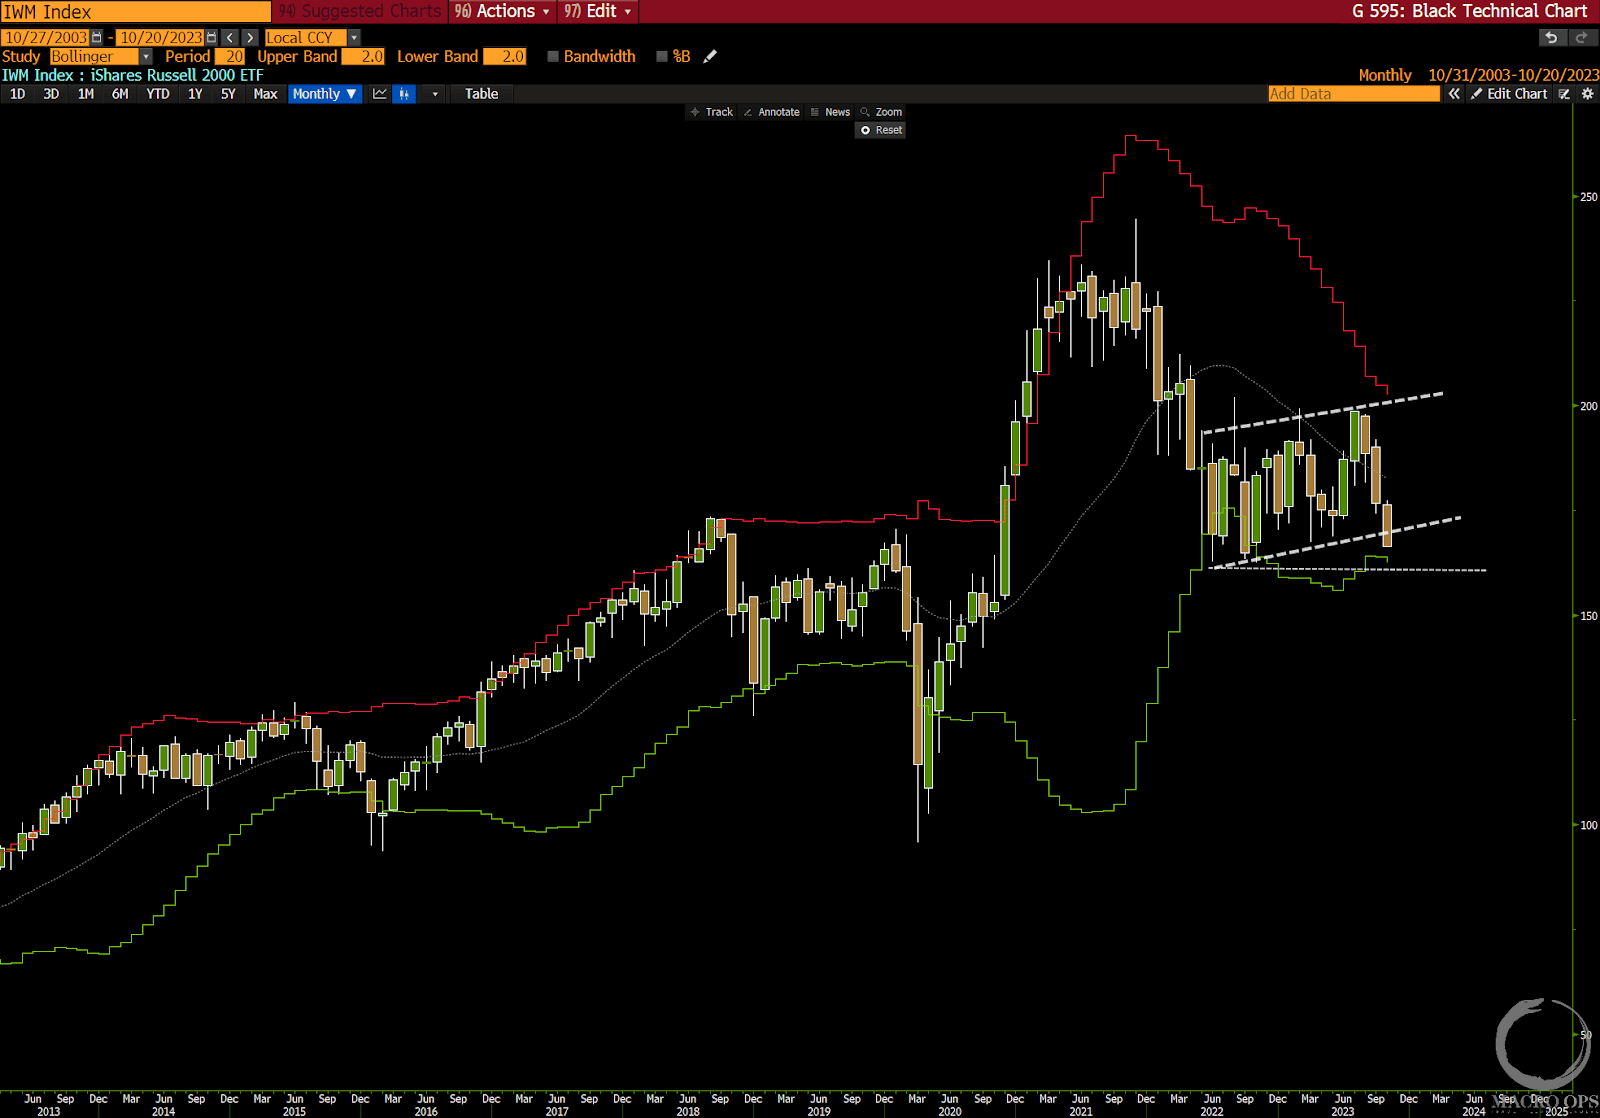
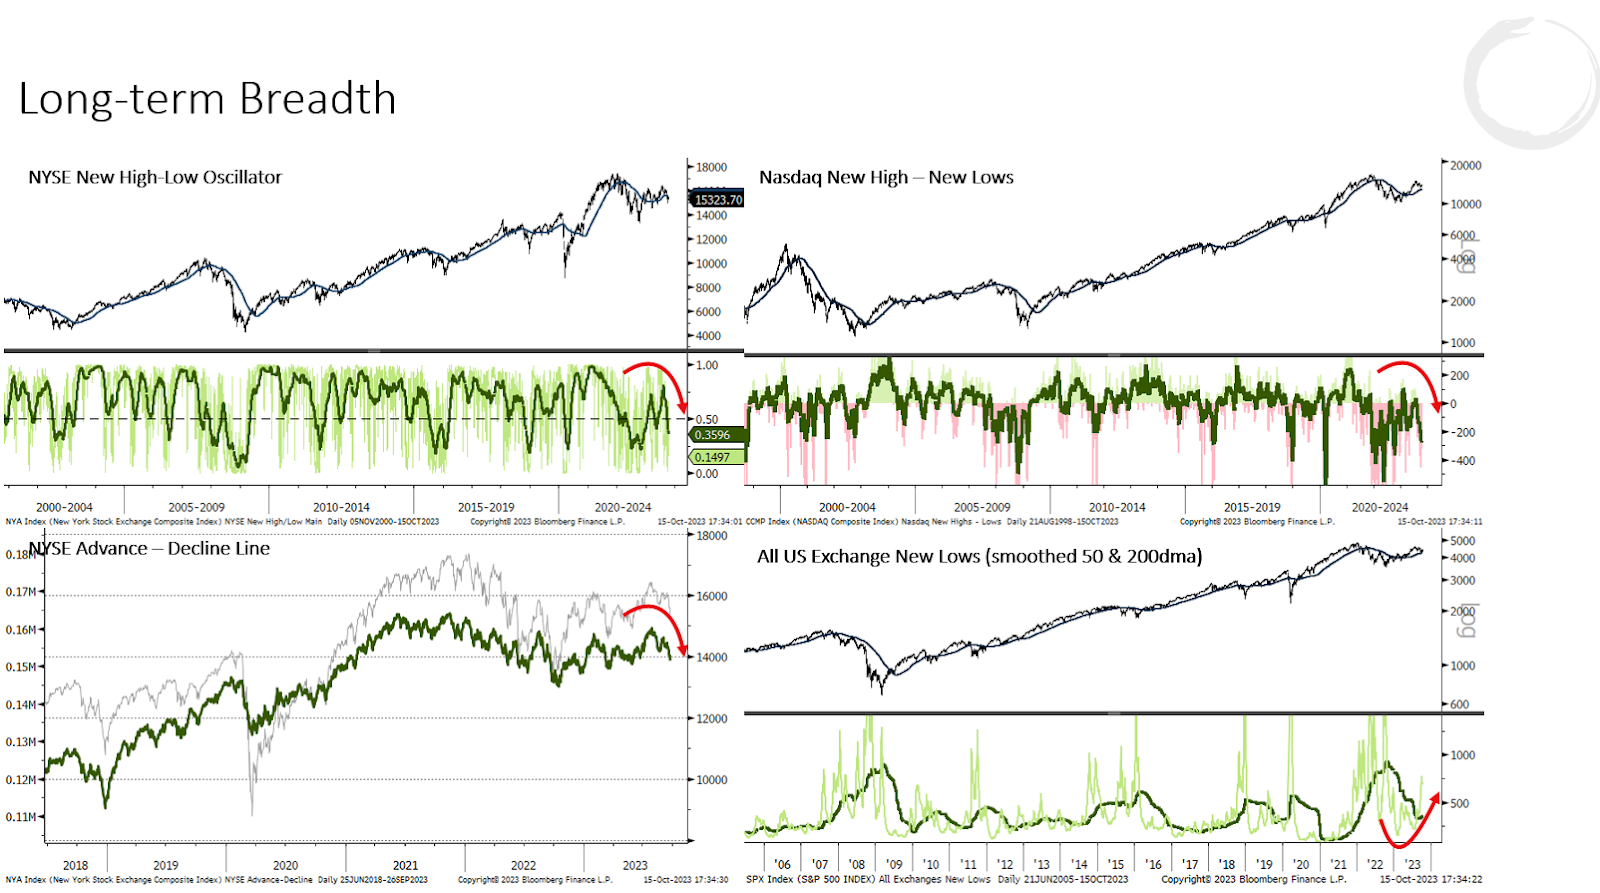
6. If small-caps fail to reverse their technical breakdown by the end of the month, then it becomes much more probable that the broader market soon resumes a cyclical bear.
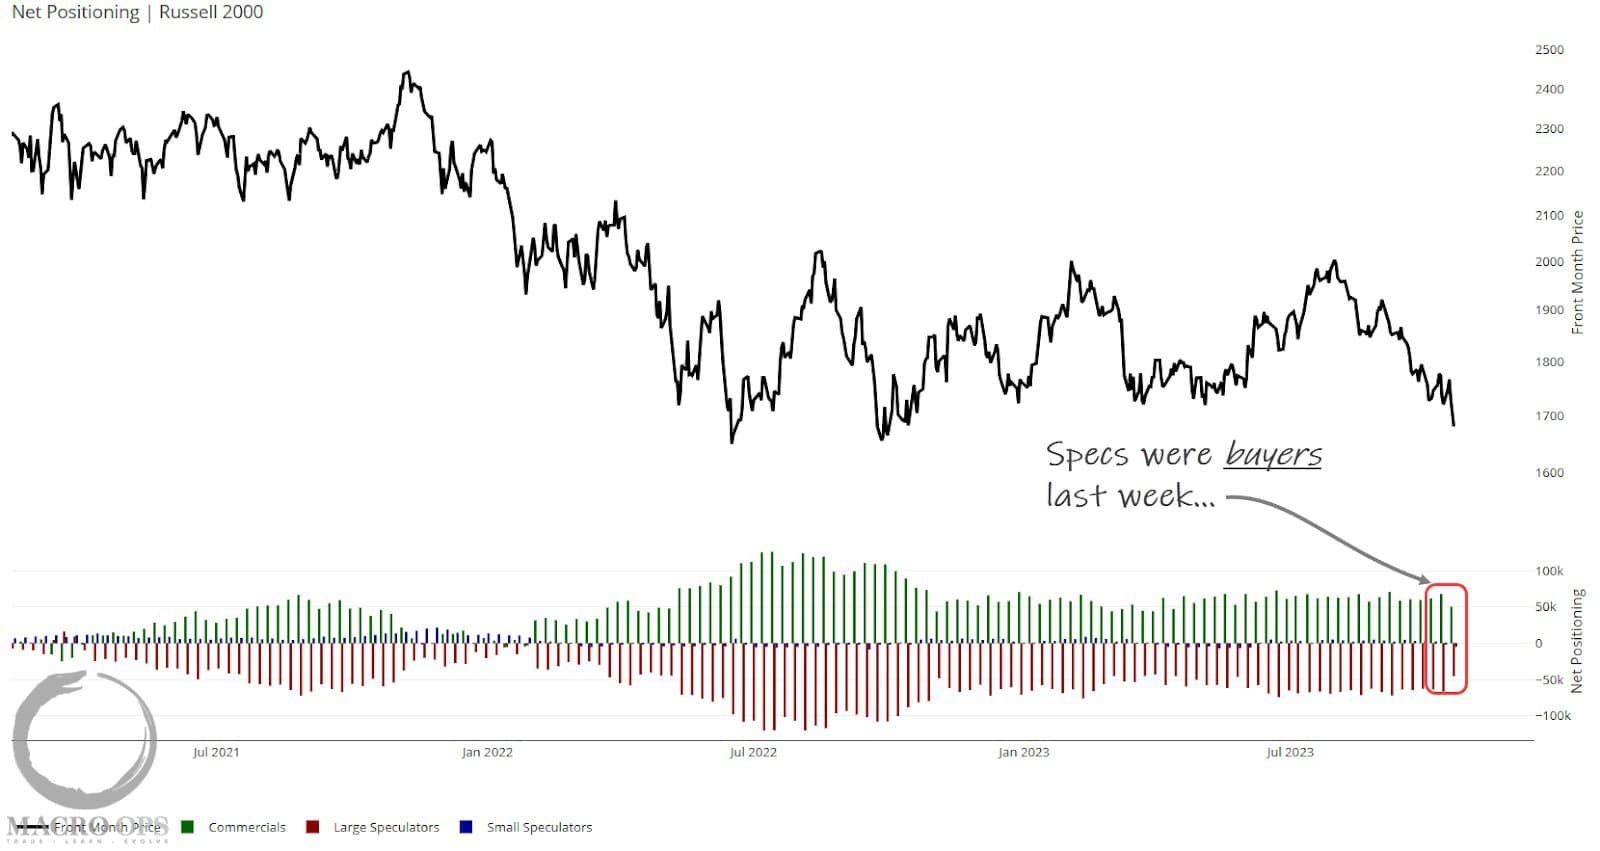
7. And a not-so-comforting fact is that specs were buying this dip in the Russell last week.
This tells me to take the BofA buy signal with some caution. It seems there’s some growing complacency in this market, which contrasts with the price action.
8. If I’m wrong and this selloff proves to be short-lived then EM is worth looking at for a swing.
SentimenTrader writes “The chart below shows this 50-day average net breadth metric expressed as a percentage of the total number of stocks in the index. It has surpassed -10%, one of the most extreme figures in nearly 30 years. That woeful stretch has also pushed the McClellan Summation Index for these stocks to an extremely low level. Both indicators rank in the bottom 5% of all days since 1995.”
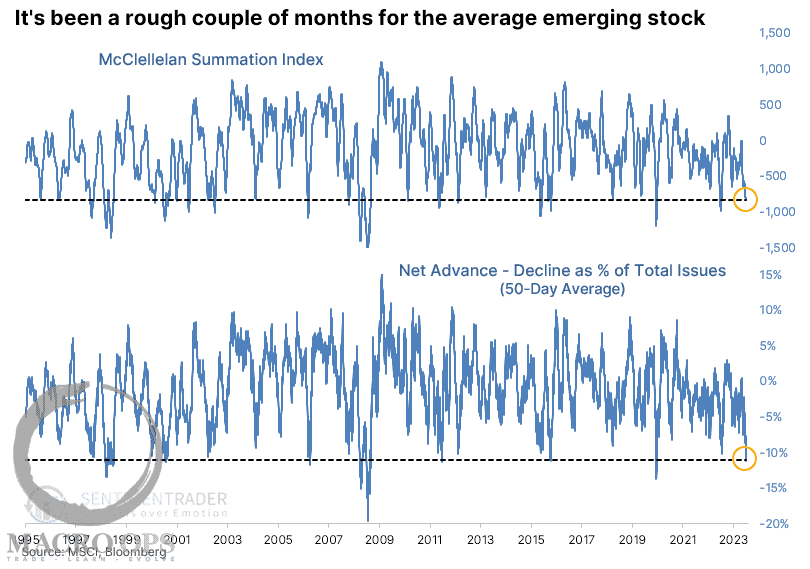
9. Historically this has led to some pretty good forward returns. Here’s ST again “After the 50-day net breadth indicator surpassed -10% of issues, the Emerging Markets Index tended to rally consistently for up to three months later. There was only one loss larger than -2% over the next three months, though a few morphed into painful longer-term losses. The last four signals were superb for bulls.”
10. Crude is entering its weakest period of seasonality while positioning and sentiment are at levels that typically mark poor forward returns over the short term.
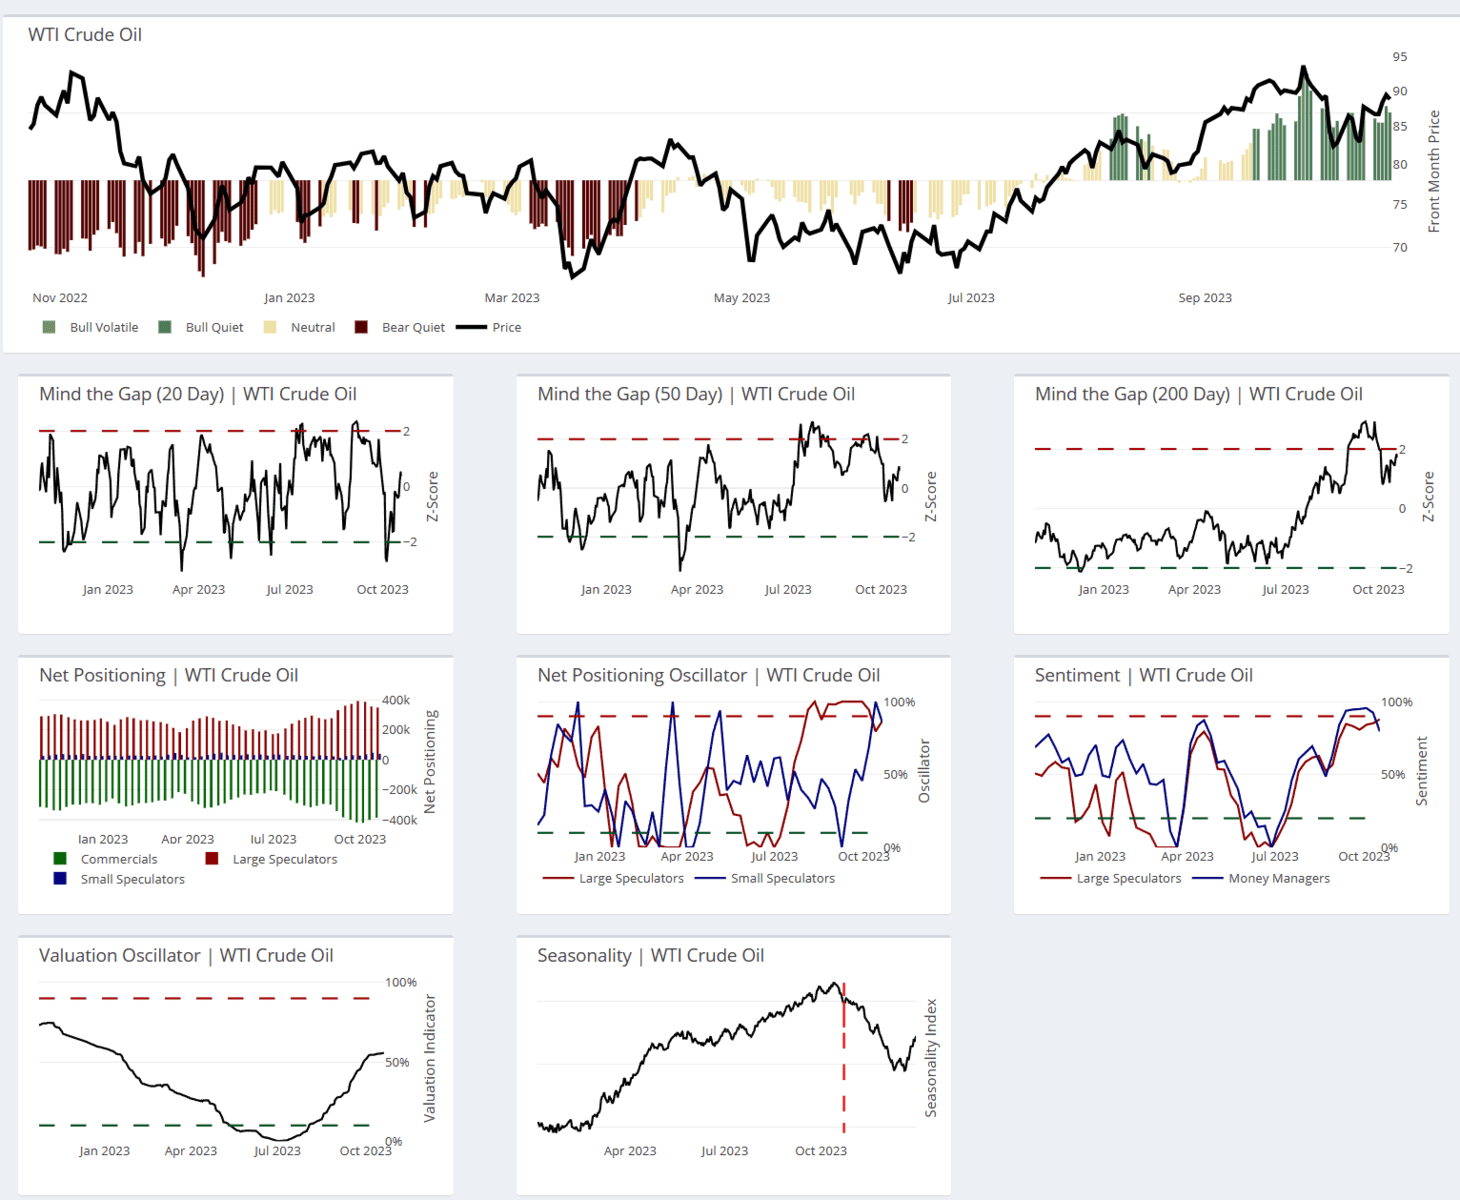
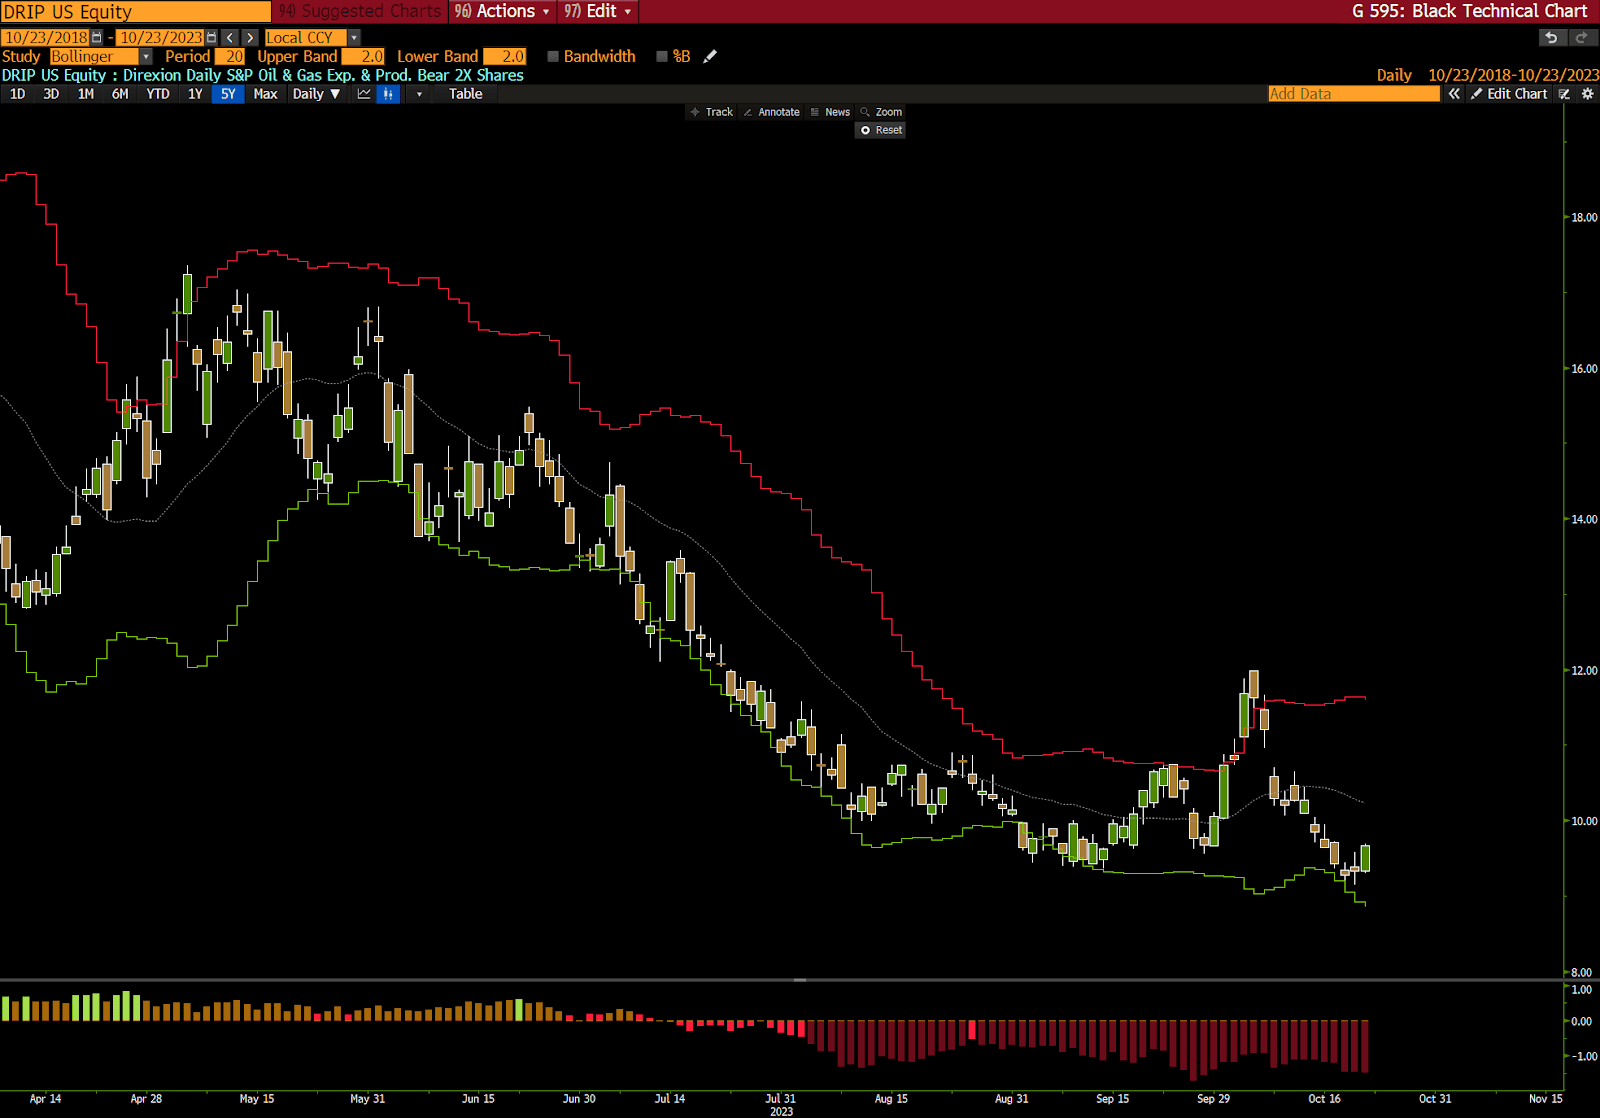
11. Since our book is primarily in cash, long USD vs CNH & MXN, long oil names (TDW and VIST), and long uranium, we’ll look to get long DRIP the 2x leveraged E&P ETF in order to hedge out our exposure to a pullback in oil.
.
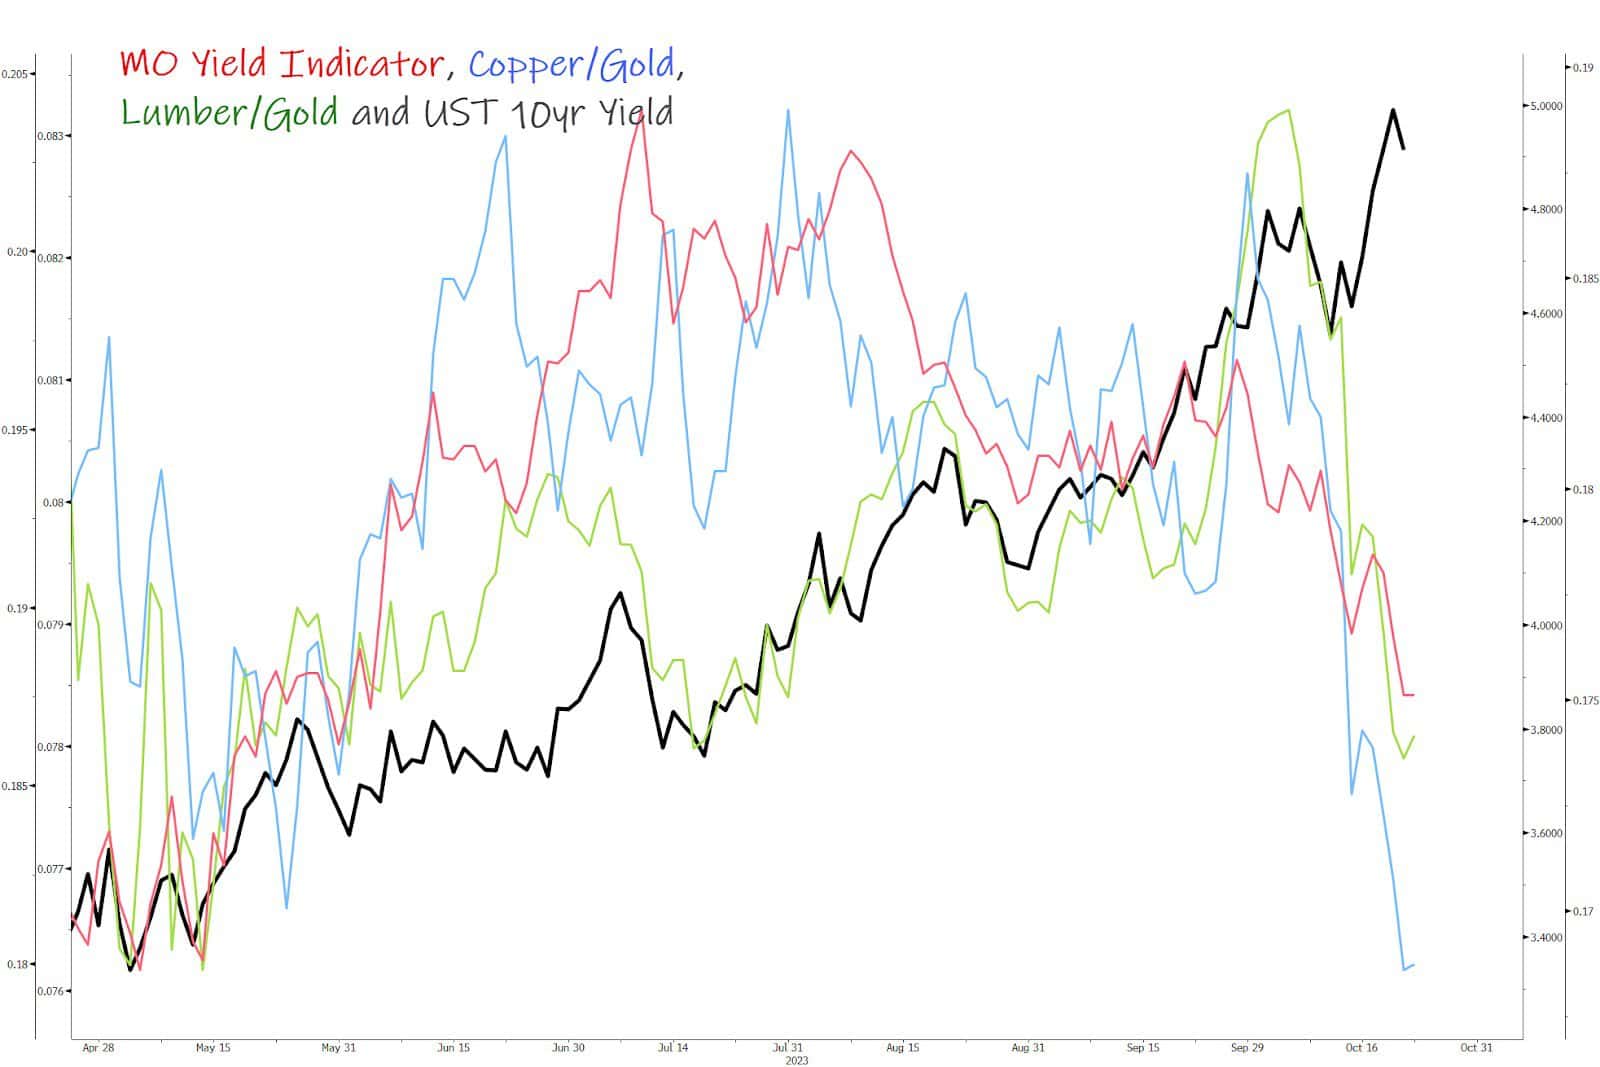
12. The large negative divergence in our yield leads continues. The setup here continues to look very similar to what we saw in the lead-up to the major bottom in bonds in late 2018.
It will likely take some more pain in the equity markets to get us there, but we’ll have to keep an eye on these as there’s a good chance that bonds are gearing up for a big reversal within the next month or two.
Thanks for reading.


