“Bullishness is born as hope in the midst of despair. Hope swells to confidence and confidence swells to euphoria, and the process contains the seed of its own destruction and the birth of its opposite, fear. Fear is nurtured by falling prices and the two feed on themselves until they swell to despair. And so the cycle is completed -and ready to begin again with the birth of hope. This is both the way things are and the way they have to be.” ~ John Percival “The Way of the Dollar”
In this week’s Dirty Dozen [CHART PACK] we walk through the latest monthly charts, cover the big setup brewing in USD pairs, pitch a coffee short and an equity long, plus more…
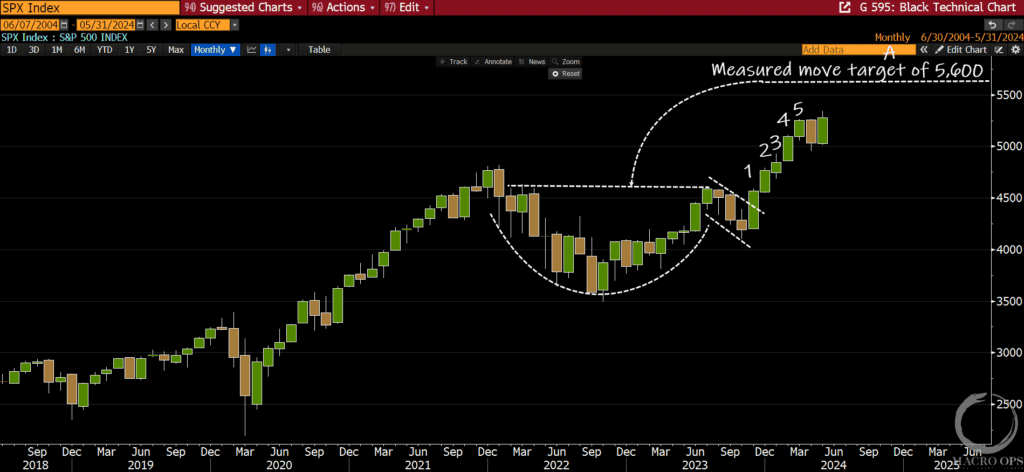
1. New monthly closing all-time high in the SPX. This follows a strong five-month consecutive bull bar breakout from a 2-year cup-n-handle pattern. Odds are that last month was the correction ending the first bull leg and we’re about to embark on the second one higher. The measured move target for the larger pattern is 5,600.
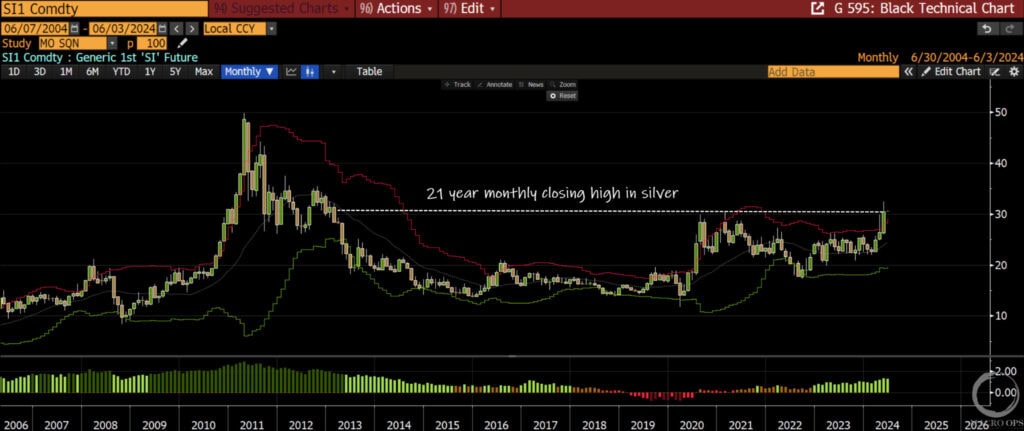
2. Silver saw its highest monthly close in over 21 years. Short-term extension and positioning may mean we see more sideways chop and vol in the near-term but this chart says we’re in a renewed cyclical bull market in precious metals.
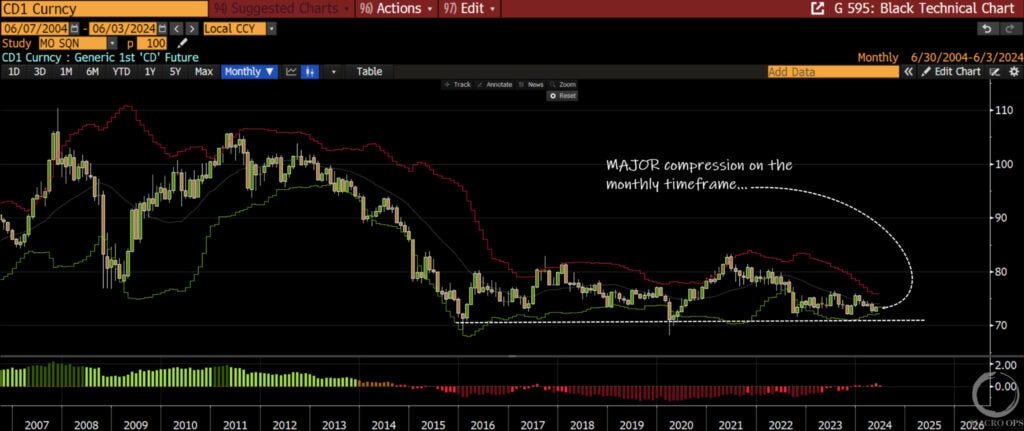
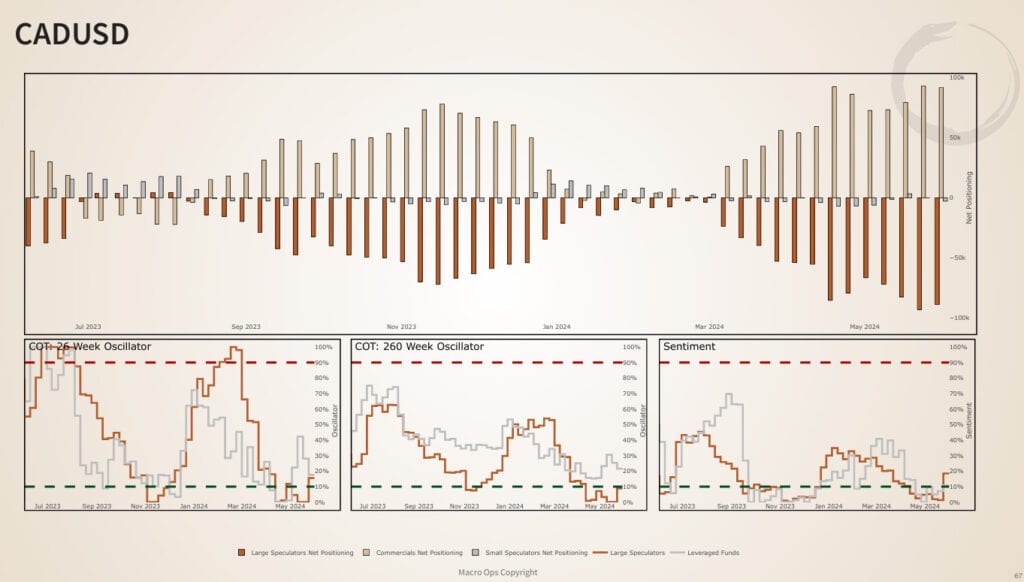
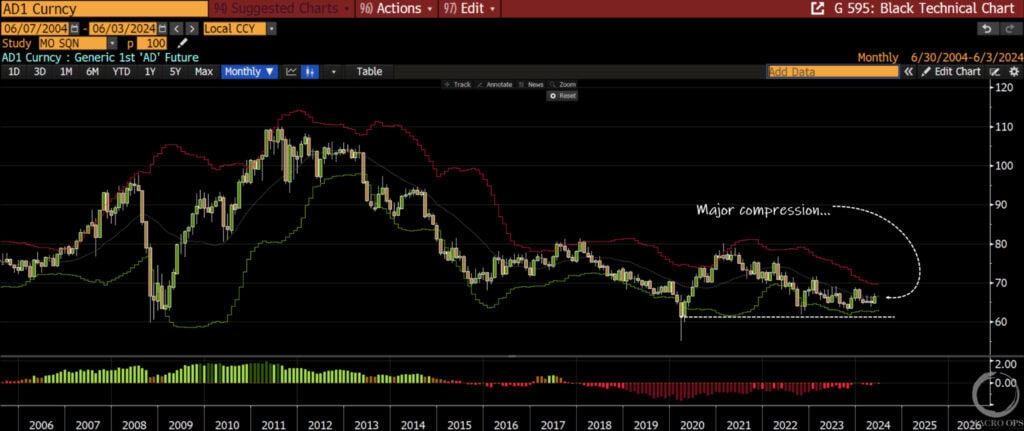
3. One of the more interesting market developments we’re tracking is the major compression we’re seeing across a number of USD pairs. Below is a monthly chart of CADUSD. It’s squeezing right up against long-term support. This suggests a big trend is coming and my read is that that trend will be to the upside (USD down).
4. Positioning and sentiment are sub-15th percentile for both large and small specs measured across multiple time frames. That’s a lot of fuel for a face ripper of a rally higher.
5. Same thing in AUDUSD…
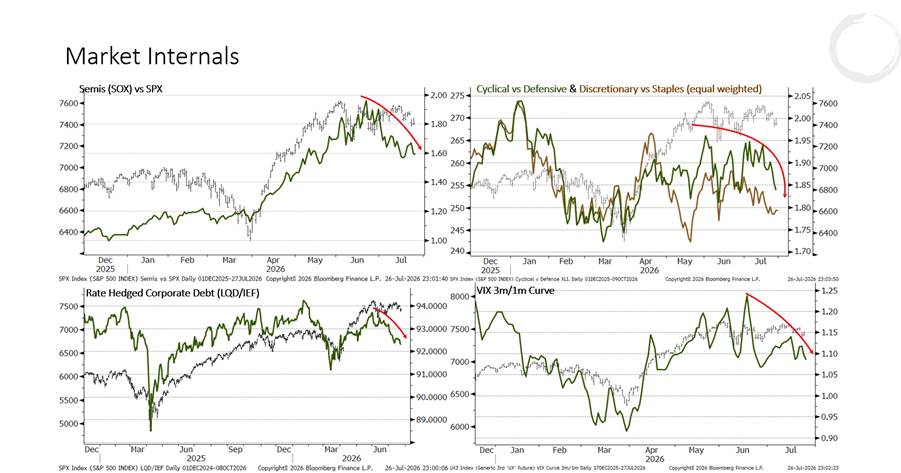
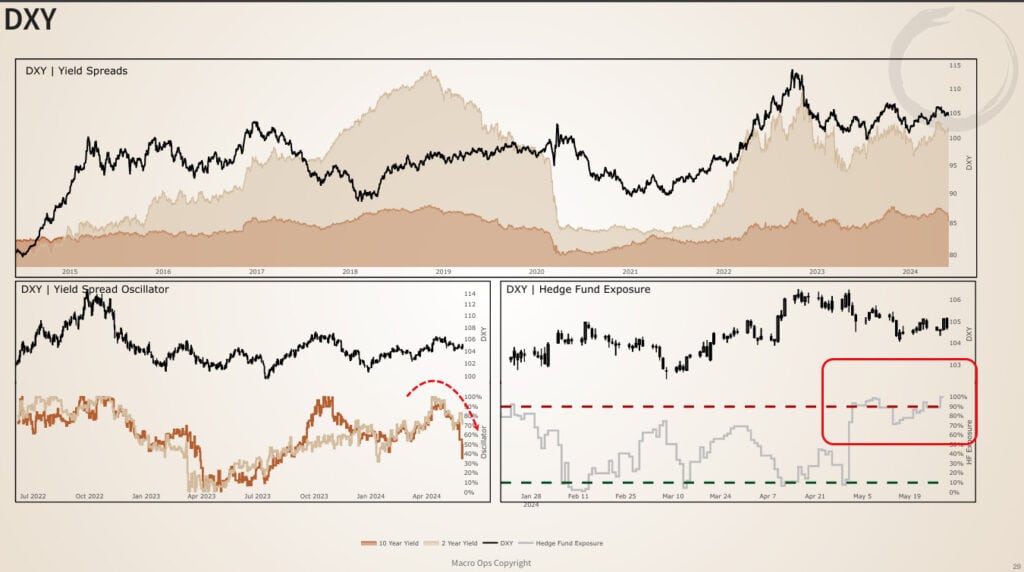
6. Our interest rate oscillator for the trade-weighted dollar (bottom left chart) is rolling over from its highs while hedge fund positioning long DXY is in the 100th percentile. Stay on your toes…
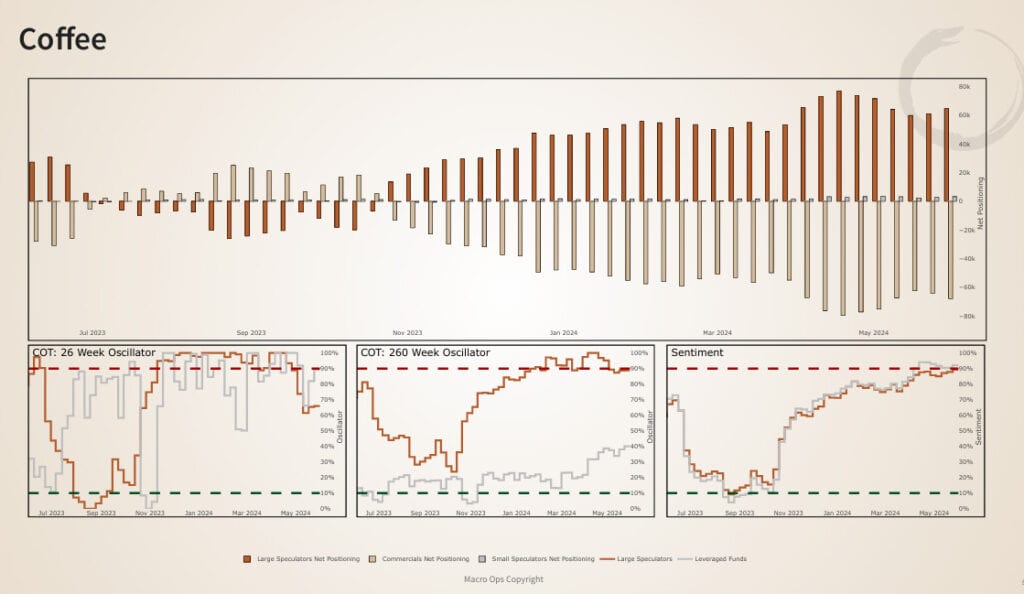
7. Coffee saw a big reversal bar at its upper band on Friday, giving us a double top on the weekly.
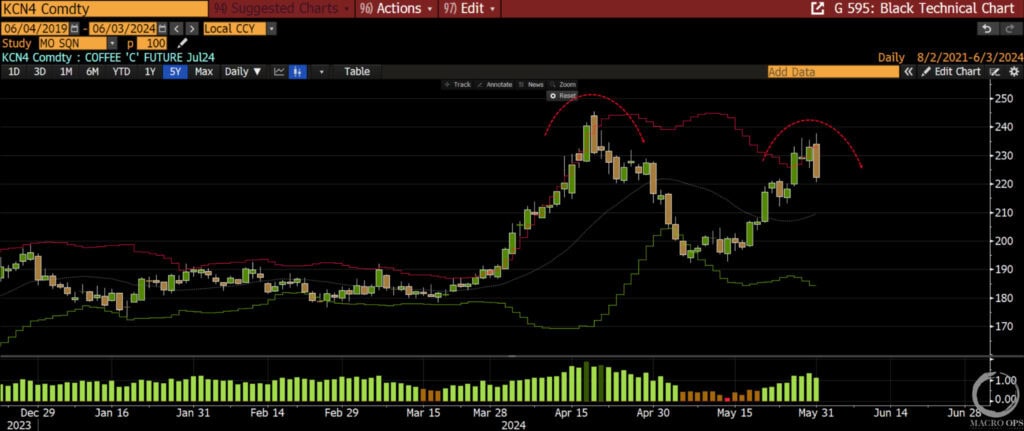
8. While sentiment and positioning are both stretched long. This gives us a good shot to take a swing short.
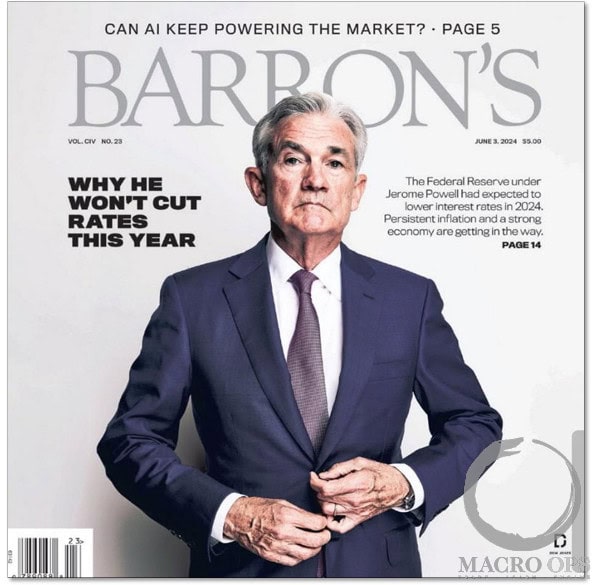
9. No comment…
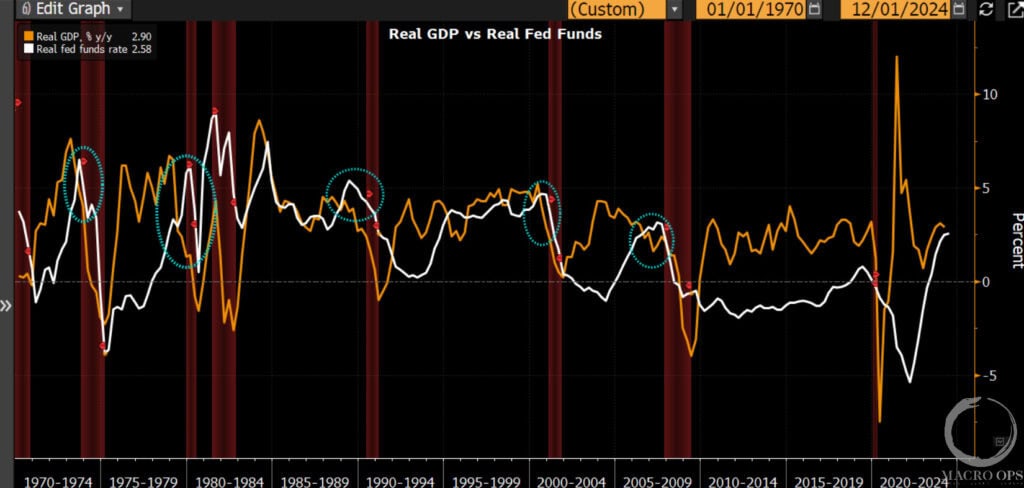
10. Monetary policy is becoming increasingly restrictive. This isn’t showing up in current financial conditions, yet. But it will later in the year unless the Fed starts pushing cuts again. This chart shows real GDP YoY% (orange line) and real Fed Funds (white line). Notice that Fed Funds cross above real GDP bad things tend to soon follow…
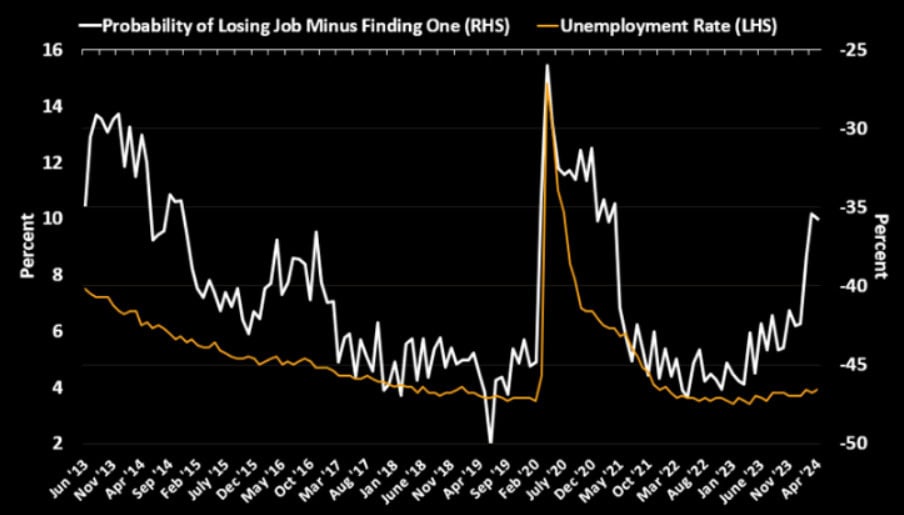
11. I can show you a number of these charts that point to an increasingly softening labor market in the months ahead. So the higher for longer consensus might be a little late to the party.
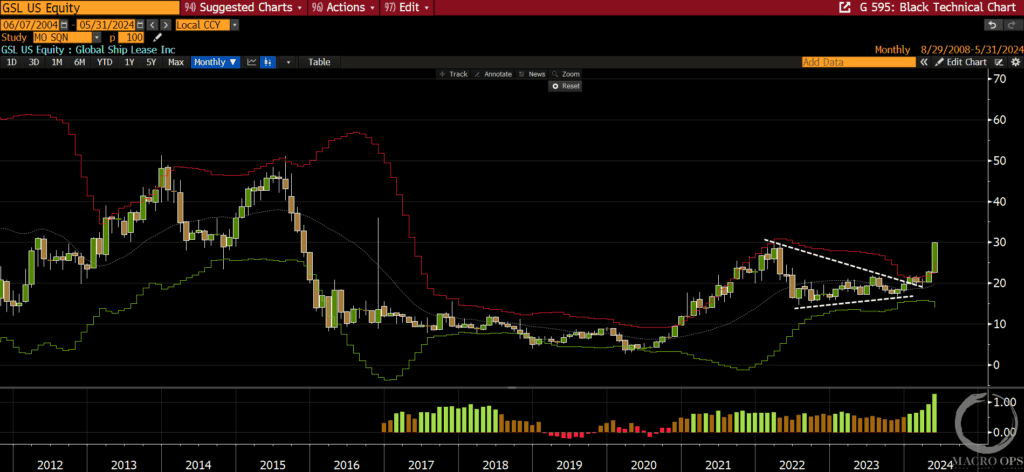
12. We’ve mentioned the strong tapes and fundamental setups that we’ve been seeing in shippers several times now. Take a look at this monthly chart of Global Ship Lease (GSL). GSL trades at an EV/EBITDA of 3.6x which is in the 10th valuation percentile of its 17-year history as a public company. This is a tape you want to buy.
Thanks for reading.