By doubting, we come to examine, and by examining, so we perceive the truth.~ Peter Abelard
In this week’s Dirty Dozen [CHART PACK] we look at seasonality, internals, financial breadth thrusts, weakening US labor data, and a bullish setup in corn, plus more…
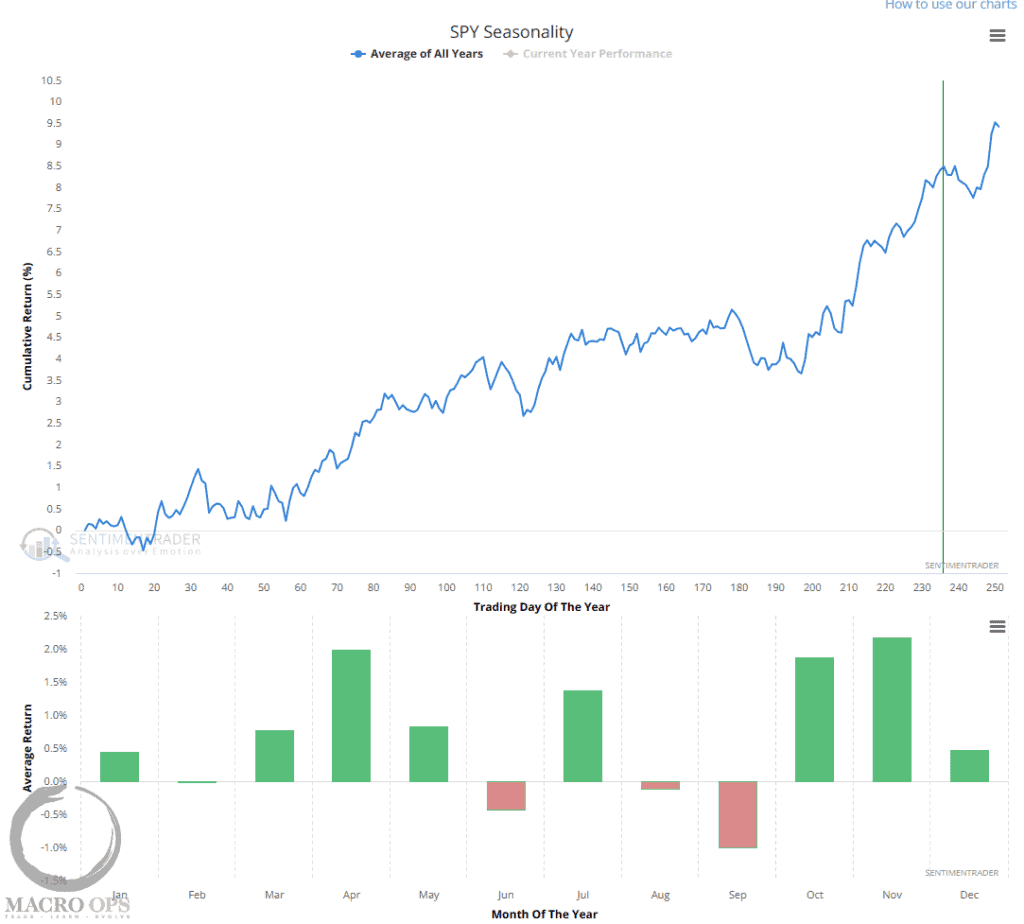
1. The SPX has a seasonal tendency to dip over the next eight trading days before a bottom followed by a runup into year’s end.
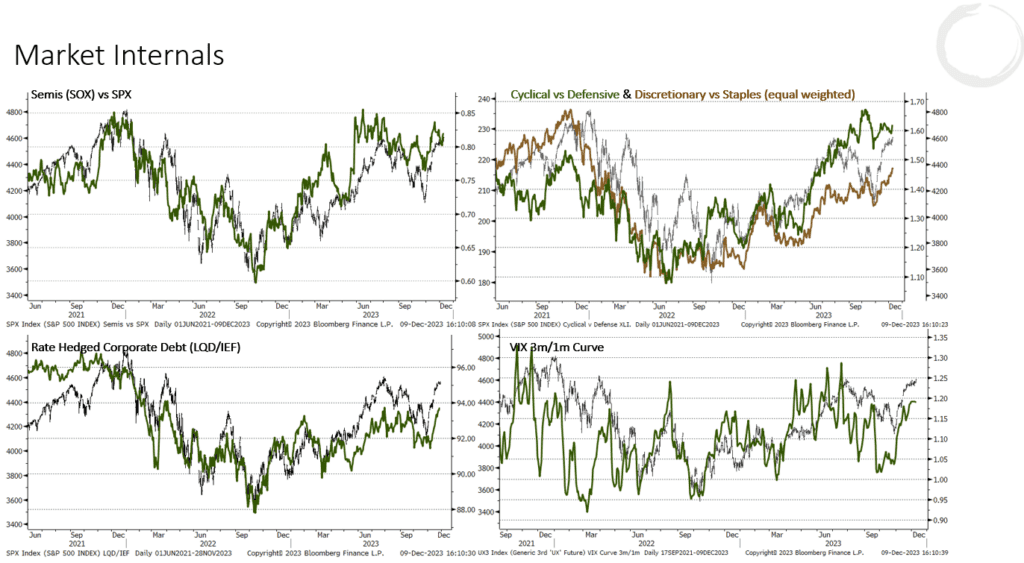
2. Sentiment and positioning are turning more bullish but aren’t at levels that typically mark larger pullbacks. Breadth is strong though nearing overextension and market internals remain supportive of the broader trend up.
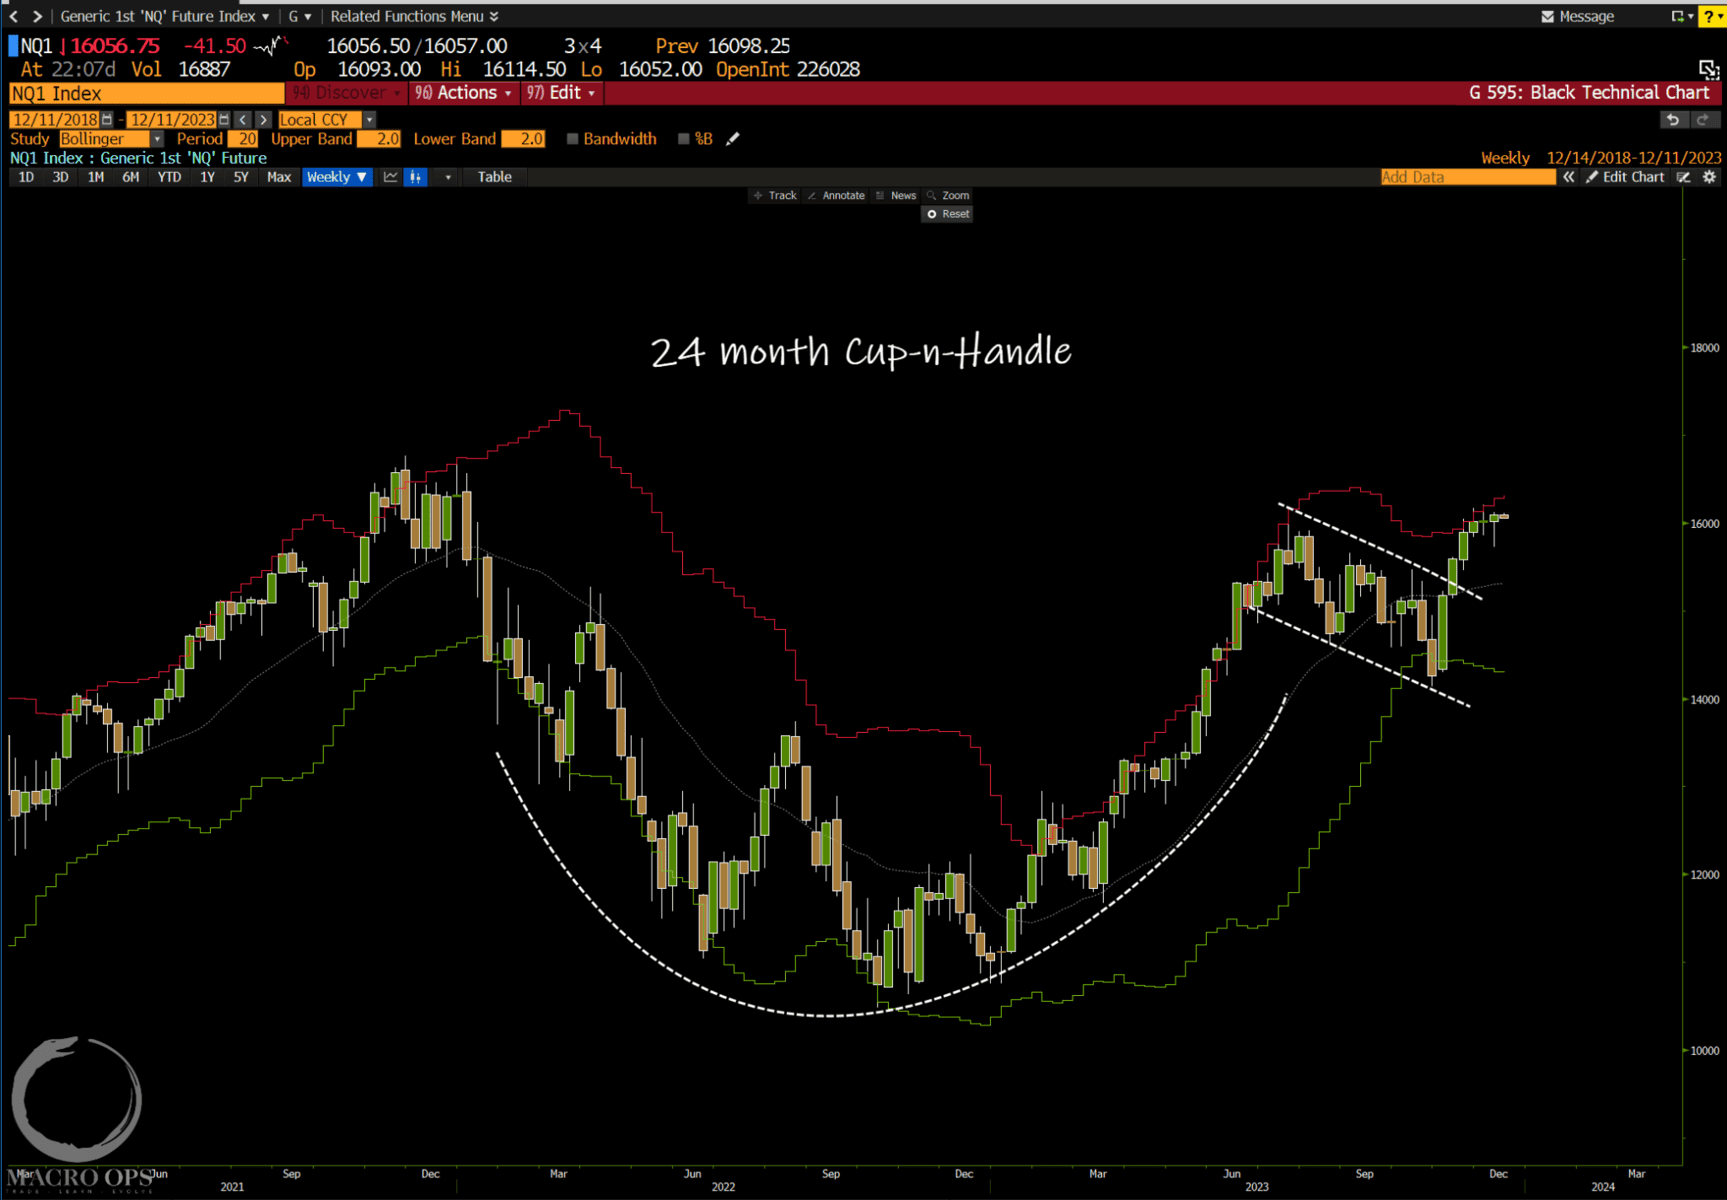
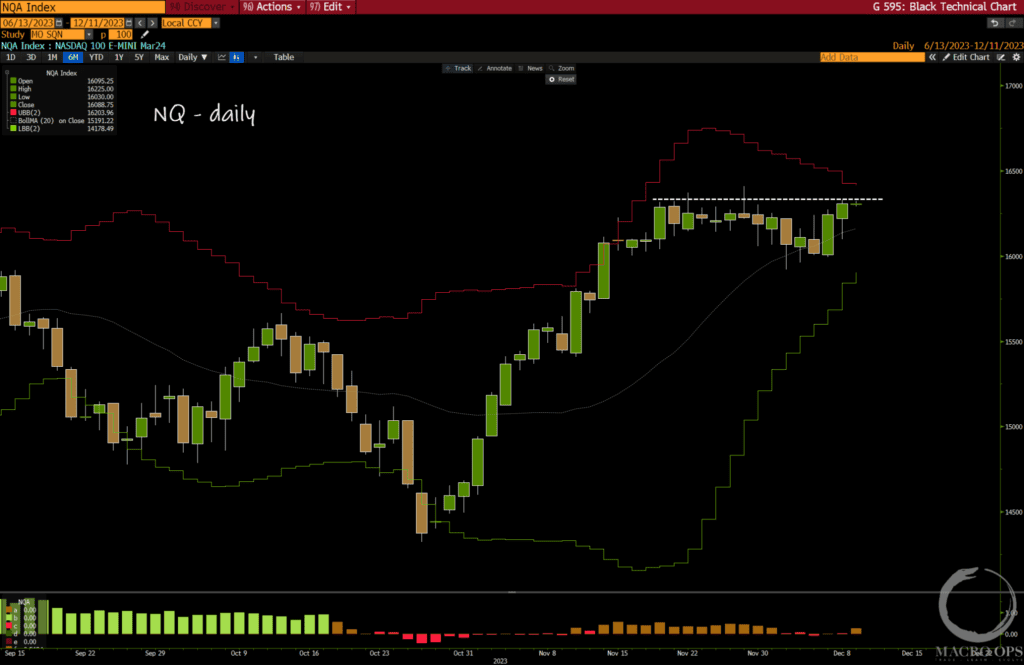
3. The Qs have completed a large 24-month cup-n-handle pattern. This is a bullish pattern.
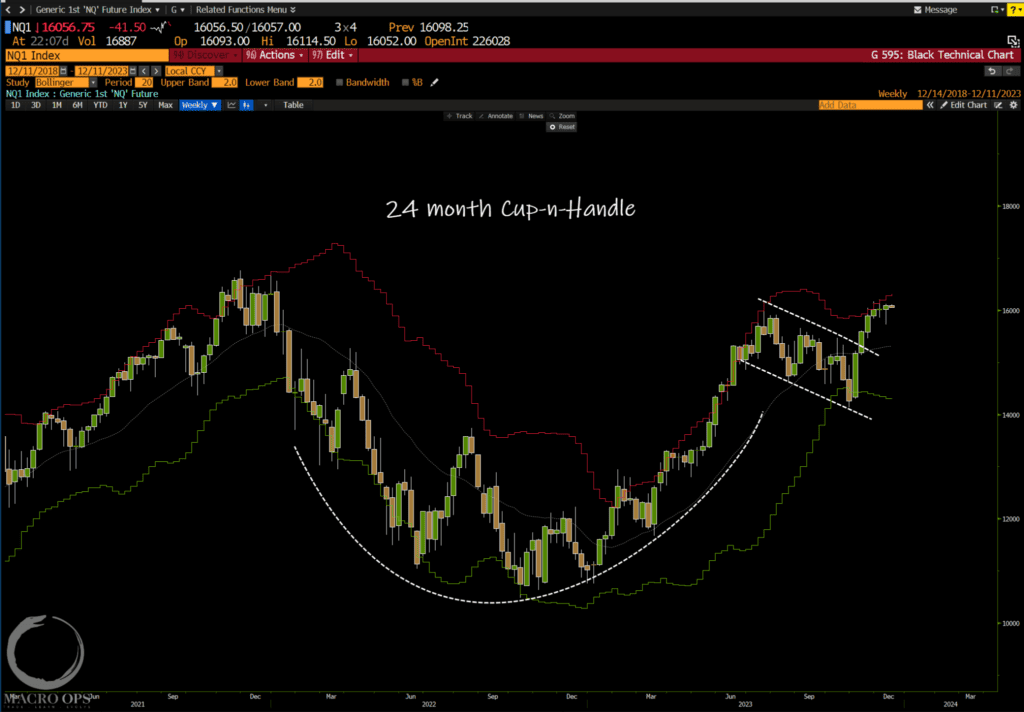
4. We’re long and will be adding to our position on a daily close above its current sideways range.
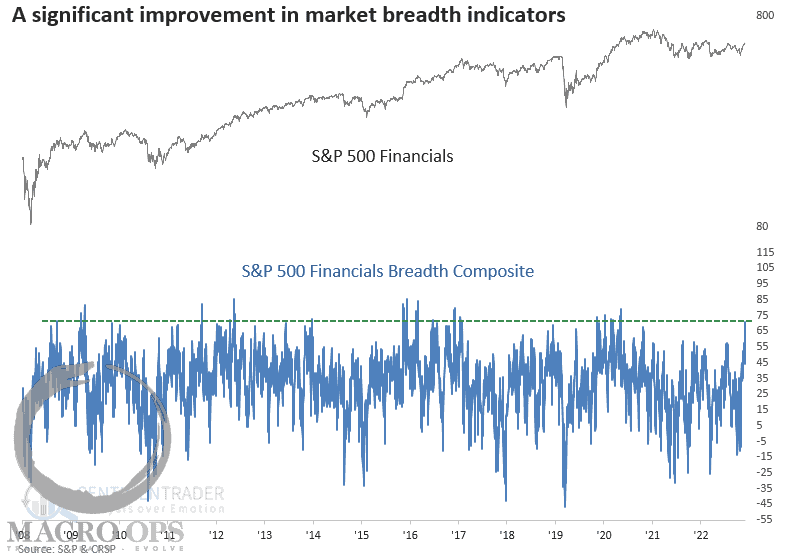
5. Last week the financial sector saw a surge in breadth. SentimenTrader writes “a breadth composite containing six indicators with various duration lengths exploded to the highest level in more than two years, triggering a buy signal for the group. The previous signal generated an alert in November 2020, leading to an almost 16% gain over the following three months.”
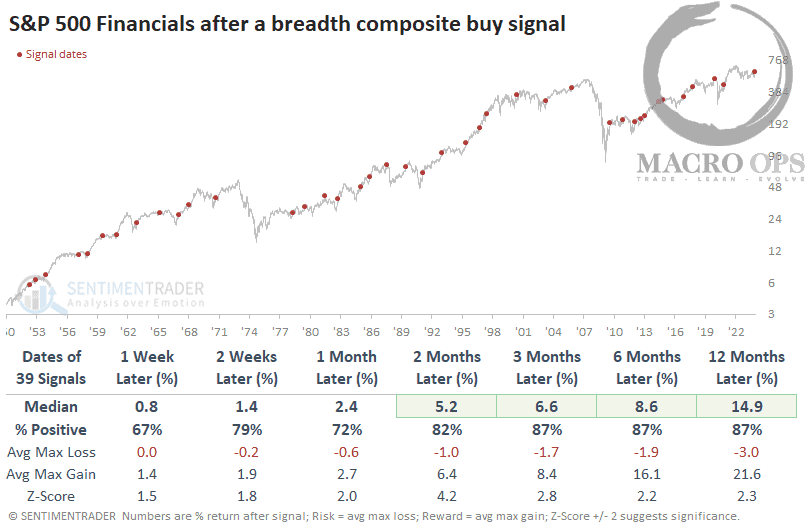
6. And “whenever the S&P 500 Financials breadth composite surges above 67%, returns, win rates, and z-scores for the financials sector are excellent across all time horizons. The signal showed a gain at some point over the subsequent three months in 38 out of 39 precedents.”
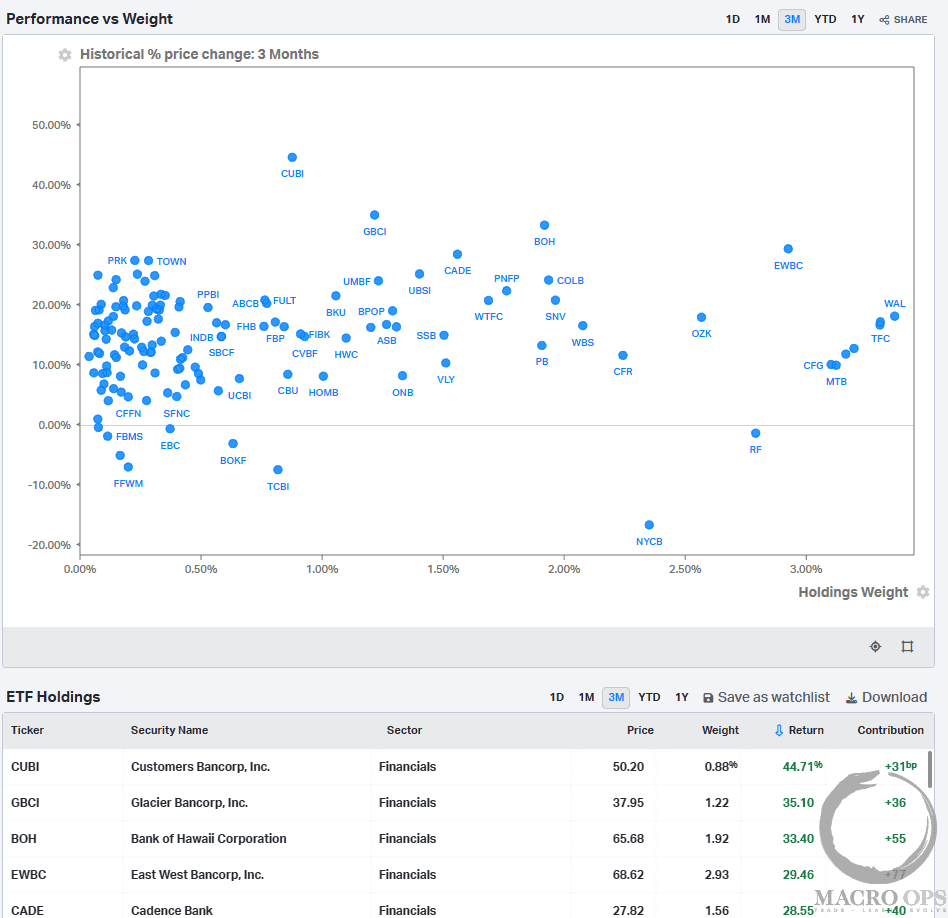
7. Here’s a snapshot of the 3m returns from the KRE Regional Banking Trust ETF (KRE) via the excellent analytics platform, Koyfin. CUBI, GBCI, BOH, EWBC, and CADE have the best 3m performance of the group.
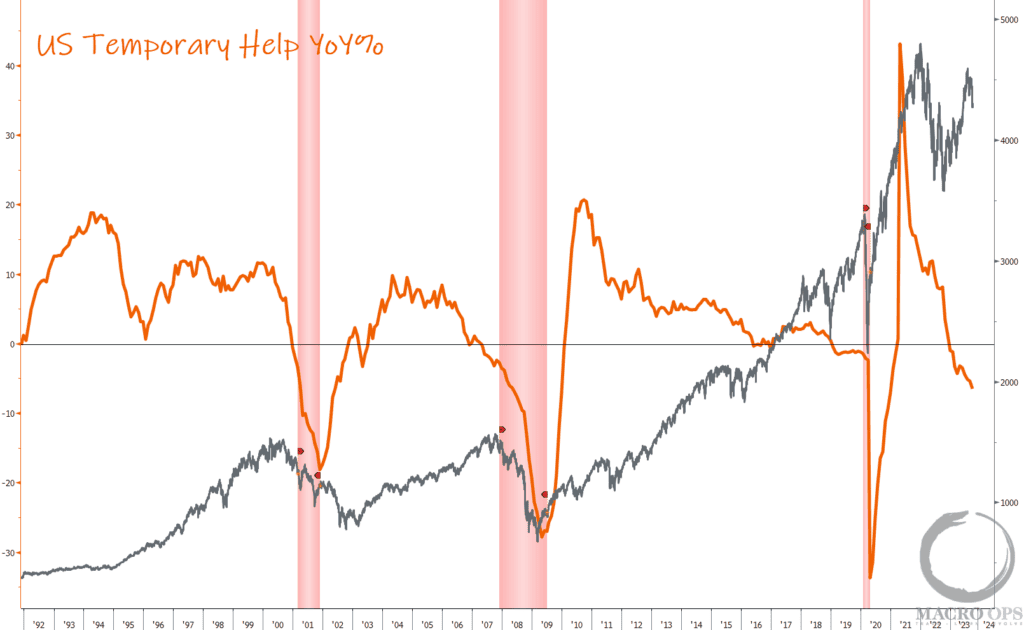
8. A favorite leading labor market indicator of mine is Temporary Help on a YoY basis. The US economy is certainly not in a recession at the moment, but this chart bears watching to see if keeps trending lower.
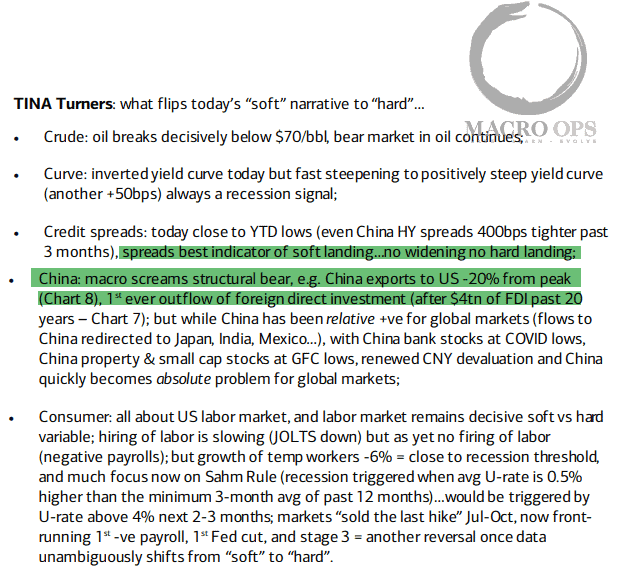
9. “What flips today’s ‘soft’ narrative to ‘hard”… via BofA.
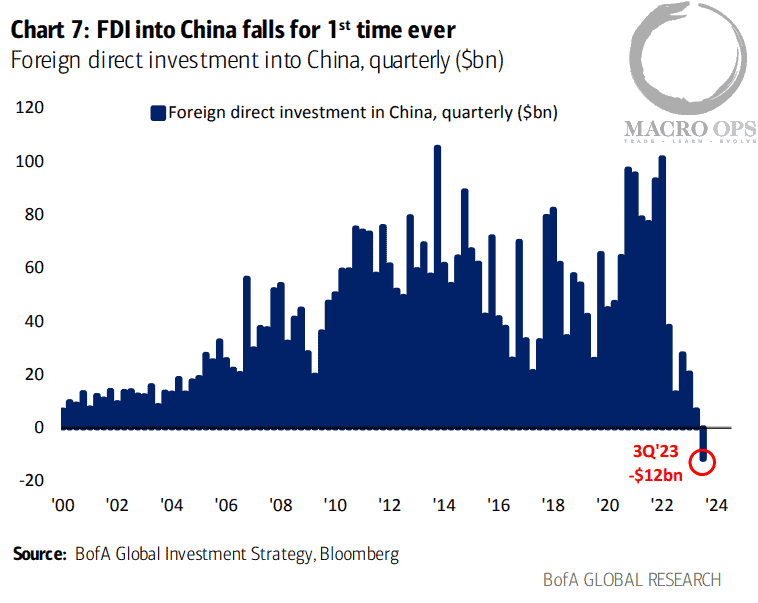
10. China’s FDI has turned negative for the first time. Long USDCNH is giving us another setup with the pair reversing off its lower weekly Bollinger Band.
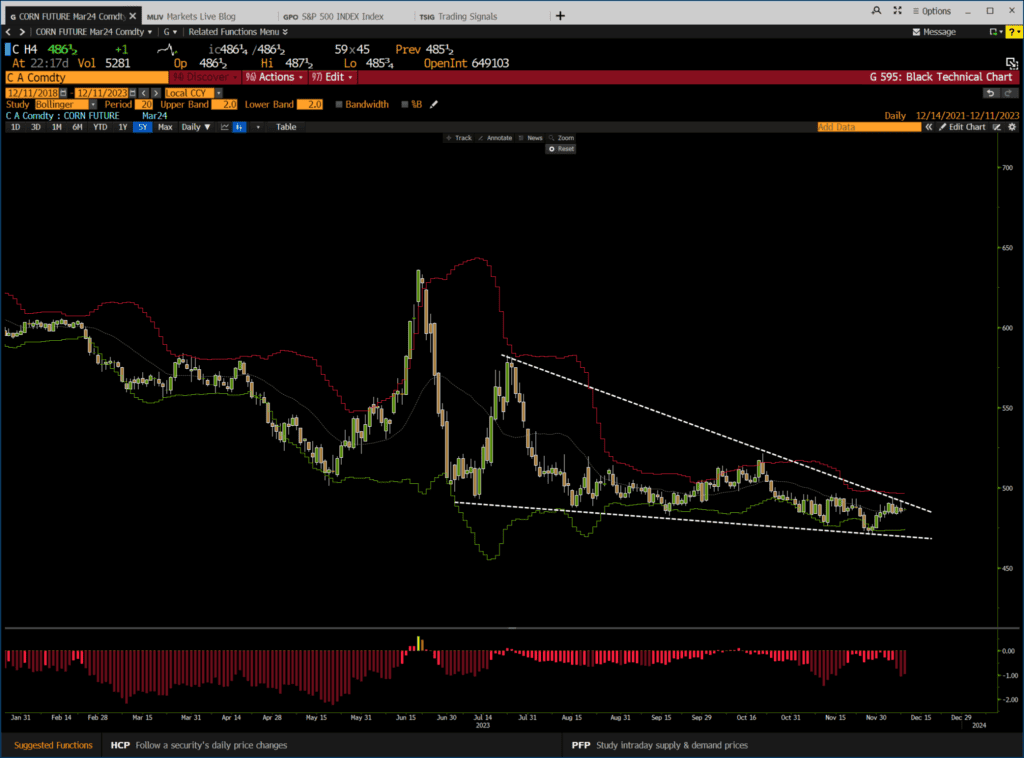
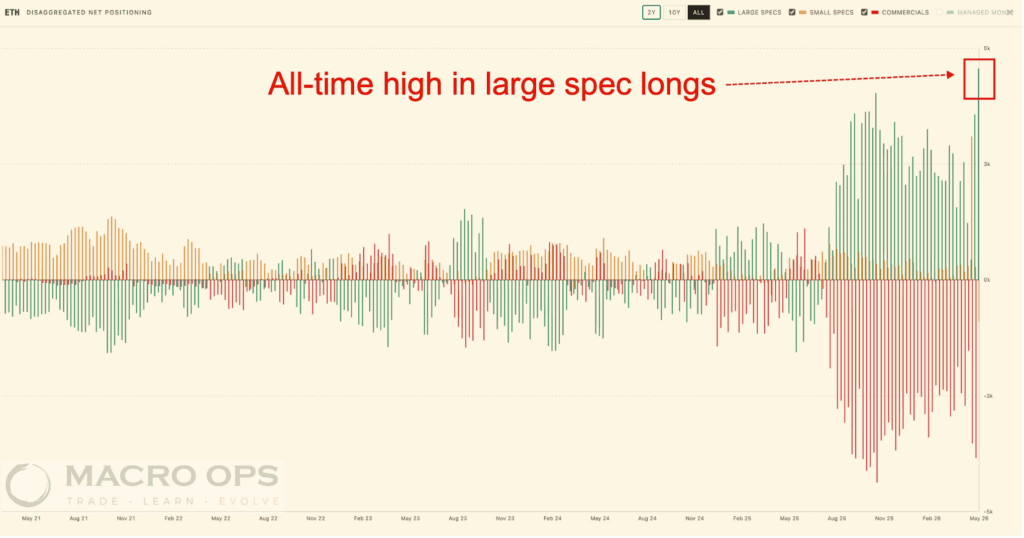
11. Corn recently hit over 2std oversold from its 20 and 50-day moving averages, and nearly 1.5std below its 200dma. Large and small specs are short. Our sentiment gauge is coming off the 0th percentile, as well as its valuation score. And it’s about to enter its strongest period of seasonality.
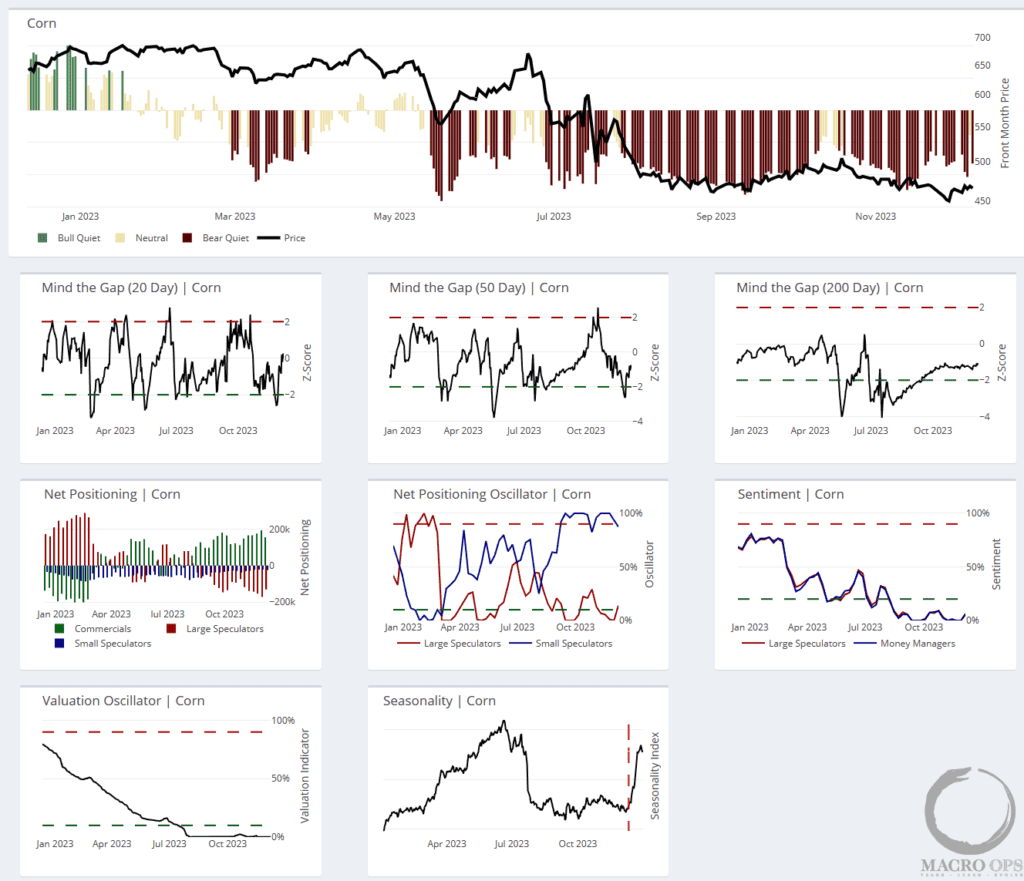
12. The chart has formed a nice falling wedge. We’ll look to get long on a confirmed breakout.