Summary: We have increasing conviction that we’re in the early stages of a cyclical top in US equities. Importantly, tops are processes, not events. And we expect this one to play out over the next 3–6 months. That means expect a lot of chop and vol, failed breakouts and breakdowns, as the tape swings wildly in a broad sideways pattern before rolling over into a cyclical bear market sometime in the latter half of 2027.
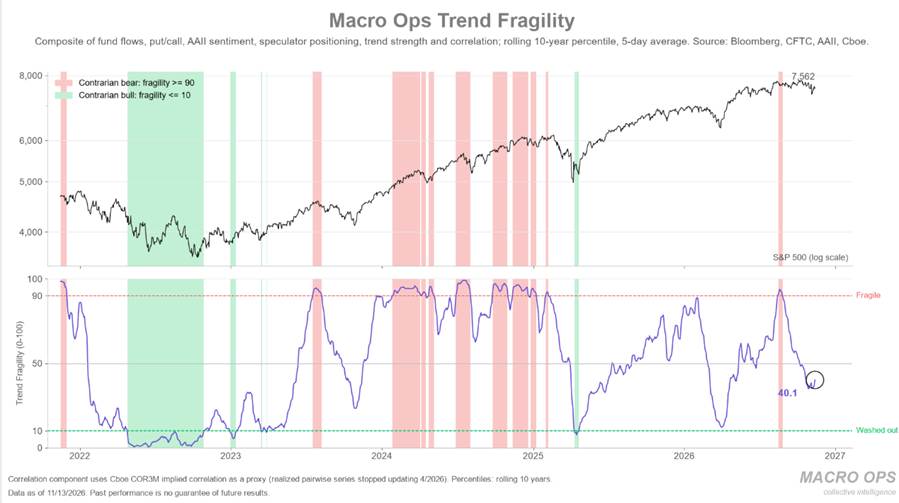
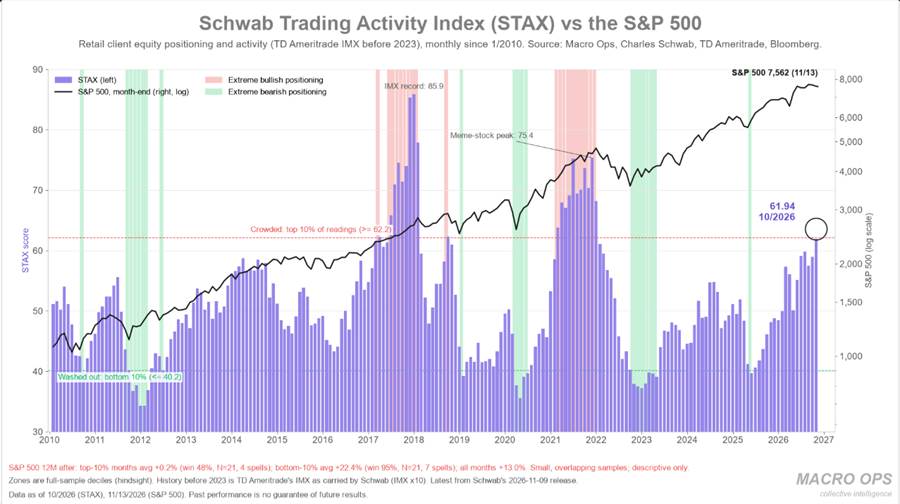
This view is informed by the key indicators we track, a few of which we share below. Our TLS remains at -3. Breadth is weak. We’re not even close to capitulation according to our Trend Fragility measure. And Schwab’s STAX shows retail aggressively bought the dip last month, sending the index to its highest level since Dec ’21.
*** Housekeeping note: As some of you know, the MO team recently joined an established asset management firm to manage capital utilizing the MacroOps investment process — if you are a qualified purchaser (please see attached description) and are interested in learning more, please let us know.
We’ve also recently expanded the team — bringing Dean Christians on board — and are in the process of merging our companies.
In November, MacroOps will relaunch with a new brand, website, and interactive quantitative dashboard featuring our models and proprietary historical datasets.
With these changes, we’ll be more than doubling Collective pricing at the relaunch to preserve the size and quality of our community. If you’ve been on the fence, now is a good time to try it and see if it’s a fit.***
MO Portfolio & Trades
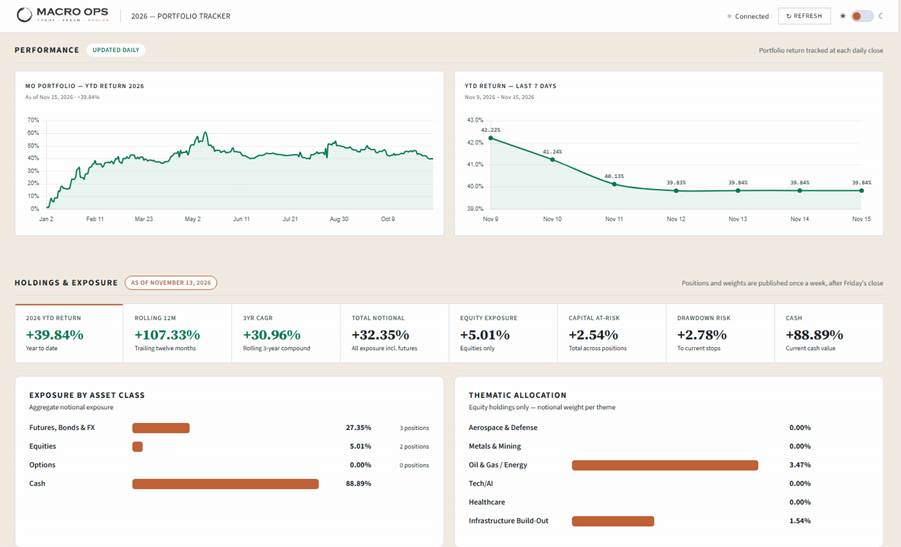
1. The portfolio fell 250 bps last week and sits at +39.9% on the year, below our YTD high-water mark of +61%. We continue to hold high levels of cash. We’re long GBP, FCG, and CRH. And short sugar and copper.
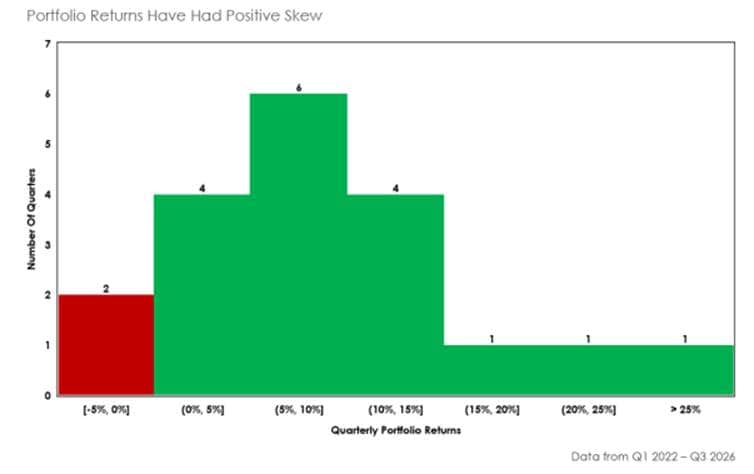
2. My teammate Brandon shared a deep dive into a recent attribution study we conducted on our trading over the past four years. My favorite graph from the study is the one below, showing the fat-tailed positive skew of our quarterly returns. You can read the full piece here.
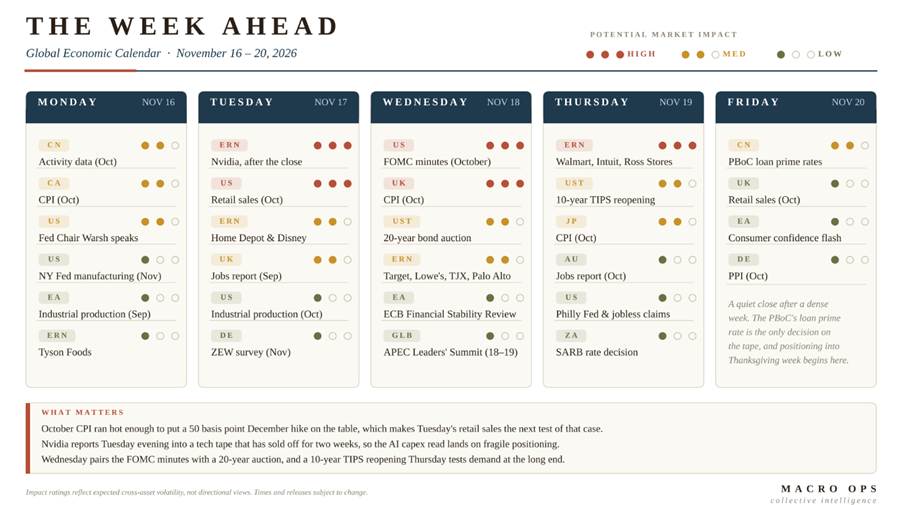
3. The week ahead in data. October CPI ran hot enough to put a 50 bp December hike on the table, making Tuesday’s retail sales the next test of that case. Nvidia reports Tuesday evening into a tech tape that has sold off for two weeks, so the AI capex read lands on somewhat reset positioning. Wednesday pairs the FOMC minutes with a 20-year auction, and Thursday’s 10-year TIPS reopening tests demand for inflation protection.
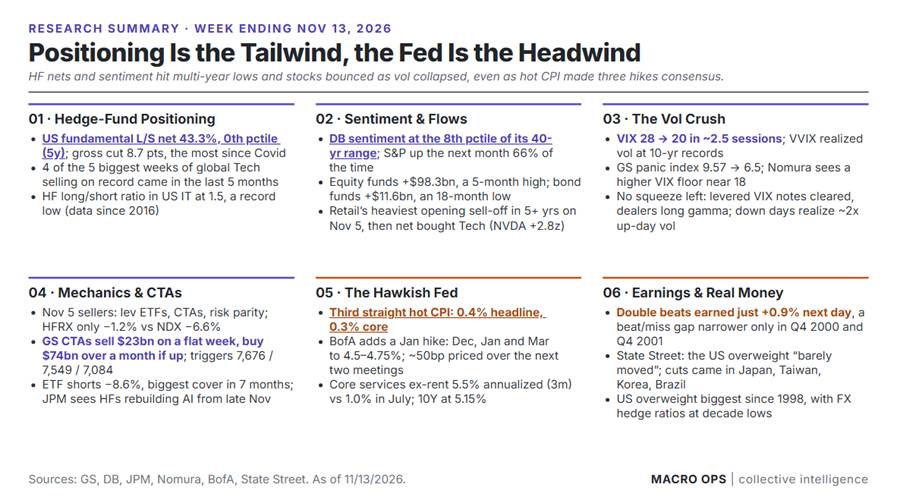
4. Bank research summary highlights: Hedge-fund net exposure hit its lowest level in at least five years and DB’s sentiment gauge reached the 8th percentile of its 40-year range, setting up a sharp bounce as the VIX fell from 28 to 20 and the S&P gained 2.5% on the week. A third straight hot CPI print made a hawkish Fed the consensus, with BofA now expecting hikes in December, January and March. Real money barely rotated: State Street’s custody data shows the US overweight intact and the largest since 1998, with currency hedges at decade lows. With CTAs set to buy roughly $74bn over a month in a rising market, light positioning is the tailwind, but rates and the Fed remain the headwind.
5. The Broadening Top pattern in the Qs is still in play. Our base case remains continued chop and vol, with skew to the downside. We believe equity markets are in a cyclical topping environment. Tops are processes, not events. And this one likely has another 3–6 months to play out before an eventual rollover into a cyclical bear.
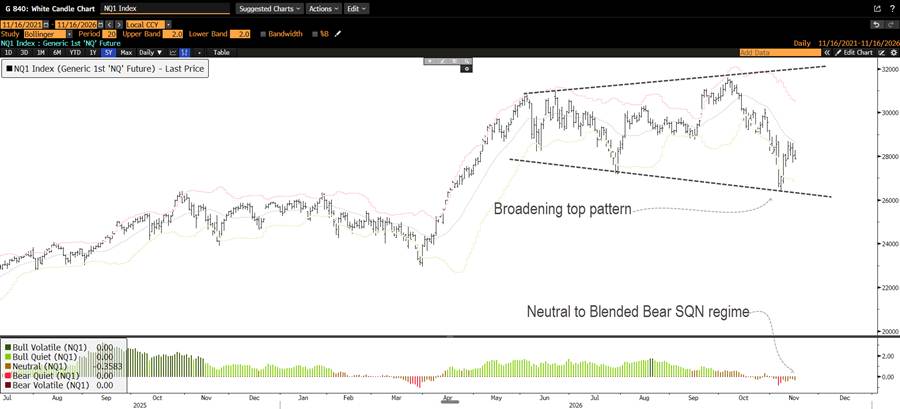
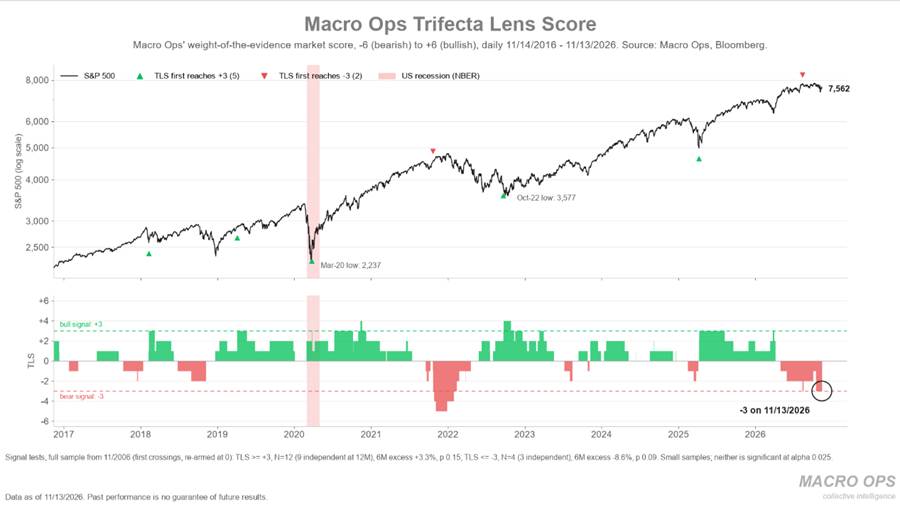
6. I’m going to keep updating our core MO charts here each week to track what our key indicators are saying.
Our Trifecta Lens Score (TLS), an aggregate of aggregates covering our key technical, breadth, liquidity, internals, and macro data points, remains at -3. It’s been there since the start of October, when it triggered its first significant sell signal since Dec ’21.
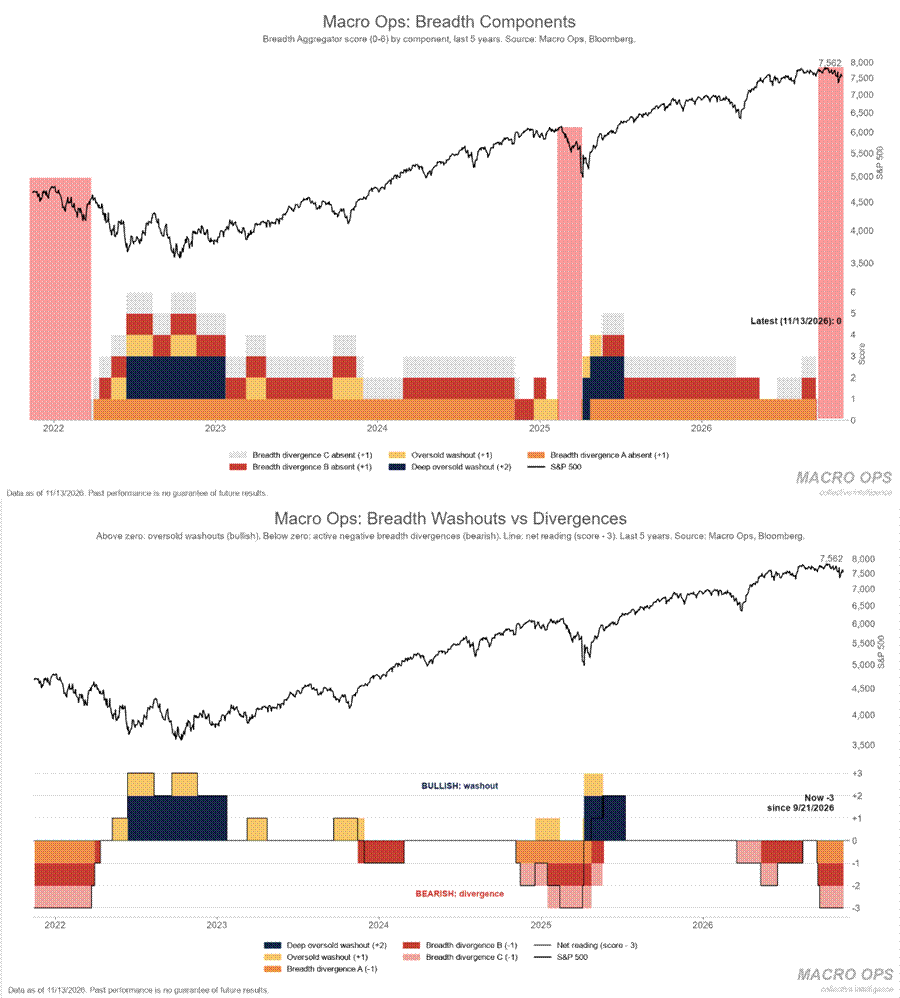
7. Our Aggregate Breadth Indicator is at 0. The red-highlighted sections mark past instances. And our Aggregate Breadth Divergence indicator is at -3, its lowest reading since the pre-Liberation Day selloff.
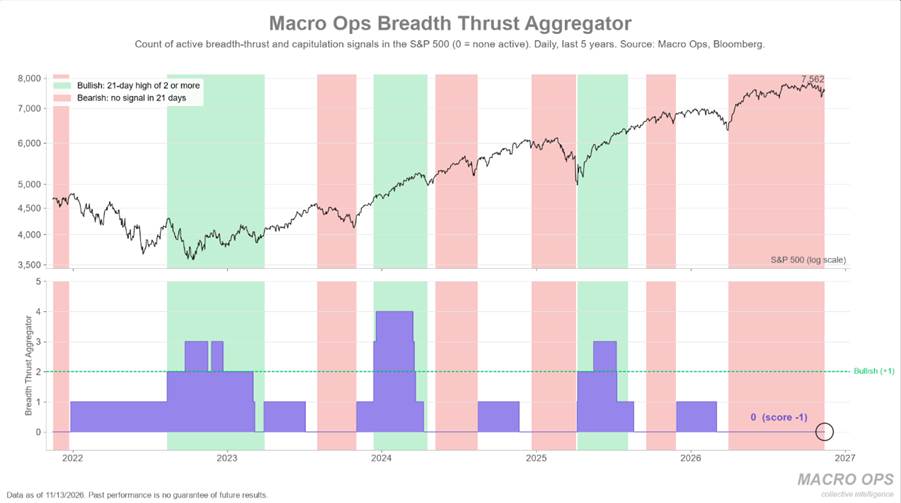
8. If we’re expecting a durable bottom in stocks, we should see it confirmed by breadth thrusts. Our Aggregate Breadth Thrust indicator has been flat for the past 6+ months.
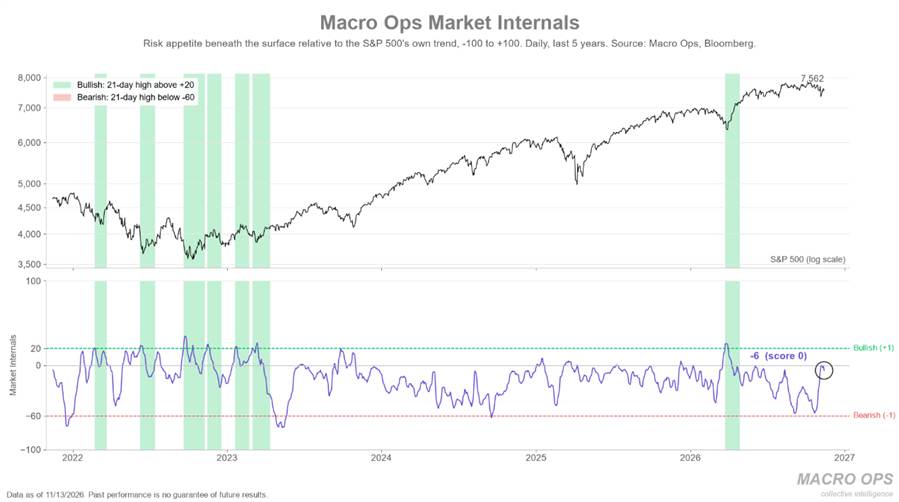
9. Our Market Internals indicator is neutral, still well below the +20 level needed to trigger a Buy signal.
10. Our Trend Fragility indicator, a composite of sentiment and positioning measures, shows we still haven’t seen true capitulation. It remains firmly in neutral territory following its Sell signal in early October.
11. Schwab’s STAX index is one of my favorite measures of real retail positioning and flows. It’s a cross-sectional look at what millions of retail trading accounts are actually doing with their money. The chart below includes historical data from TD Ameritrade’s IMX, before Schwab acquired them.
You can see that retail investors have not been fazed by this market. At all. In fact, they aggressively bought the dip last month, driving STAX to its highest level since the Dec ’21 top.
Here are the key takeaways from Schwab’s own post (link here):
- The Schwab Trading Activity Index™ rose 5.13% to 61.94 in October, its highest level since December 2021.
- Every generation posted a record STAX score, led by Gen X, while nearly every asset tier also reached a new high.
- AI-linked tech stocks accounted for nearly all of the top net buys, as clients apparently bought the dip despite concerns about heavy spending and mounting debt.
This is what tops are made of…
12. Speaking of troubling sentiment, my teammate Dean Christians had this to say in his latest report for Collective members over the weekend. He writes:
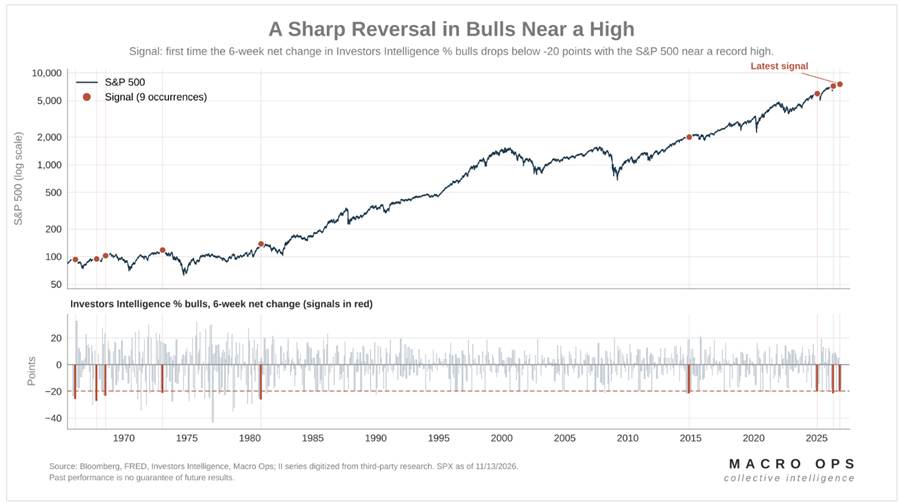
“Sentiment has moderated, but it hasn’t reached the kind of pessimistic extreme that tends to create a fat-pitch contrarian opportunity. Instead, what we’ve experienced is arguably one of the more dangerous sentiment developments: a reversal from excessive optimism. These reversals can be particularly damaging because they undermine investor confidence and leave market participants reluctant to rebuild positions or increase exposure.
“We’re seeing this play out in the granddaddy of sentiment surveys, Investors Intelligence, where the percentage of bulls has fallen from above 57% to 37% in just six weeks. Notably, this deterioration has occurred while the S&P 500 remains within 5% of its record high, as the red dots in the chart below highlight. History offers some cautionary examples, with similar sentiment reversals occurring near market peaks in 1966, 1973, 1980, and 2025.”
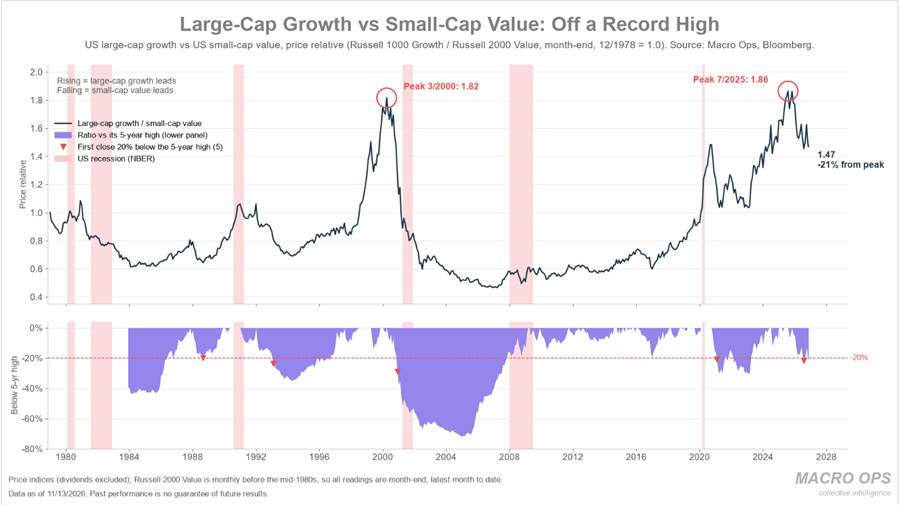
13. Add this to the growing list of things you see at a Core-centric market top…
Large-cap stocks have materially underperformed their small-cap counterparts over the past 12+ months, with the large-cap/small-cap ratio falling more than 20% from its July 2025 peak.
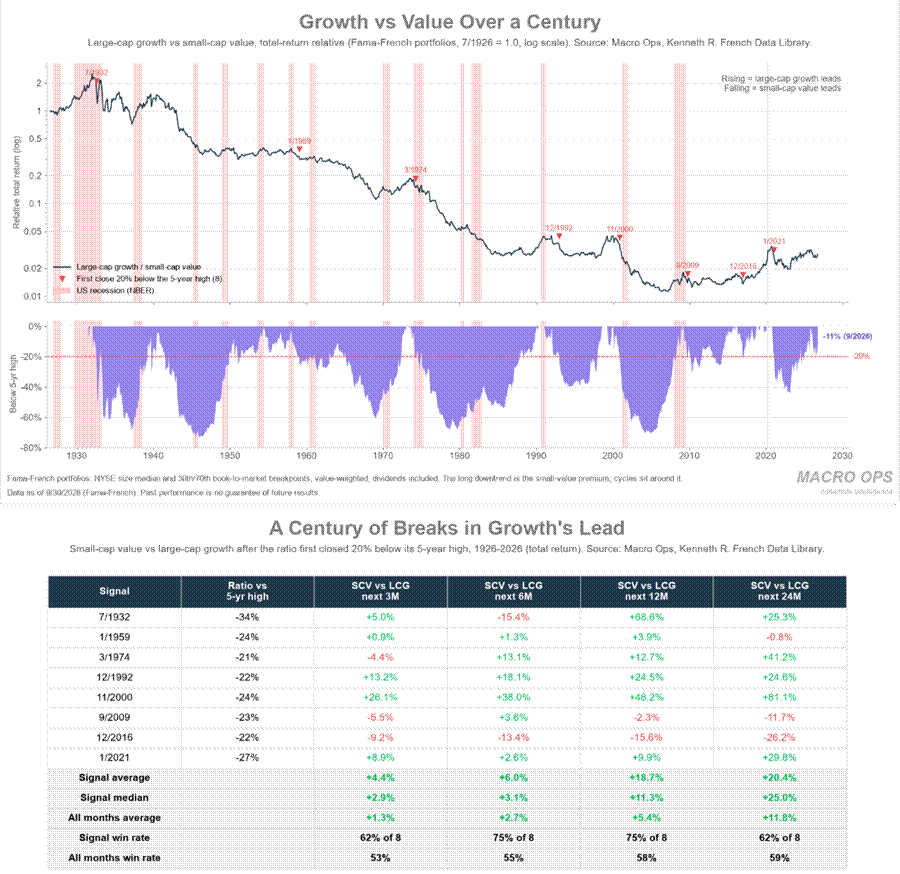
14. The chart and table below show over a century of similar large-cap/small-cap regime changes. Historically, a decline of 20% or more in relative performance has tended to lead to further large-cap underperformance over the following 3, 6, and 12 months.
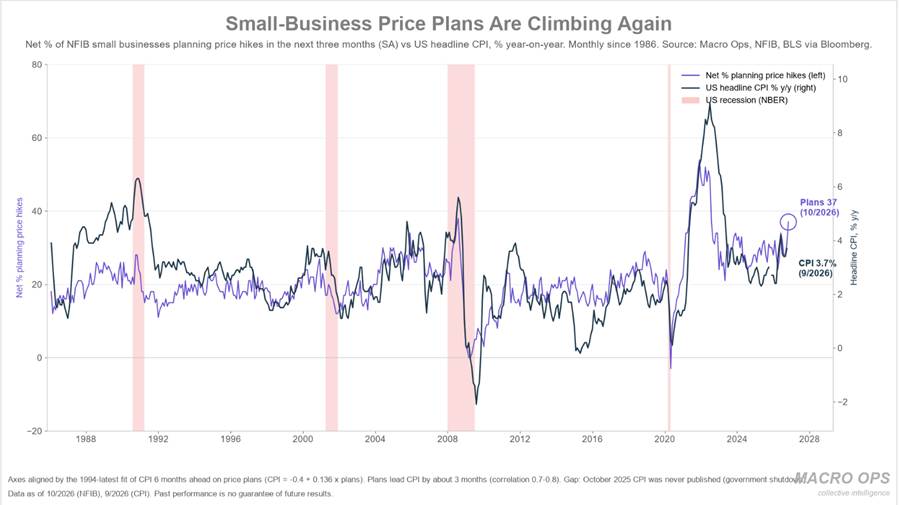
15. NFIB Small Business Price Plans are climbing again, pointing to higher CPI in the coming months
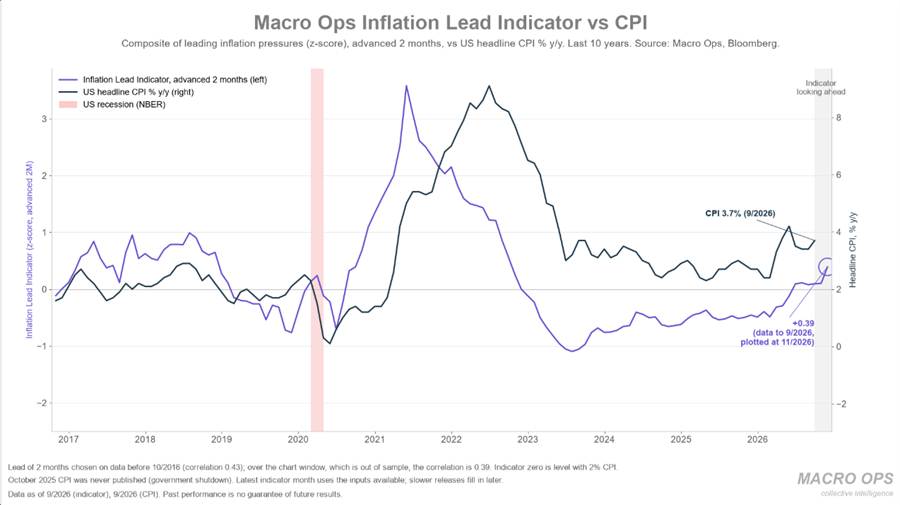
16. This is being confirmed by our MO Inflation Lead, which is also accelerating higher and has historically led CPI by 2–3 months.
17. Our current base case is that we’re going to see significant escalation in the US-Iran conflict before year’s end.
The US now has three carrier groups in CENTCOM. USS Roosevelt arrived Sunday. That’s the heaviest US naval presence there since last April’s Iran war.
We’ll be sharing our thoughts with Collective members soon, along with an updated interview with one or two of my old intel colleagues on the situation (visual via @osint613).

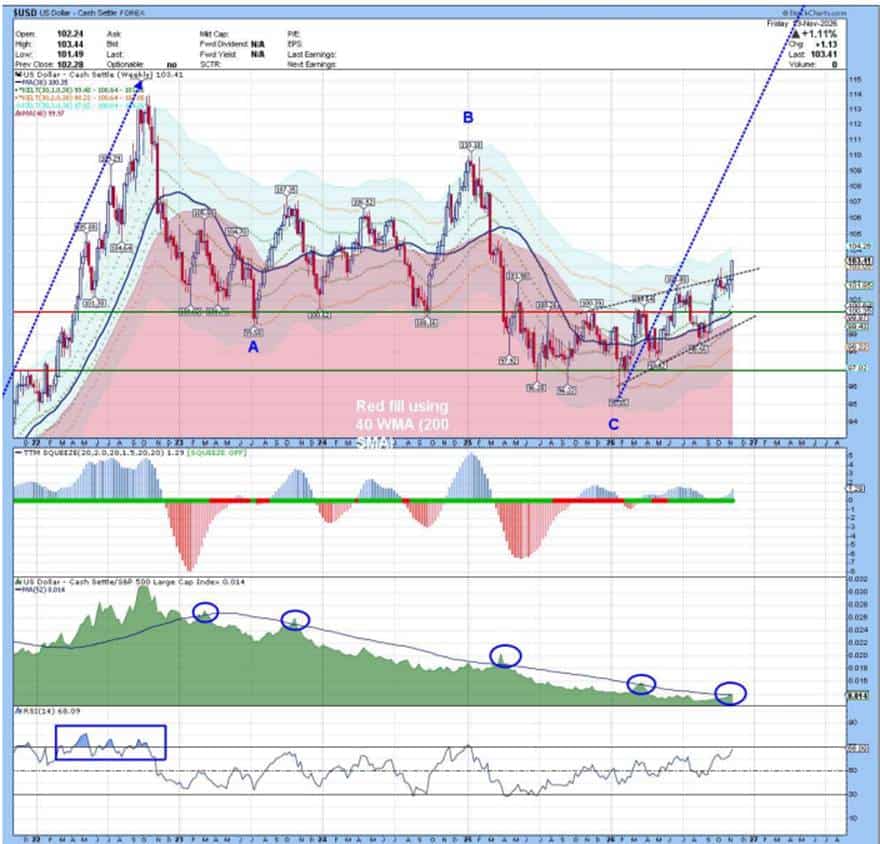
18. Collective member @PhilD shared this DXY A-B-C corrective chart in his excellent weekly review in our Slack’s General channel over the weekend.
I’m miffed that I let my increasingly bearish cyclical USD bias blind me to this tactical setup. If we get a consolidation or pullback here, we’ll use that opp to get long.
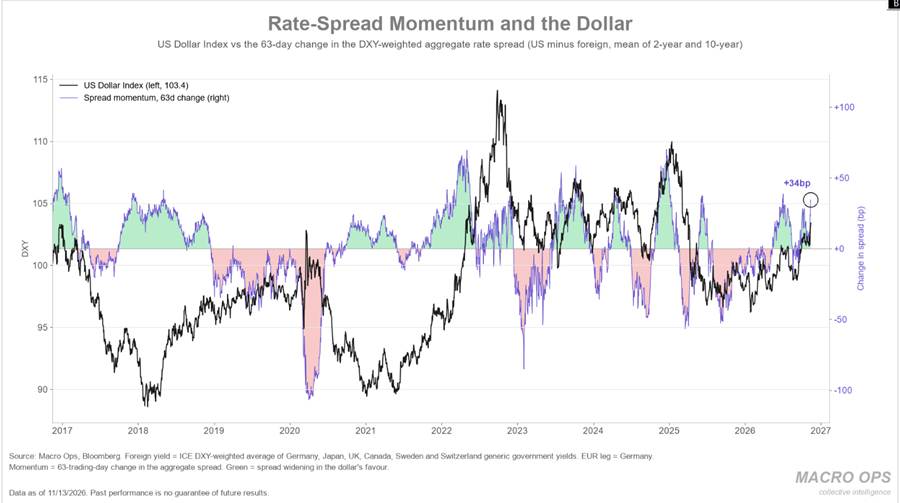
19. Our DXY Aggregate Rate Spread Momo chart led this breakout.
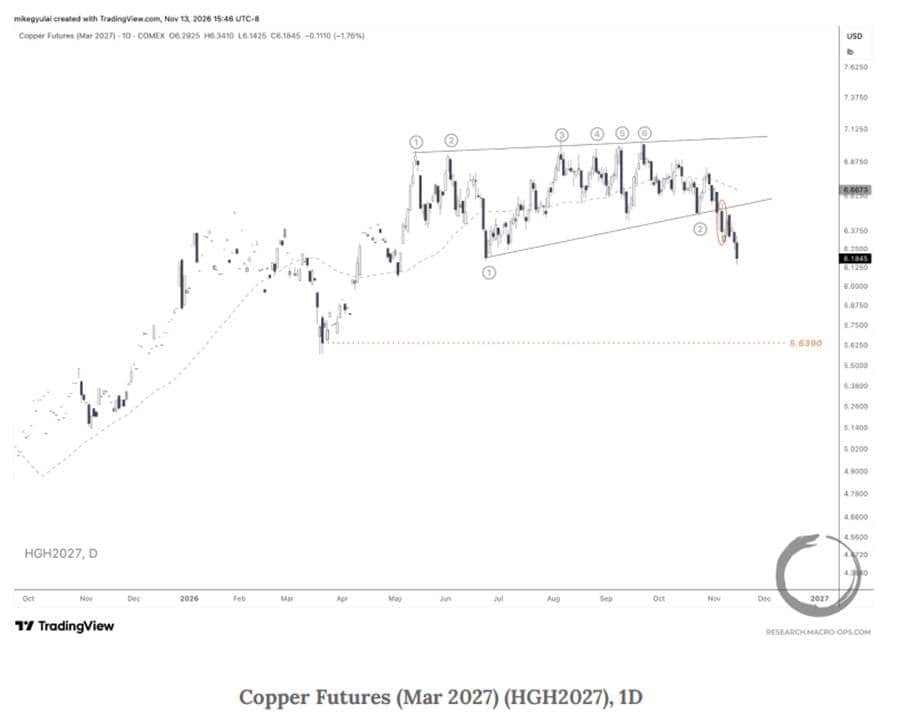
20. Our resident Classical Chartist Mike G updates the developing short copper trade in his latest weekly (link here). We are short.
Thanks for reading.