A Four-Year MO Returns Analysis
Earlier this year, Alex and I announced that we joined a Boston-based hedge fund. One of our long-term goals at Macro Ops was to manage money in a fund, so to have it happen this year was a dream come true.
Part of the onboarding involved the fund’s extensive due diligence on our process, returns, and trade alerts going back to 2022 (when we started tracking every trade in the #mo-trade-alerts channel).
To do this, they went through our trade alerts Slack channel and cataloged and verified every trade. Even with AI assistance, the analysis took hundreds of hours. It was a ton of work.
The analysis was far more rigorous than anything Alex and I had done over the years. The firm uncovered things about our trading that we intuitively believed but hadn’t backed with hard data.
Importantly, the study wasn’t just about performance. Part of it was validating our process to ensure we executed it to the degree that we preached. For instance, we preached risk management … but did we actually practice it over time? It’s about understanding our process and exploring the intricacies of what we can control on every trade.
We wanted to share this because you deserve these insights as Collective members (you shouldn’t pay for a bad strategy!), and because it’s something we should all practice in our own trading over time.
But before diving into the data, charts, and results from the study, I want to step back and explain why we trade the way we trade … why we stress the Trifecta Lens, and what we’re trying to solve for at Macro Ops.
I hope this analysis gives you as much insight and clarity into our trading process as it did for us.
Also, Housekeeping note: We’ve recently expanded the team — bringing Dean Christians on board — and are in the process of merging our companies.
In November, MacroOps will relaunch with a new brand, website, and interactive quantitative dashboard featuring our models and proprietary historical datasets.
With these changes, we’ll be more than doubling Collective pricing at the relaunch to preserve the size and quality of our community. If you’ve been on the fence, now is a good time to try it and see if it’s a fit.
Let’s get after it.
The “Why” Behind our Trifecta Lens Approach
We constantly write about the Trifecta Lens approach and how we apply it to trading markets. But it’s important to discuss why we use the approach in the first place.
It starts with our Main Goal at Macro Ops: asymmetric returns.
Everything we do from fundamental/macro analysis, regime identification, trade selection, and trade management revolves around this Main Goal of creating asymmetry within each trade.
Our Trifecta Lens process “looks down” before it “looks up.” In other words, it’s all about not losing money (remember Buffett’s first two rules!). If we can do that, the upside will inevitably take care of itself.
In practice, this looks like a stair-stepped equity curve with long periods of small gains, small wins, and the occasional big winner. We try to avoid the big gap downs as much as possible.
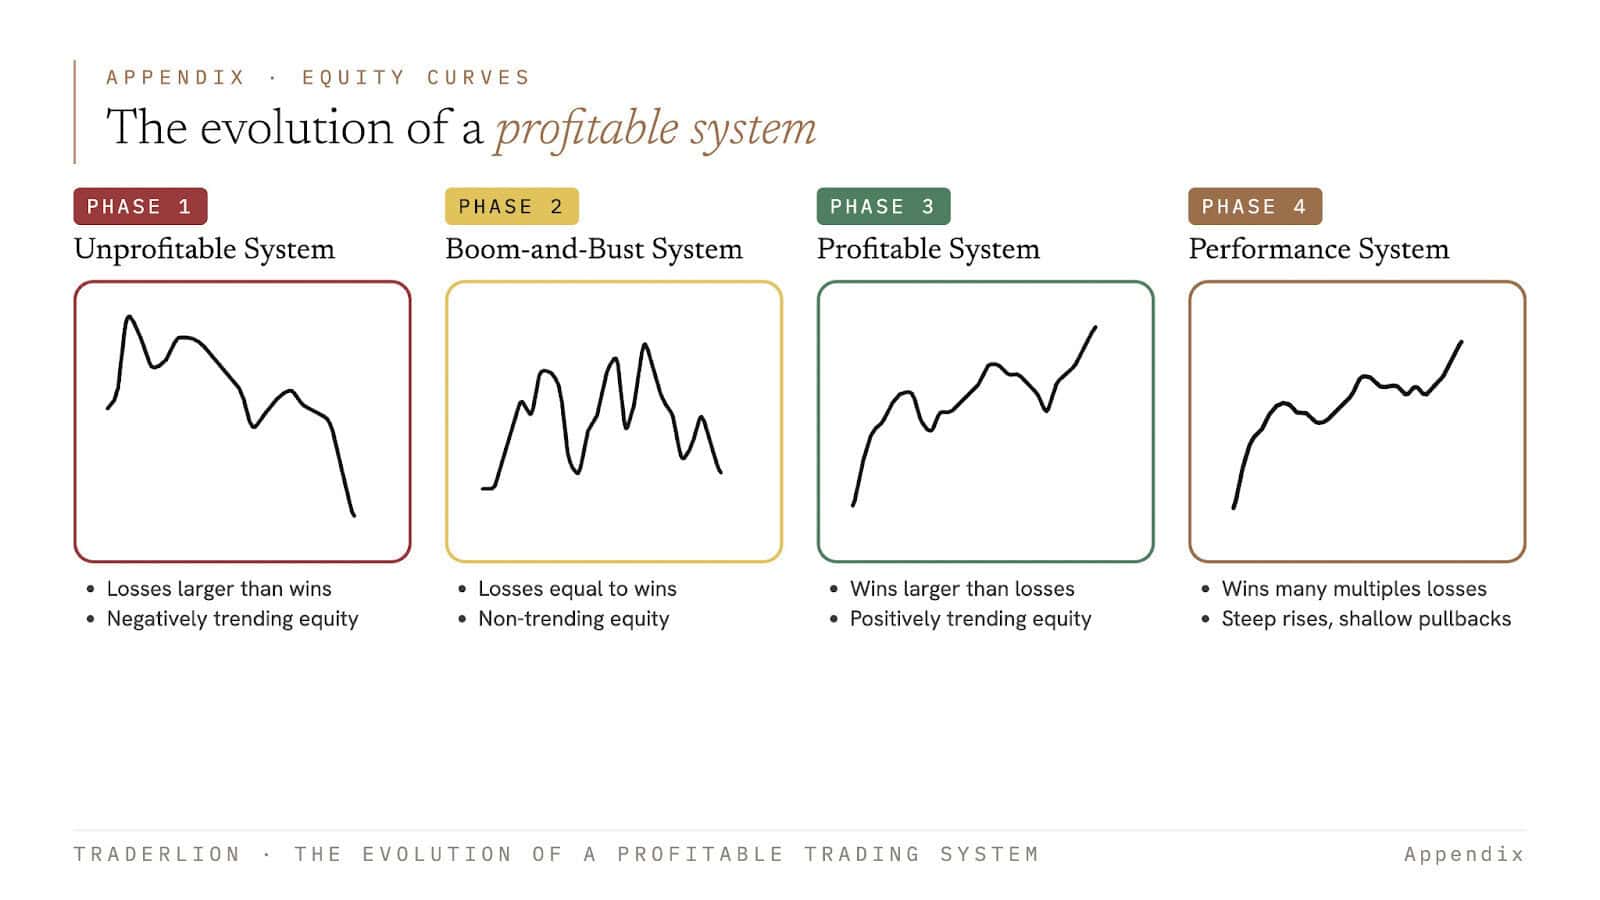
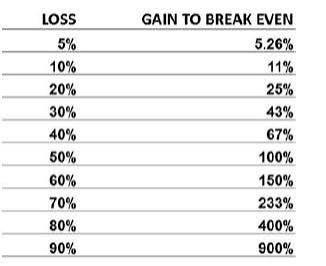
This approach has two main benefits. First, it preserves our mental capital by not enduring huge losses. Second, it allows us to climb out of drawdowns faster because smaller losses require smaller gains to recoup.
We accomplish this by stacking asymmetry at three levels: trade entry, trade management, and portfolio management.
Before diving into the asymmetry analysis, I want to provide a high-level overview of the data the fund reviewed:
- Source data: Real-time trade alerts in the #mo-trade-updates Slack channel since January 1, 2022.
- Analysis Period: January 2022 – July 2026
- Every trade validated by a third party (this being the fund)
- Total trades: 826
Stacking Asymmetries: Fractal Pattern Risk Management
There are three ways we stack asymmetric return profiles in our trading:
1. Trade Entry
Every trade has a pre-defined risk point (or stop loss) that forces us out of the position. We don’t debate about cutting the position once it reaches the stop loss. We can get back in later if the opportunity presents itself again.
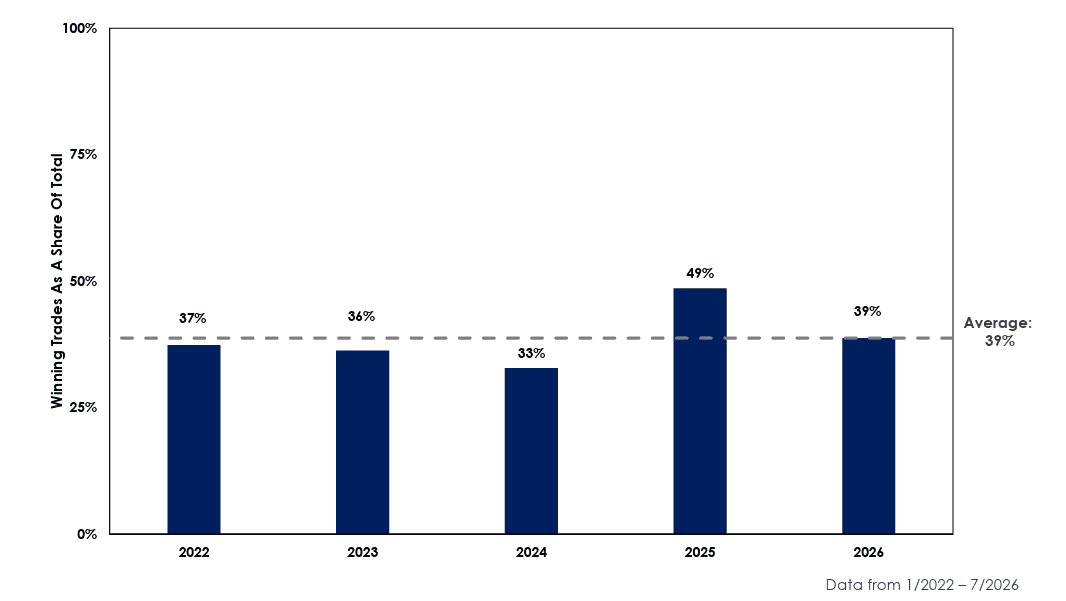
This trade-entry risk management results in many small, losing trades and low win rates.
For instance, our average win rate since 2022 is 39%, with some years dipping as low as 33% (see below).
The performance results shown are hypothetical and do not represent actual trading in any client account. Hypothetical trading does not involve financial risk, and no hypothetical trading record can completely account for the impact of financial risk in actual trading — for example, the ability to withstand losses or adhere to a particular trading program in spite of trading losses are material points which can adversely affect actual trading results. Investment management fees, custody and other costs, and taxes are not included in these results; if reflected, performance would be lower. No representation is being made that any account will or is likely to achieve profits or losses similar to those shown. Please refer to the disclaimer at the end of this piece for full details.
2. Trade Management
Entries and exits are the first leg in creating asymmetric return profiles. The second step is in managing the trade once we’re in it. If a trade doesn’t hit our initial stop loss, we keep it on but protect profits by moving our initial stop to breakeven.
As Peter Lynch says, we cut our losers quickly and let our winners run.
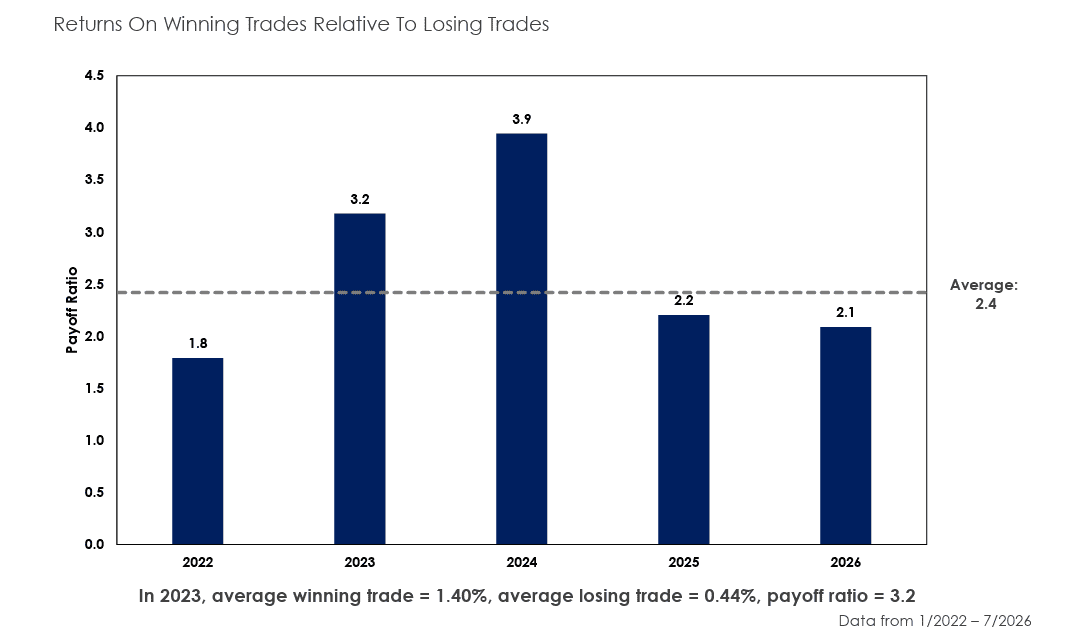
The result is a highly asymmetric Payoff Ratio over time. For example, our average Payoff Ratio since 2022 is 2.4x. In other words, on average, we win 2.4x more on our winners than we lose on our losing trades (see below).
The performance results shown are hypothetical and do not represent actual trading in any client account. Hypothetical trading does not involve financial risk, and no hypothetical trading record can completely account for the impact of financial risk in actual trading — for example, the ability to withstand losses or adhere to a particular trading program in spite of trading losses are material points which can adversely affect actual trading results. Investment management fees, custody and other costs, and taxes are not included in these results; if reflected, performance would be lower. No representation is being made that any account will or is likely to achieve profits or losses similar to those shown. Please refer to the disclaimer at the end of this piece for full details.
This allows us to be wrong repeatedly and still maintain a positively skewed return profile. Take 2024 as an example. It was our worst win-rate year in the sample size at 33%. Yet we made nearly 4x on our winners, while we lost on our losing trades.
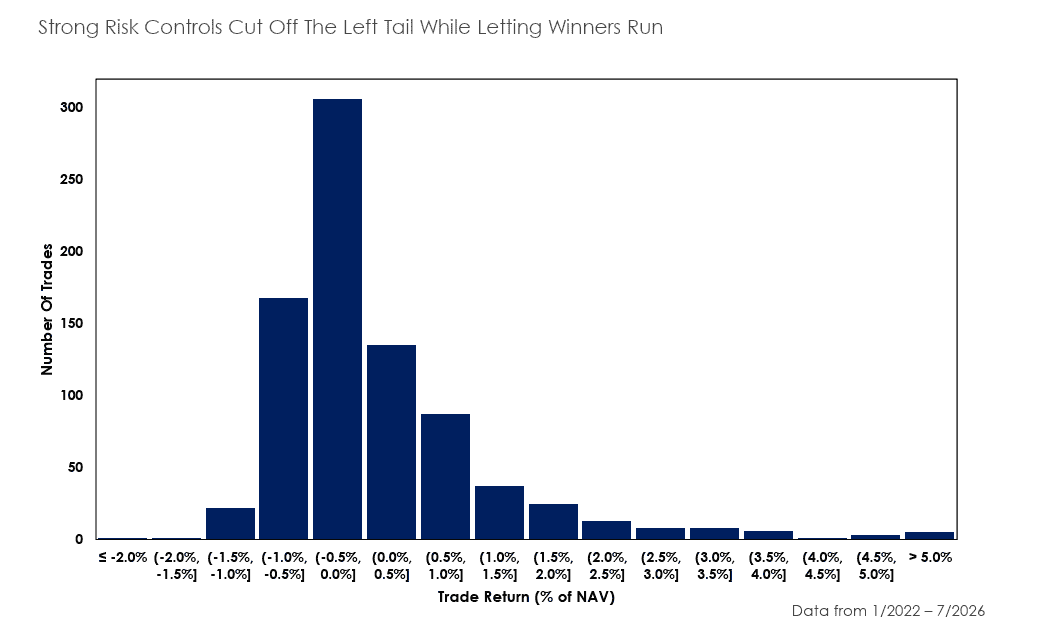
Here’s another reason why the analysis was so important. We intuitively knew we cut the left tail through trade entry and trade management. But we didn’t have the hard data to back it up until now (see below).
The performance results shown are hypothetical and do not represent actual trading in any client account. Hypothetical trading does not involve financial risk, and no hypothetical trading record can completely account for the impact of financial risk in actual trading — for example, the ability to withstand losses or adhere to a particular trading program in spite of trading losses are material points which can adversely affect actual trading results. Investment management fees, custody and other costs, and taxes are not included in these results; if reflected, performance would be lower. No representation is being made that any account will or is likely to achieve profits or losses similar to those shown. Please refer to the disclaimer at the end of this piece for full details.
This is the visual example of “cutting losers quickly and letting winners run.” We cut our left tail around 0.50%-1% losses. But look at the right tail. It spans out to 5%+ returns.
Again, looking down before looking up.
3. Portfolio Management
The final piece in stacking asymmetry in returns comes from portfolio management. One way to think about portfolio management is the stacking of smaller, more fractal-pattern asymmetric returns from trade entry and trade management.
In essence, our portfolio management reflects every individual trade entry and trade management decision.
Just as we cut our individual losing trades quickly, we are equally quick to reduce portfolio risk if we’re in a drawdown (i.e., not seeing the ball well).
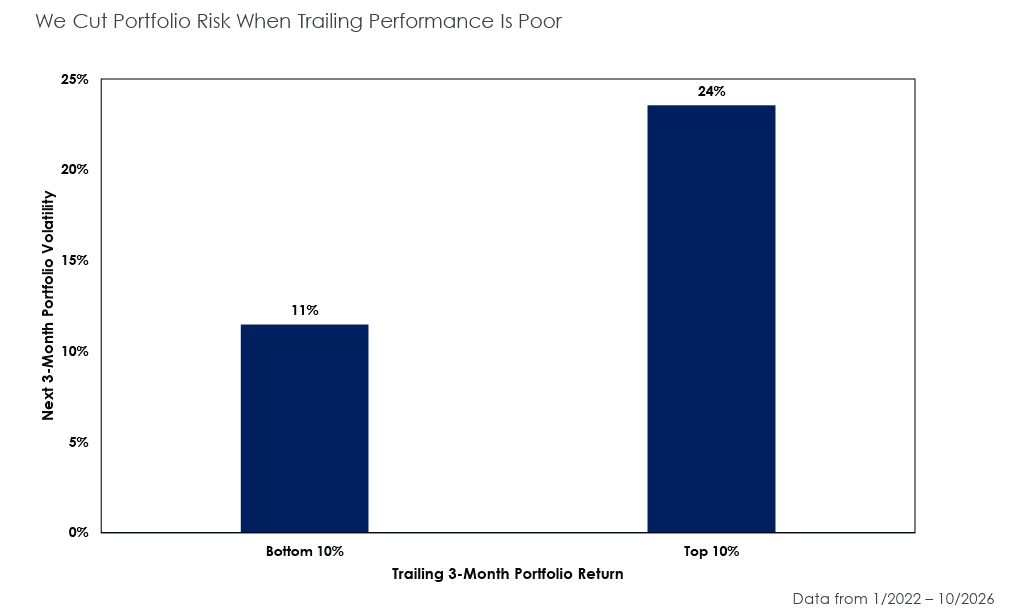
The data showed that our process de-risked during periods of low performance, and increased risk during periods of high performance (see below).
The performance results shown are hypothetical and do not represent actual trading in any client account. Hypothetical trading does not involve financial risk, and no hypothetical trading record can completely account for the impact of financial risk in actual trading — for example, the ability to withstand losses or adhere to a particular trading program in spite of trading losses are material points which can adversely affect actual trading results. Investment management fees, custody and other costs, and taxes are not included in these results; if reflected, performance would be lower. No representation is being made that any account will or is likely to achieve profits or losses similar to those shown. Please refer to the disclaimer at the end of this piece for full details.
Over the past four years, our process has cut risk nearly in half during periods of underperformance. We cut losers quickly and let winners run.
Again, we always intuitively believed this about our process. We intuitively traded smaller during cold streaks and larger when we had PnL cushion. Now we have the data to back up that intuition.
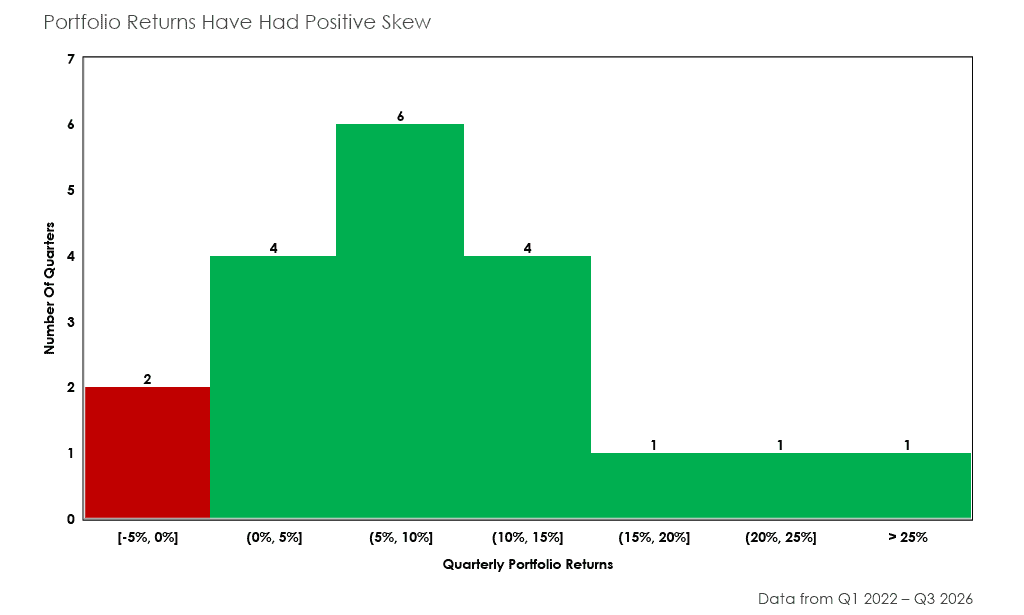
Zooming out, focusing on portfolio risk management helps us reduce the probability of consecutive losing quarters. Check out the slide below highlighting our quarterly return skews since 2022.
The performance results shown are hypothetical and do not represent actual trading in any client account. Hypothetical trading does not involve financial risk, and no hypothetical trading record can completely account for the impact of financial risk in actual trading — for example, the ability to withstand losses or adhere to a particular trading program in spite of trading losses are material points which can adversely affect actual trading results. Investment management fees, custody and other costs, and taxes are not included in these results; if reflected, performance would be lower. No representation is being made that any account will or is likely to achieve profits or losses similar to those shown. Please refer to the disclaimer at the end of this piece for full details.
I know I sound like a broken record, but it’s hard to overstate the importance of cutting the left tail. The data consistently showed that.
Putting The Data Together
Our Trifecta Lens process is a fractal pattern approach to risk management. By focusing on risk each step of the way from individual entries/exits, to trade management, to portfolio management, we ruthlessly cut the left tail and let our winners run.
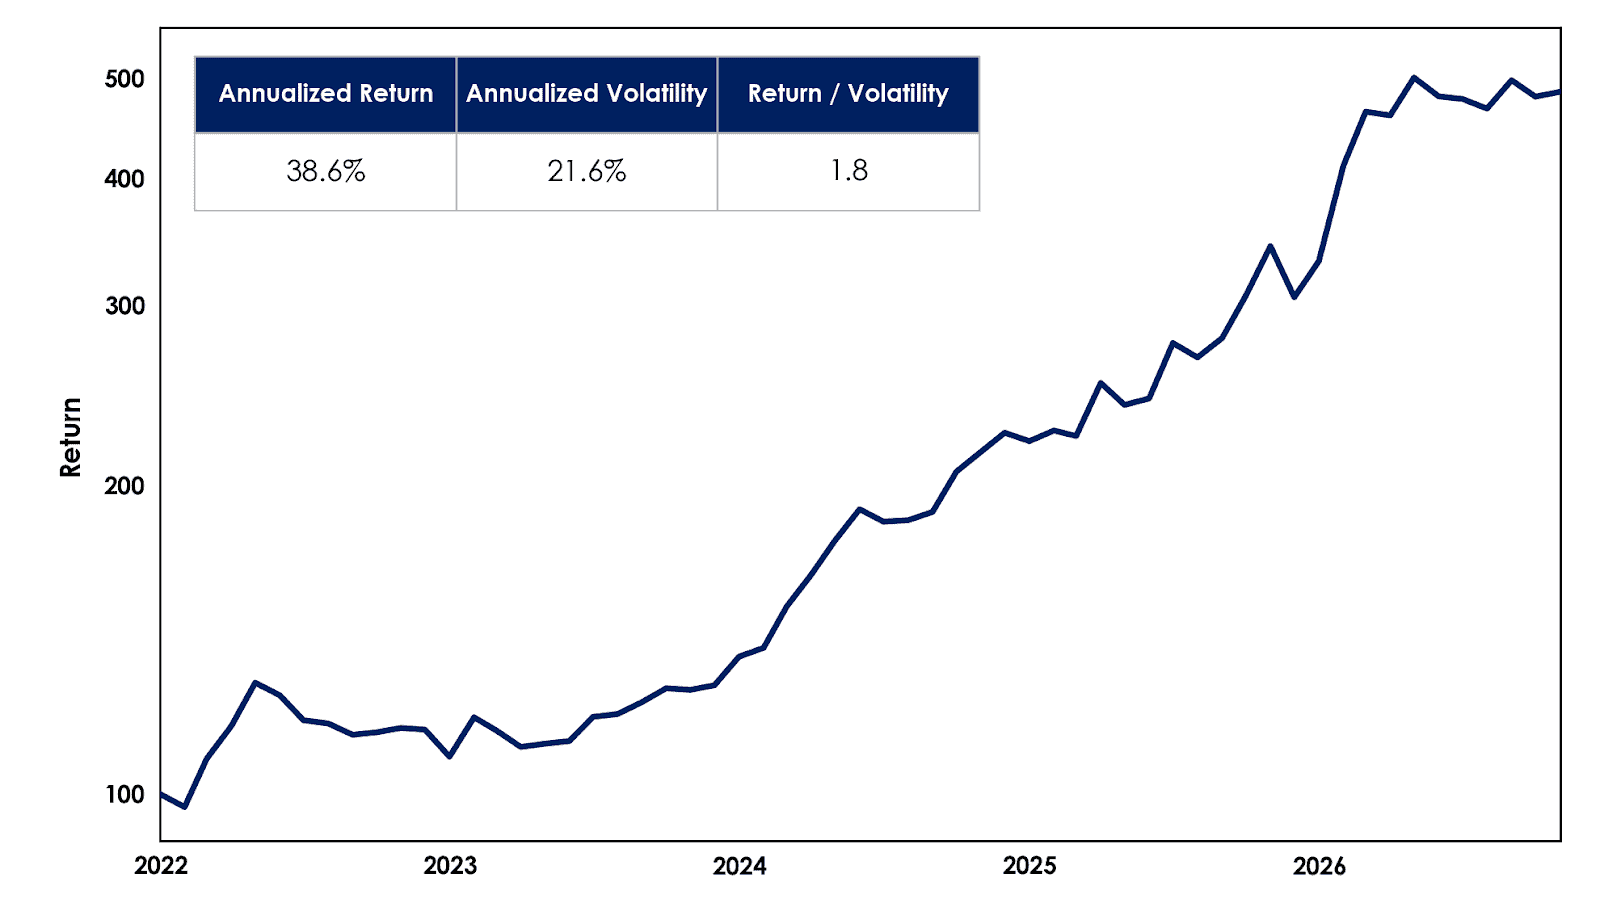
Below is the equity curve from our MO Tracking Port over the four-year period.
The performance results shown are hypothetical and do not represent actual trading in any client account. Hypothetical trading does not involve financial risk, and no hypothetical trading record can completely account for the impact of financial risk in actual trading — for example, the ability to withstand losses or adhere to a particular trading program in spite of trading losses are material points which can adversely affect actual trading results. Investment management fees, custody and other costs, and taxes are not included in these results; if reflected, performance would be lower. No representation is being made that any account will or is likely to achieve profits or losses similar to those shown. Please refer to the disclaimer at the end of this piece for full details.
We can’t control our future equity curve. However, this analysis confirmed an intuition Alex and I have always believed about our Trifecta Lens process. The process did three things:
- Managed risk at the entry/exit, trade, and portfolio levels
- Traded smaller during periods of relative underperformance
- Generated performance during periods of low win-rates
Due diligence has increased our conviction that what we’re doing works not just in bull markets, but across any market regime in any asset class. We believe in the process’s robustness.
Robust Performance Through Cycles and Markets
Alex and I have always believed our process would excel through different market regimes and cycles. We also believed the strategy would allow us to generate returns outside equity markets if we didn’t see a highly asymmetric setup (or a reason to play in equities). We’ve published our trades and written annual performance reviews for the past seven years. So we knew the strategy could perform well across different regimes and adapt to different environments.
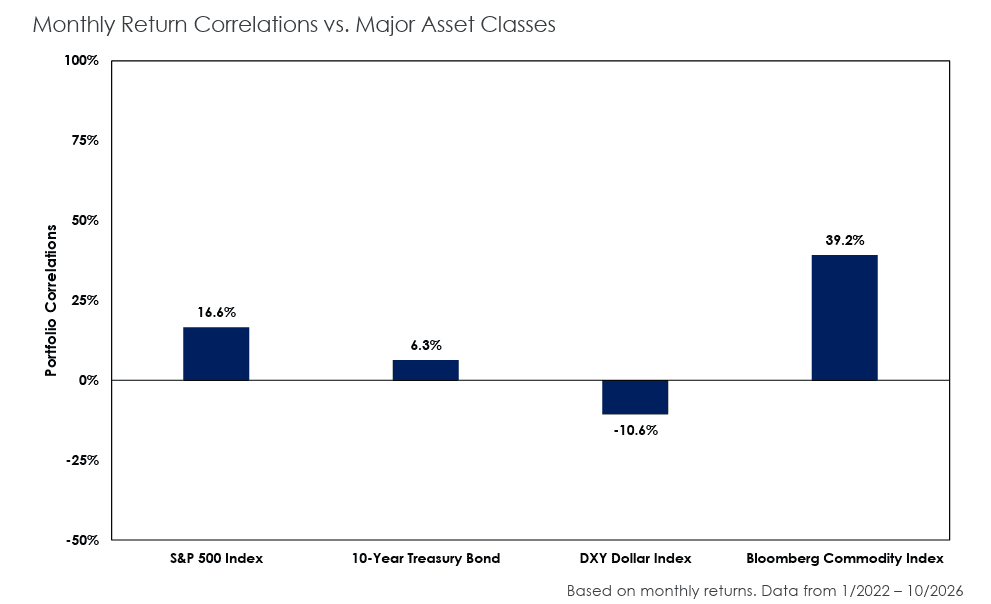
The data below highlights the strategy’s robustness.
The performance results shown are hypothetical and do not represent actual trading in any client account. Hypothetical trading does not involve financial risk, and no hypothetical trading record can completely account for the impact of financial risk in actual trading — for example, the ability to withstand losses or adhere to a particular trading program in spite of trading losses are material points which can adversely affect actual trading results. Investment management fees, custody and other costs, and taxes are not included in these results; if reflected, performance would be lower. No representation is being made that any account will or is likely to achieve profits or losses similar to those shown. Please refer to the disclaimer at the end of this piece for full details.
This is important because market regimes change. Secular bull markets can quickly change to secular bear markets. Late-cycle regimes look and trade much differently than early-to-mid-cycle regimes.
Our entire goal was to develop a strategy that performed across all market regimes, good and bad.
Over the four-year period, the MO Tracking Portfolio had low correlation to almost every other asset class. 17% for the S&P, 6.3% to the 10YR, and -10.6% to the dollar. The strategy had a 39% correlation to the BCI, but most of that was due to the commodities/precious metals bull market, which we participated in during 2023-2025.
This matters because our work shows we’re now in a Late Cycle market regime and headed for a secular trend change. These secular turns in markets occur roughly every 5-15 years, depending on whether it’s a Core- or Peripheral-driven regime.
This Core-centric regime has been historic in both its duration and intensity. Most money managers in the game today have known only this regime and its specific traits.
And, as we’ve witnessed over the past five months, most are overly optimized for these very specific market conditions. A Peripheral-centric regime behaves quite differently. So, adaptability in one’s process and the ability to shift focus across themes and asset classes are paramount to ensuring resiliency.
The performance results shown are hypothetical and do not represent actual trading in any client account. Hypothetical trading does not involve financial risk, and no hypothetical trading record can completely account for the impact of financial risk in actual trading — for example, the ability to withstand losses or adhere to a particular trading program in spite of trading losses are material points which can adversely affect actual trading results. Investment management fees, custody and other costs, and taxes are not included in these results; if reflected, performance would be lower. No representation is being made that any account will or is likely to achieve profits or losses similar to those shown. Please refer to the disclaimer at the end of this piece for full details.
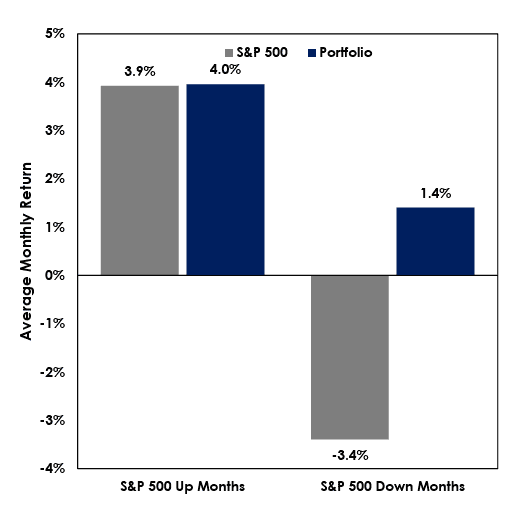
The chart above is one of my favorites from the due diligence process. During S&P up-months, our strategy tracked well and even outperformed on average.
However, our strategy excelled during periods of market drawdowns. Over the four-year analysis period, our strategy generated +1.4% returns in months when the S&P 500 declined.
In other words, almost all our outperformance came in down months for the S&P 500. This further confirms that we cut our losers quickly, let our winners run, and trade lightly when we’re not seeing the ball well.
There are three specific reasons we generated outperformance during market drawdowns:
- Equity exposure is targeted and thesis-driven, not general market exposure.
- Every trade has the risk overlay, so if equities sell off and our bets miss, we’re already cutting.
- That cuts the left tail while other parts of the book can work.
As Druckenmiller likes to say, “if equities aren’t working, I don’t have to trade equities. I can trade bonds, currencies, commodities, etc.”
What We Learned & How We’re Improving
This is also the upside of having a strategy that doesn’t depend on equity markets going up. We don’t have to trade equities if they’re not working, especially if we can trade other markets that are working.
This study confirmed our belief that our process is unique, differentiated, and robust across markets, regimes, and asset classes.
Alex and I have no idea what the future holds for any asset class. We have no idea how stocks will do versus bonds or commodities or forex. The good news is that it doesn’t matter to our process.
By ruthlessly focusing on risk management and reducing the left tail, we’ve built a robust trading process that lets us swing big when we’re hot, dial back when we’re not, and stack layers of asymmetric return profiles that cut the left tail while letting winners run.
If you take anything from this analysis, I hope it’s this: true robustness comes from reducing the left tail, knowing thyself, and being obsessed with risk management.
This is representative of a strategy that we intend to employ in the future. If you are a qualified purchaser (as defined by SEC rules and regulations) and would like to learn more, please reach out to us directly.
NFA Disclaimer: Considerations Regarding Hypothetical Performance
HYPOTHETICAL PERFORMANCE RESULTS HAVE MANY INHERENT LIMITATIONS, SOME OF WHICH ARE DESCRIBED BELOW. NO REPRESENTATION IS BEING MADE THAT ANY ACCOUNT WILL OR IS LIKELY TO ACHIEVE PROFITS OR LOSSES SIMILAR TO THOSE SHOWN. IN FACT, THERE ARE FREQUENTLY SHARP DIFFERENCES BETWEEN HYPOTHETICAL PERFORMANCE RESULTS AND THE ACTUAL RESULTS SUBSEQUENTLY ACHIEVED BY ANY PARTICULAR TRADING PROGRAM.
ONE OF THE LIMITATIONS OF HYPOTHETICAL PERFORMANCE RESULTS IS THAT THEY ARE GENERALLY PREPARED WITH THE BENEFIT OF HINDSIGHT. IN ADDITION, HYPOTHETICAL TRADING DOES NOT INVOLVE FINANCIAL RISK, AND NO HYPOTHETICAL TRADING RECORD CAN COMPLETELY ACCOUNT FOR THE IMPACT OF FINANCIAL RISK IN ACTUAL TRADING. FOR EXAMPLE, THE ABILITY TO WITHSTAND LOSSES OR TO ADHERE TO A PARTICULAR TRADING PROGRAM IN SPITE OF TRADING LOSSES ARE MATERIAL POINTS WHICH CAN ALSO ADVERSELY AFFECT ACTUAL TRADING RESULTS. THERE ARE NUMEROUS OTHER FACTORS RELATED TO THE MARKETS IN GENERAL OR TO THE IMPLEMENTATION OF ANY SPECIFIC TRADING PROGRAM WHICH CANNOT BE FULLY ACCOUNTED FOR IN THE PREPARATION OF HYPOTHETICAL PERFORMANCE RESULTS AND ALL OF WHICH CAN ADVERSELY AFFECT ACTUAL TRADING RESULTS.
HYPOTHETICAL PERFORMANCE RESULTS SHOWN IN THIS PRESENTATION DO NOT REPRESENT THE PERFORMANCE OF ANY MANAGED ACCOUNT. THE HYPOTHETICAL PERFORMANCE DOES NOT REPRESENT THE RESULTS OF ACTUAL TRADING USING CLIENT ASSETS AND DOES NOT AND IS NOT INTENDED TO INDICATE THE PAST PERFORMANCE OR FUTURE PERFORMANCE OF ANY ACCOUNT OR INVESTMENT STRATEGY. THE PERFORMANCE OF ANY ACCOUNT OR INVESTMENT STRATEGY MANAGED BY US WILL DIFFER FROM THE HYPOTHETICAL PERFORMANCE RESULTS FOR A NUMBER OF REASONS, INCLUDING WITHOUT LIMITATION THE FOLLOWING: ALTHOUGH WE MAY CONSIDER FROM TIME-TO-TIME TO UTILIZE ONE OR MORE MODELS OR CONSIDER ONE OR MORE FACTORS IN MANAGING ANY ACCOUNT, WE MAY NOT CONSIDER ALL OR ANY OF SUCH FACTORS. WE MAY (AND WILL) FROM TIME-TO-TIME UTILIZE DIFFERENT MODELS AND CONSIDER FACTORS IN ADDITION TO THOSE REPRESENTED HEREIN IN MANAGING ANY ACCOUNT. WE MAY REBALANCE AN ACCOUNT MORE FREQUENTLY OR LESS FREQUENTLY THAN ASSUMED IN THE RESULTS AND AT TIMES OTHER THAN PRESENTED HEREIN.
THE HYPOTHETICAL PERFORMANCE RESULTS ASSUME FULL INVESTMENT, WHEREAS A MANAGED ACCOUNT MAY HAVE A POSITIVE CASH POSITION UPON REBALANCE. HAD THE HYPOTHETICAL PERFORMANCE RESULTS INCLUDED A POSITIVE CASH POSITION, THE RESULTS COULD BE MATERIALLY DIFFERENT THAN THE RESULTS SHOWN. THE HYPOTHETICAL PERFORMANCE RESULTS FOR THE STRATEGY DO NOT INCLUDE TRANSACTION COSTS OF BUYING AND SELLING SECURITIES. INVESTMENT MANAGEMENT FEES (INCLUDING WITHOUT LIMITATION MANAGEMENT FEES AND PERFORMANCE FEES), CUSTODY AND OTHER COSTS, AND TAXES – ALL OF WHICH WOULD BE INCURRED BY AN INVESTOR ARE NOT INCLUDED IN PERFORMANCE RESULTS. IF SUCH COSTS AND FEES WERE REFLECTED, THE HYPOTHETICAL PERFORMANCE RESULTS WOULD BE LOWER. THE HYPOTHETICAL PERFORMANCE DOES NOT REFLECT THE REINVESTMENT OF DIVIDENDS AND DISTRIBUTIONS THEREFROM, INTEREST, CAPITAL GAINS, AND WITHHOLDING TAXES. MANAGED ACCOUNTS ARE SUBJECT TO ADDITIONS AND REDEMPTIONS OF ASSETS UNDER MANAGEMENT, WHICH MAY POSITIVELY OR NEGATIVELY AFFECT PERFORMANCE DEPENDING GENERALLY UPON THE TIMING OF SUCH EVENTS IN RELATION TO THE MARKET’S DIRECTION. HYPOTHETICAL RETURNS MAY BE DEPENDENT ON THE MARKET AND ECONOMIC CONDITIONS THAT EXISTED DURING THE PERIOD. FUTURE MARKET OR ECONOMIC CONDITIONS CAN ADVERSELY AFFECT THE RETURNS.
THE PERFORMANCE INFORMATION PRESENTED IS HYPOTHETICAL AND DOES NOT REPRESENT ACTUAL TRADING IN ANY CLIENT ACCOUNT. HYPOTHETICAL PERFORMANCE HAS INHERENT LIMITATIONS BECAUSE IT IS BASED ON ASSUMPTIONS THAT MAY NOT OCCUR. ACTUAL INVESTMENT RESULTS WILL DIFFER, POTENTIALLY MATERIALLY. NO REPRESENTATION IS MADE THAT ANY INVESTOR WILL ACHIEVE RESULTS SIMILAR TO THOSE SHOWN. MARKET CONDITIONS, TRANSACTION COSTS, TAXES, FEES, LIQUIDITY CONSTRAINTS, TIMING DIFFERENCES, AND OTHER FACTORS MAY SIGNIFICANTLY AFFECT ACTUAL PERFORMANCE. HYPOTHETICAL PERFORMANCE SHOULD NOT BE RELIED UPON AS A PREDICTION OF FUTURE RESULTS.