Key points:
- The S&P 500’s seasonal trend recently reached its typical bottom
- Four months later, tech and industrials rank as the two best-performing sectors
- The setup in 2026 bears little resemblance to prior seasonal bottoms
Seasonality for stocks turns bullish, but with a caveat
Seasonality is another tool in the toolbox—not something to be used in isolation, but rather as one piece of a broader weight-of-the-evidence approach. Few analysts incorporate meaningful context around the studies, but long-term readers of my research know I prioritize this, even when it reduces the sample size. The goal is a more accurate and relevant assessment.
So what do seasonality and the current environment tell us about the stock outlook?
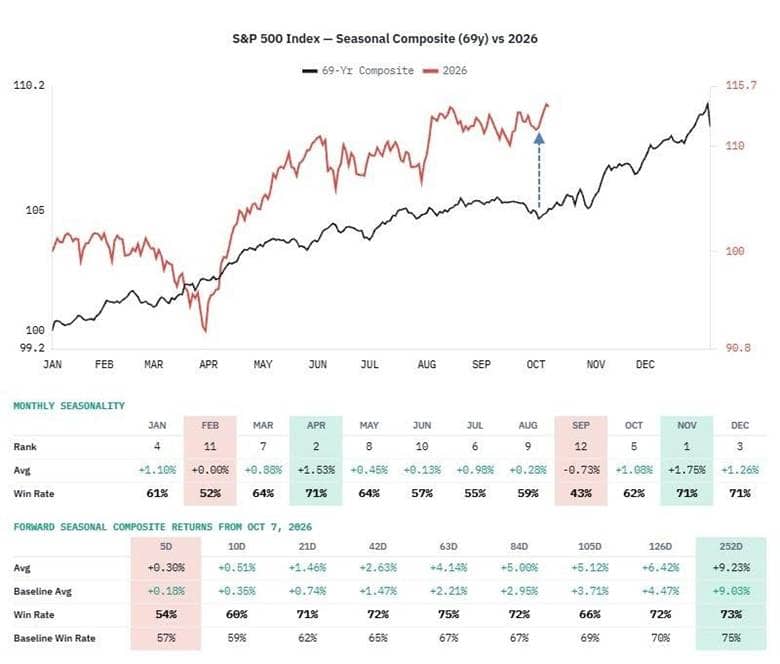
Since 1957, the S&P 500’s seasonal bottom has typically occurred around the 187th trading day of the year, which falls in the first half of October. That seasonal window has now arrived. Historically, this marks the start of a strong period for the world’s most-watched index, with November ranking as the best month of the year.
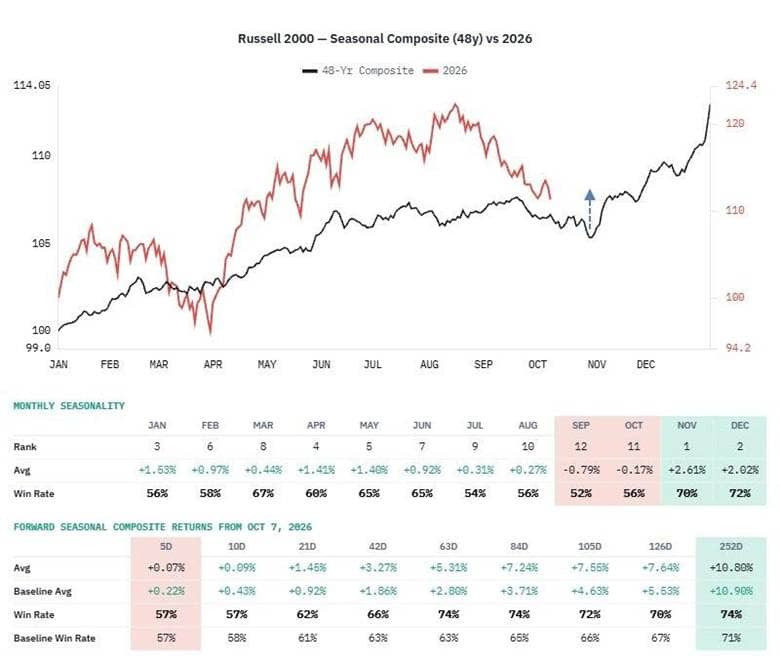
Small caps typically bottom later, with the seasonal low occurring around Day 206, or late October—just before the Russell 2000 enters its two strongest months of the year. More importantly, the 84-day return from the October 7, 2026 close is nearly double the baseline average for that timeframe. If Treasury yields ease as seasonality turns bullish, small caps could be positioned for a meaningful catch-up rally.
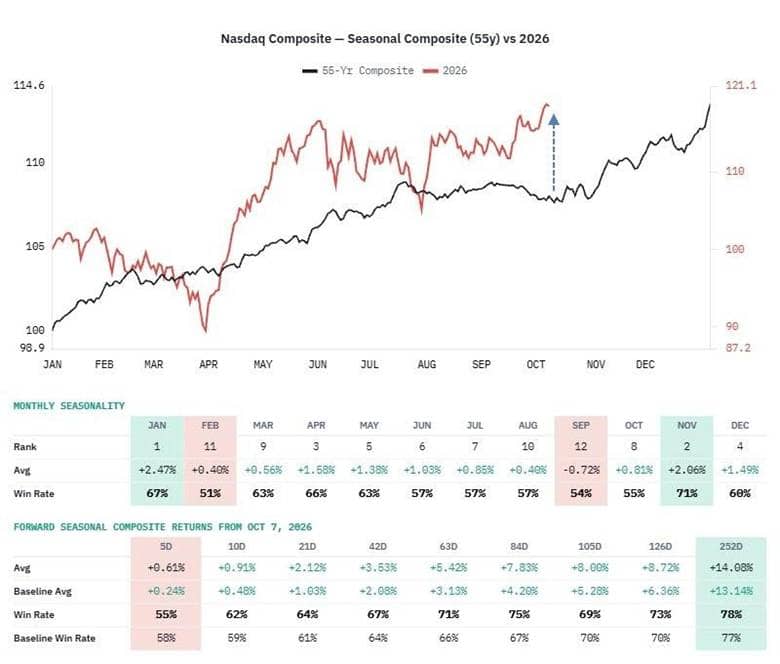
The Nasdaq Composite’s seasonal pattern bottoms right about now. But given its divergence from September’s weak seasonal trend, we can’t rule out a pullback toward the historical average. Today’s price action in technology stocks suggests that risk is worth watching.
With technology, health care, and energy as the only sectors with bullish long-term Dual Trend signals, let’s take a closer look at their seasonal patterns.
Current leadership
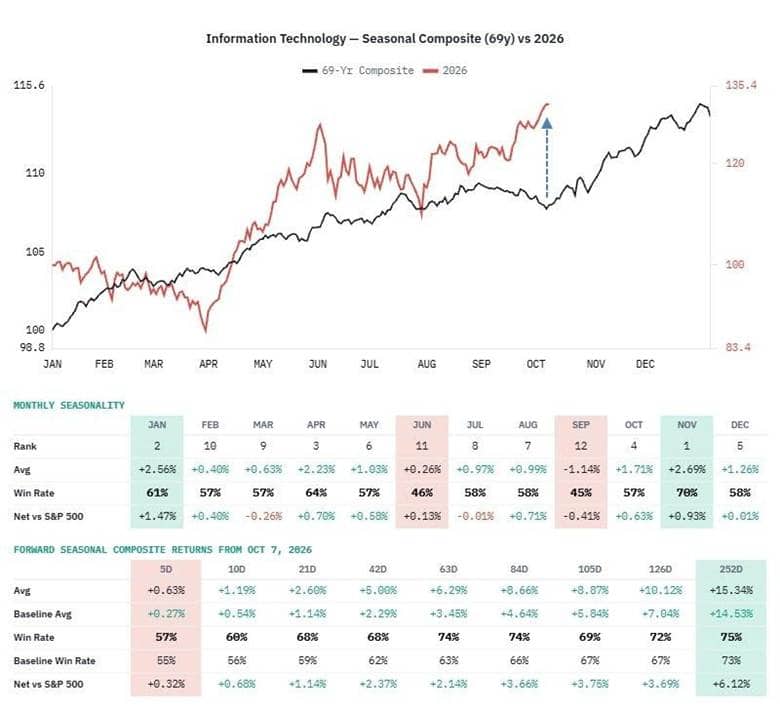
Like most indexes and sectors, November ranks as technology’s best month of the year.
Interestingly, December ranks fifth, despite the strong seasonal performance around it. Similar to the Nasdaq Composite in 2026, each meaningful divergence from technology’s historical trend has been followed by mean reversion.
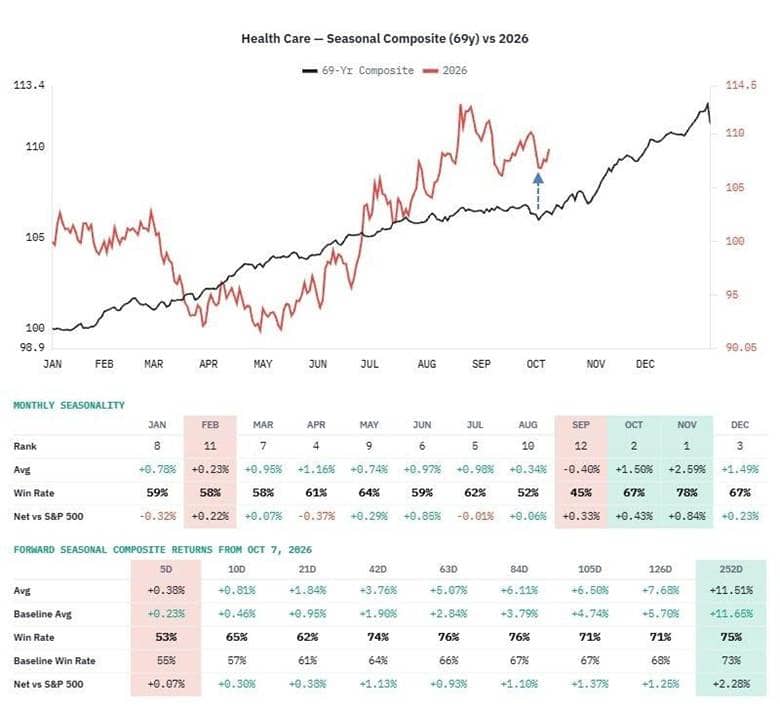
October is historically health care’s best month, likely reflecting the sector’s defensive characteristics during a challenging first half. From yesterday’s close, forward returns show robust win rates, though net returns are more modest than technology’s.
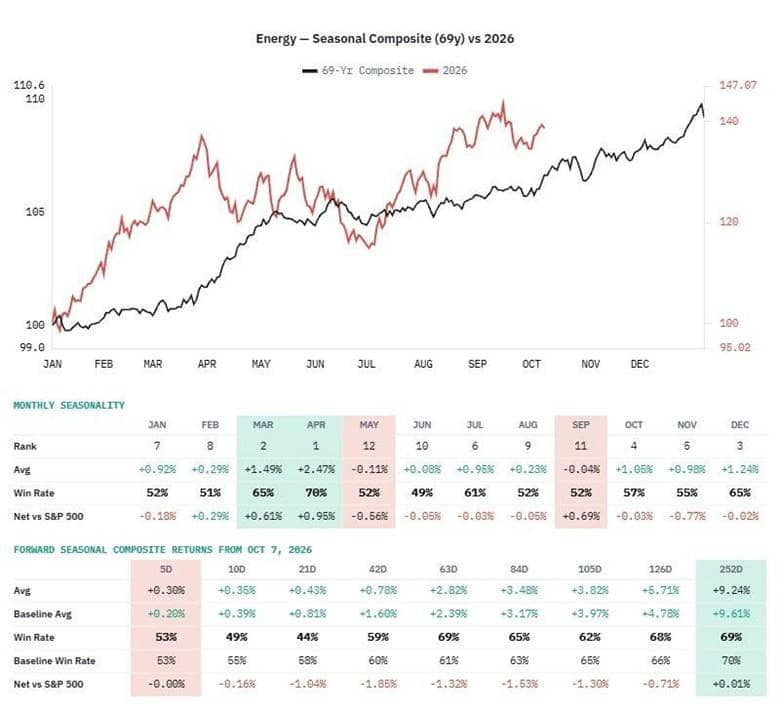
Energy lacks a particularly strong seasonal tailwind, with its best seasonal performance generally occurring in the spring.
What happens next
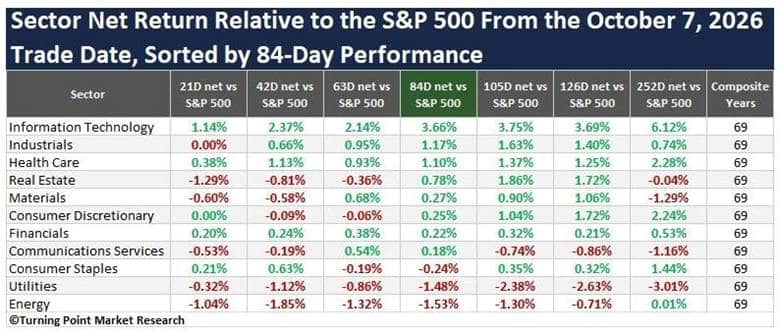
My seasonality tool calculates forward returns from the most recent trading date—in this case, October 7, 2026—based on the historical average of the composite. Over the next 84 sessions, capturing the historically bullish period from October through February, technology has been the strongest relative performer, followed by industrials. Health care ranks third, while energy has historically been the weakest.
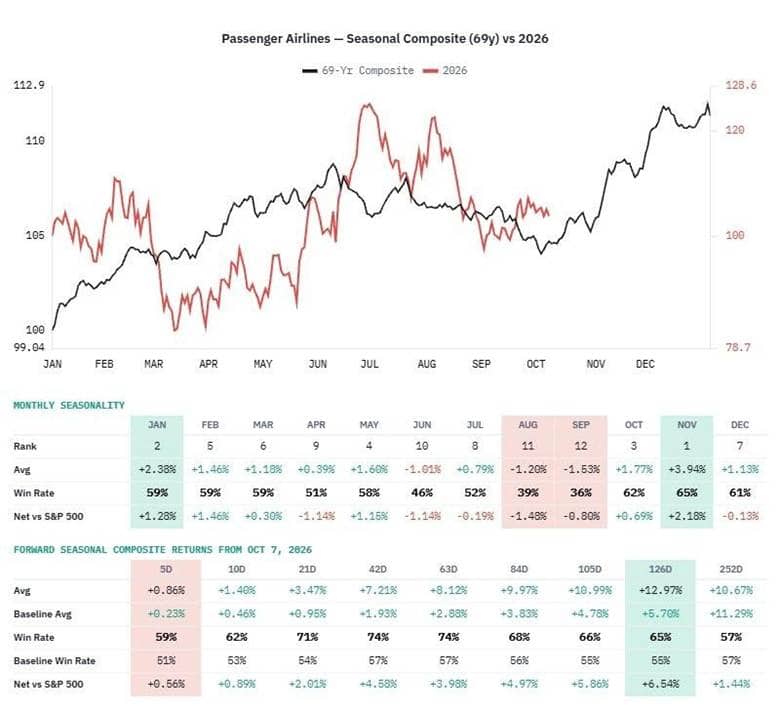
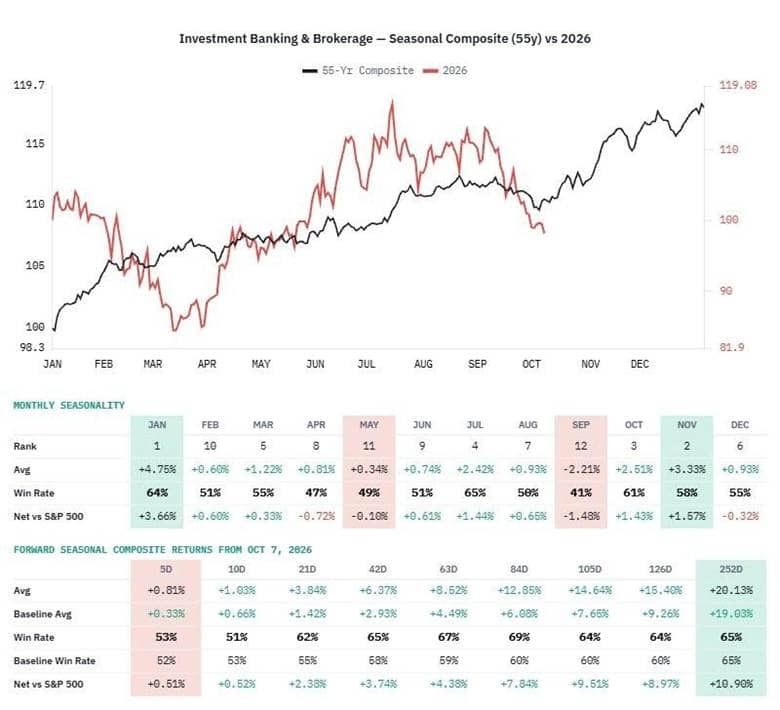
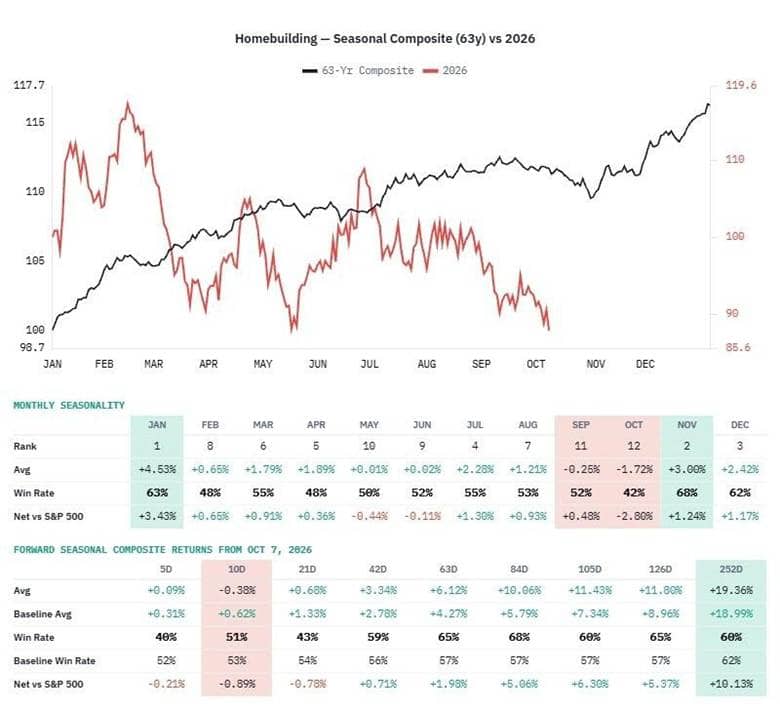
Technology sub-industries dominate the 84-day rankings, accounting for five of the top 10 groups from the October 7 starting point. Yet a sustained decline in Treasury yields could kickstart a tactical mean reversion bounce for some of the other groups on this list. Those include the beaten-down, yield-sensitive industries such as airlines, investment banking and brokerage, and homebuilding.

The contrarian mean-reversion groups
Given that the S&P 500’s seasonal bottom since 1957 occurs on day 187, I thought it would be interesting to compare 2026 with other years across several indicators, including price momentum, interest rates and Fed policy, market breadth, sentiment, inflation, and economic surveys. Because the 2026 seasonal bottom occurred with the S&P 500 just 1.9% below its record high, I isolated all years in which the index was less than 3% below its all-time high. That produced 26 comparable instances, while the remaining years accounted for 43, bringing the total sample to 69 cases.
Context is everything
The S&P 500’s 3-year rate of change of 76% is significantly above the average for all three buckets, including the record-high instances. Commodities are also running above average. The 10-year Treasury range rank of 100% is roughly double the other buckets’ average, while the Fed has already delivered one hike—another key difference from historical cases. Breadth, which I have noted has been extremely weak, is significantly worse than average, particularly relative to the near-record-high bucket. Sentiment is also elevated, with the Investors Intelligence survey at 57%. Inflation is above average across all three buckets, while ISM New Orders is below average.
Taken together, the backdrop looks nothing like the typical setup at the start of the seasonal bullish period for stocks.
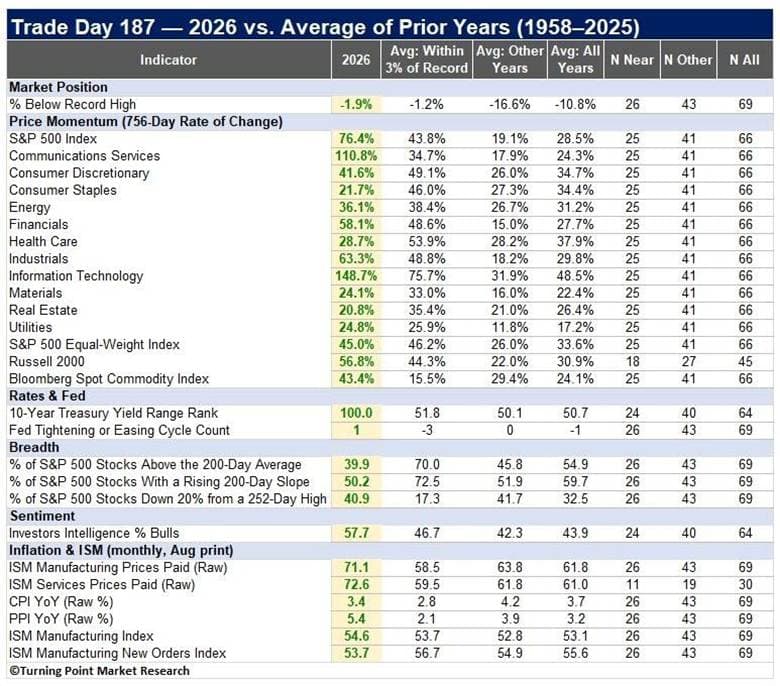
The four closest historical matches to 2026 are 2007, 2018, 2025, and 1967—negative forward returns at the six-month mark followed all four.

What the research tells us…
Seasonality for the S&P 500 and other major indexes is turning bullish and remains favorable through February. The problem is that 2026 looks very different from the typical seasonal setup. A broad comparison of price momentum, rates, breadth, sentiment, and other factors finds only a handful of historical years that resemble the current environment—and negative six-month returns followed those periods. As a result, expectations for the seasonal tailwind should remain tempered. A meaningful drop in the 10-year Treasury yield could change that view, particularly if it triggers a catch-up rally in beaten-down groups.