We’re launching a new report called Field Notes. This series will supplement my Long Pull Reports and act as a weekly “eyes and ears” for everything my network is doing: buying/selling, investigating new positions, finding new thematics, talking to management teams, etc.
Each week, I spend most of my time talking to people in my network. This could be hedge fund managers, individual investors on X, management teams, or business owners in an interesting industry/thematic we’re covering.
The problem (and the reason we created this piece) is that those bits of information get easily lost throughout the week if I don’t have a routine of writing everything down.
Field Notes is where I digest everything I’ve read and everyone I’ve talked to during the week, plus anything I’ve built, and distill those thoughts into an easy-to-read weekly report.
We’re still writing Long Pull Reports, but will save those issues for more longer-form deep-dive analysis on companies and industries. Think of Long Pulls as building the deep industry/company mosaics over time, and Field Notes as weekly craft-sharpening work.
I’m excited about this report, and I hope you are too. Let’s get after it.
New Tools: Sub-Industry Breadth/Valuation Analysis
I’ve wanted my own simple sub-industry dashboard for a while. I wanted two things:
- Breadth data across all sub-industries
- Valuation data across all sub-industries
It sounds simple, and for the most part it is … something I could quickly scan every week to tell me:
- What’s the most oversold/washed out corner of the market (relative to its history)
- What’s the cheapest corner of the market (relative to its history)
And thanks to a confluence of Collective member encouragement (Chris M and ErikPSC), I created those two dashboards earlier this week. Check them out below.
Here’s the Breadth Dashboard.

We can then go into the sub-industry-level analysis. Check out Aerospace & Defense as an example (see below).
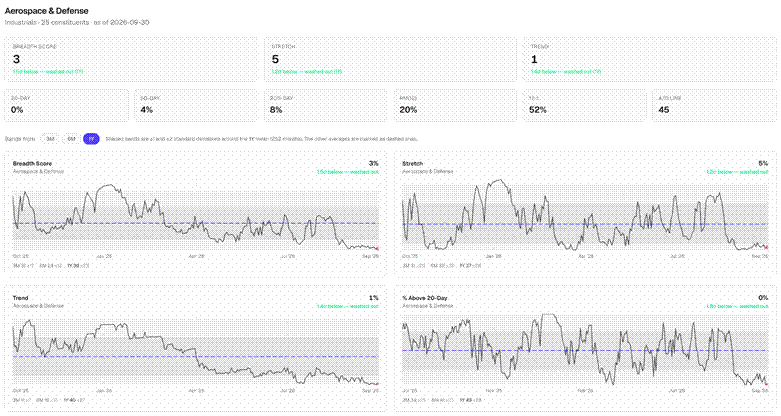

Along with the standard breadth data you’d see (Advance/Decline, % from 20D, 50D, 200D, etc.), the dashboard tracks three other metrics:
- Stretch: Shorter-term trends in stocks above 20/50D, and A/D momentum.
- RM12: % of constituents beating an equally-weighted basket over a 12M period.
- Trend: Longer-term trends in RM12 and stocks above 200D MA.
I then use a Composite Score that ranks each breadth metric against that sub-industry’s prior twelve-month data.
This is why I’m excited to have Dean on the team. He can focus on the momentum leaders (i.e., strongest breadth), which frees me up to focus on the opposite end of the barbell … the most bombed-out sub-industries.
Now here’s the valuation dashboard.
Valuation Dashboard
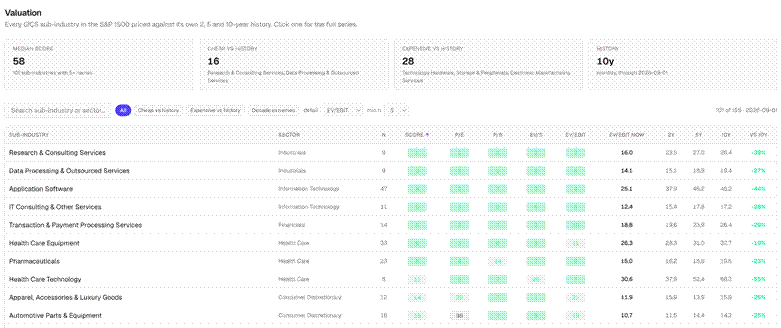
There’s nothing fancy about this, and that’s the point. This quickly shows me which sub-industries are expensive or cheap relative to their 2YR, 5YR, and 10YR histories.
Check out Technology Hardware, which ranks as the most expensive sub-industry relative to its history (see below).
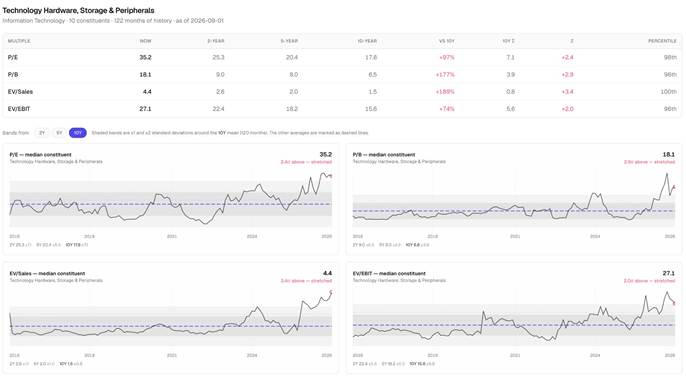
Simple, clean, and tells me everything I need to know about a sub-industry’s relative valuation to its history.
Now you’re probably wondering, “that’s great, Brandon and congrats on the simple tools. But how does that relate to this new Field Notes report and all the people you talk to during the week?”
Great question.
This week I chatted with two fund managers. Both of them are buying/have bought stocks in two of the most washed-out corners of the market:
- Utilities
- Apparel/Retail
I want to focus on Utilities as it fits squarely into our Power/Energy and AI thematics.
Utilities: Historically Bad Breadth
Electric Utilities posted the second-lowest breadth score this week (Aerospace & Defense was the worst) at 5. You can see the category breakdowns below.
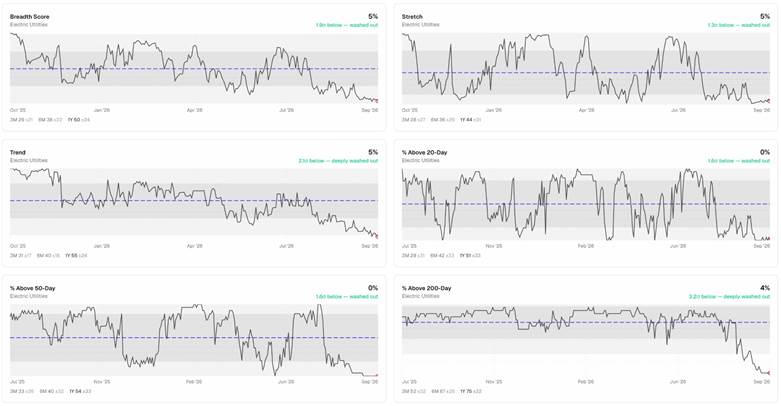
Here’s the craziest stat from the breadth data: Utilities are 3.2 std below average for % of stocks above the 200D MA.
In short, nothing is working in utilities right now. I think there are a few reasons for this:
- Capital rotation out of AI-adjacent trades into more AI-focused trades (i.e., why play derivatives of the AI trade when you can just own semiconductors?).
- Uncertainty around midterms and what government officials will do to power prices.
- Not super compelling valuations.
1 and 3 go together. Everyone bid the utility companies up on the AI trade, and at some point you begin to wonder if it’s fiduciarily responsible to hold an electric utility company trading at 30-40x earnings.
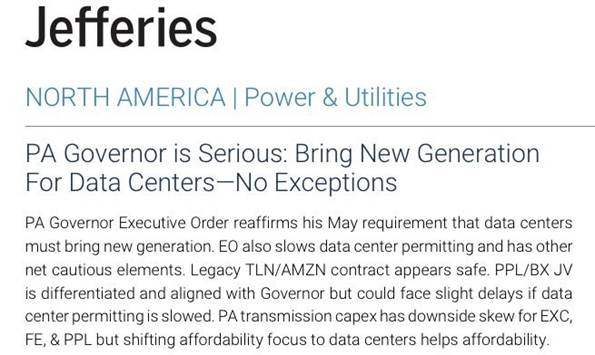
2 is more nuanced because data centers and electricity bills are hot-button issues heading into midterms. I’m not going to pretend to have an edge on how those issues will play out after the midterms. All I know is that the US desperately needs more power. And you also have things like this.
The High-Level Utility Bull Thesis
The general bull thesis on electric utility IPPs (independent power providers) is that new supply cannot come online fast enough to meet growing demand from AI/data centers.
That supply/demand imbalance pushes electricity prices higher and increases the “spark spread” IPPs earn. The spark spread is the price IPPs can charge for electricity ($/MWh) minus the natural gas price to generate the electricity, multiplied by a heat rate.
So the greater the supply/demand imbalance, the higher the spark margins, and the higher the free cash flow.
According to Morgan Stanley, the US will be short 33 GW of power by 2028 (a 34% shortfall).
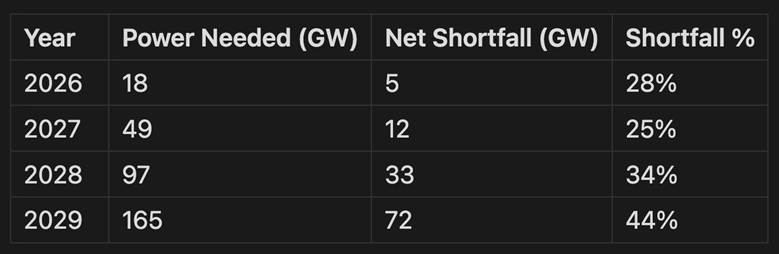
This should keep electricity prices higher through 2029-2030 or until we get more power supply or regulators step in and take all the IPP profits.
The Bear Thesis: Government Doing Something
The most significant bear thesis I can find (so far) is that regulators will eventually do their jobs and fight IPPs to lower electricity prices. One way regulators fight pricing is through price caps, which they’re doing. The current price cap for PJM (Pennsylvania, New Jersey, Maryland) pricing is $325/MW-day.
DistroForge does a good job covering the PJM auctions and supply/demand dynamics. Here’s their commentary on the latest auction (emphasis mine):
“The auction procured 138,318 MW of unforced capacity and still came in 6,831 MW short of the 20 percent reserve margin PJM targets for a one-in-ten reliability standard. That shortfall is wider than the roughly 6.5 GW gap in the prior auction. So the third straight cap-clear did not close the reserve hole. It widened it.
The cap is also the only thing holding the price down. PJM’s filing put the uncapped clearing price at $555/MW-day across the footprint and $777/MW-day in the ComEd zone, per Utility Dive. The $325 you see is a policy ceiling, not a market signal that pressure eased. Cleared value came in at $16.4 billion against an uncapped figure near $29.7 billion. The capacity market wanted to charge far more, and the collar is what stands between buyers and that larger number.
Nearly all the demand growth is one customer class. Demand rose about 2 GW, largely data-center driven, which means the capacity market in the biggest load region is now priced by hyperscale load. The winners are the incumbent merchant fleets that already own steel: Constellation Energy cleared 18,875 MW, Vistra 10,924 MW, and Talen Energy 10,180 MW. New entrants are not who cleared. Owners of existing plants are.”
So you have a market telling you, through tangible auction pricing, that demand far exceeds supply and that the imbalance will last well into 2030. Why can’t new supply come online? Because it costs too much (more on that later).
The Idea: Talen Energy (TLN)
TLN owns and operates the Susquehanna nuclear plant in PA and a fleet of 11+ gas and coal plants, primarily in the mid-Atlantic region. There are five ways to win with TLN:
- They sign new deals with hyperscalers to supply nuclear power.
- They sign new deals with hyperscalers to supply gas power.
- PJM pricing improves as the supply/demand balance increases over the next 18-24 months.
- They grow inorganically with accretive tuck-ins.
- They buy back a ton of stock.
The bull case is that TLN has a bunch of scarce, uncontracted power (nuclear, coal, and gas) from irreplacable/NIMBY assets and can generate above-average margins for the next 4-5 years.
Management expects the company to earn $50/share in FCF by 2028. At today’s stock price of $310/share, you’re paying ~6x 2028E FCF (or a 16% FCF yield). The company has raised guidance twice in the past two earnings calls, Q2 2026 EBITDA is 4x the prior year, and power capacity is locked (i.e., contracted) through 2029.
TLN has ~3.5x leverage, which management says it will stay within that range while returning 70% of free cash flow to shareholders. Also, the debt isn’t due until 2031 and carries ~6.20% interest.
Let’s talk about replacement cost.
Replacement Cost: $30-40B
We can derive total replacement cost from its three main assets (assisted by Gemini):
- Susquehanna Nuclear: Based on recent projects (like Georgia’s Vogtle Plant), the capital cost is at least $8,000 to $10,000+ per kilowatt (kW) = $20-24B
- Natural Gas Fleet: Modern, high-efficiency gas plants cost roughly $1,000 to $1,300 per kW to construct from scratch = $9-11B
- Legacy coal and oil: Replacing this dispatchable capacity with modern equivalents represents at least $3 Billion to $4 Billion in value.
That gives us a total replacement cost of ~$35B versus the current enterprise value of ~$25B. In other words, TLN trades at a 30% discount to replacement cost.
So you’re paying $25B for assets worth ~$30-40B to replace, and they also generate insane profits because of a supply/demand imbalance for the next 3-5 years. What is management doing with all that cash? They’re buying back stock.
TLN’s $3B Buyback Program
Yesterday, TLN announced a $3B buyback program. It comes in two phases: a $1.5B accelerated share repurchase program and a standing $1.5B buyback authorization. $3B is 20% of the company’s market cap. This is the kind of thing you read about in The Outsiders on buying back stock. It also provides downside protection because management probably buys every dip at these prices (if they believe in the 16% FCF yield on 2028E cash flow).
Key Factors: Exit Multiple, PJM Pricing, and New Contracts
I see three key factors for TLN’s bull case:
- The exit multiple investors are willing to pay for TLN’s 2028 cash flows.
- PJM pricing durability.
- New deals signed with other hyperscalers (like AMZN).
There are a lot of moving parts, but generally, I think these three things matter most.
PJM pricing determines margins and profits, and it also tips what regulators and governments will do with pricing going forward (will they be even more restrictive and enforce lower caps?). The 2028/2029 auction cleared at a $325/MW-day cap for the third consecutive auction. There’s demand through $555/MW-day into $700/MW-day.
The company has a 1,920 MW PPA contract with Amazon through 2042. Like the HUT thesis, the value grows with each new contract signed. If TLN can sign another hyperscaler or a government contract, it should command more of a CEG multiple (6-7% FCF yield).
All of this flows into the FCF multiple (or inverted, the cap rate) investors are willing to pay for TLN’s cash flows. CEG historically trades between 13-15x EBITDA (or a 7% yield). With another long-term contract and continued PJM pricing strength, I can see investors paying 10-12x FCF for TLN.
That’s a $500/share (60%+ upside) assuming they reach $50/share in FCF, which they would on positive pricing alone (plus buybacks). Additional contrast is gravy.
Downside seems protected here given replacement cost, power supply/demand dynamics, and the fact that TLN owns irreplaceable assets that are difficult to bring online in a world starving for power generation.