Every backtest looks amazing.
Smooth equity curves. Cherry-picked time periods. Numbers that seem too good to be true.
So when I tell you TrendLock has returned 21% annually since 2007, your BS detector should be going off.
Mine would too.
That’s why I ran this system through every major market crisis of the past 18 years. Not hypothetical scenarios, actual historical crashes with real prices and real execution.
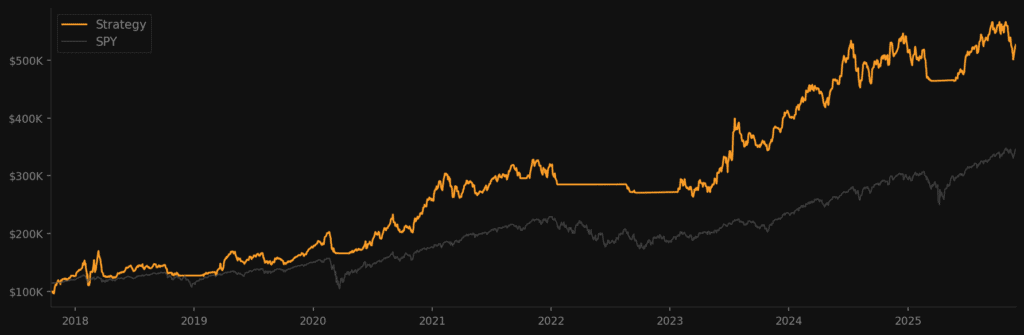
Ok here’s the pretty equity curve to start 🙂
Here’s what I found.
The Real Crisis Performance
Let’s start with the number that matters most: what happens when the market falls apart?
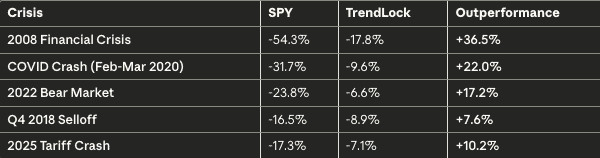
Read that 2008 line again.
While buy-and-hold investors watched their portfolios get cut in half, TrendLock limited losses to -17.8%. The system rotated to T-Bills on December 31, 2007, before the worst of it, and stayed defensive through nearly all of 2008.
That’s what a regime filter is supposed to do: get out of the way.
Full Year 2020: The COVID Story
The COVID crash numbers above only show Feb-Mar 2020. But here’s what happened for the full year:
- SPY: +17.7%
- TrendLock: +88.4%
Not a typo. TrendLock was up 88% in 2020.
How? The system:
- Rotated to defense on Feb 26, 2020, before the worst of the crash
- Stayed in T-Bills through March and April
- Re-entered on June 1 when momentum turned positive
- Rode the recovery hard with 2x leveraged exposure
The system didn’t predict COVID. Nobody did. But it followed the signals, and the signals worked.
The Honest Numbers
Here are the complete statistics from 2007-2025:
Performance:
- CAGR: 21%
- Sharpe Ratio: 0.85
- Win Rate: 54%
- Max Drawdown -29%
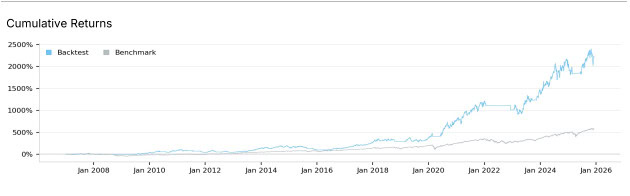
Growth of $100,000:
- TrendLock: $2,334,184
- SPY Buy & Hold: $685,690
Risk:
- Max Drawdown: -29.0% (TrendLock) vs -55.2% (SPY)
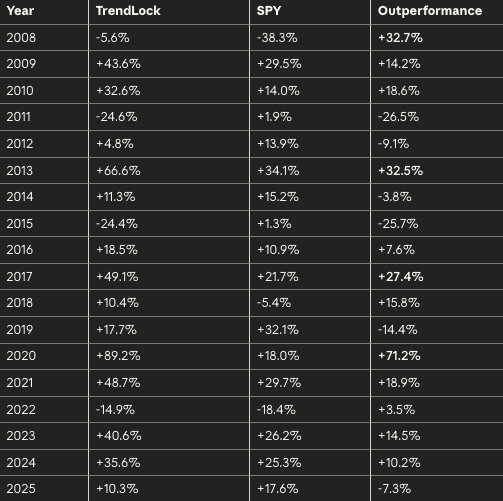
- Positive Years: 14 out of 18 (78%)
- Beat SPY: 12 out of 18 years (67%)
The Bad Years
I’m not going to pretend every year is a winner. Here are TrendLock’s worst:
- 2011: -24.6% (choppy, trendless market)
- 2015: -24.4% (same story, whipsaw city)
- 2022: -14.9% (bear market, but still beat SPY by 3.5%)
Notice something? The worst years came from choppy sideways markets, not crashes. When the market trends, up OR down, the system performs. When it chops around with no clear direction, you get whipsawed.
That’s the tradeoff. The system protects you in crashes but can struggle in trendless chop.
Year-by-Year Breakdown
Rolling 5-Year Returns
Want to know the probability of making money if you stick with the system?
Over every rolling 5-year period since 2007:
- 100% were profitable (no 5-year period lost money)
- Median 5-year return: +69%
- Worst 5-year return: +10%
- Best 5-year return: +222%
The edge compounds. But only if you follow the signals consistently.
After running every stress test I could think of:
TrendLock is not a get-rich-quick scheme.
It’s a systematic approach that:
- Protects capital during crashes (beat SPY by 36% in 2008, 22% in COVID)
- Captures momentum during trends (2x leverage when conditions are right)
- Has losing years (2011, 2015, 2022)
- Requires patience through choppy periods
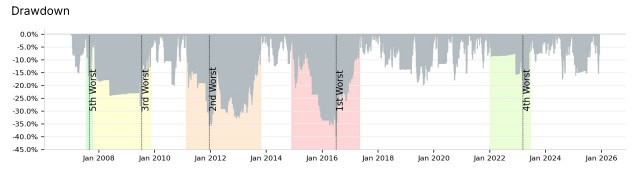
It will test you. There will be months where you question everything. The 2015-2016 period had a -29% drawdown that took nearly a year to recover.
But if you can follow the signals consistently, the math has been heavily in your favor.
What You Get
When you subscribe to TrendLock:
- Weekly signals – Every Sunday at 6PM ET
- Real-time stop alerts – Immediate notification if stops trigger
- Full dashboard access – Track positions, history, and performance
- Complete strategy documentation – Understand exactly how it works
- Clear signals you can actually follow.
And on top of that, you get the Monthly Flip. This is a seprate system meant to be used ON TOP OFF Trendlock. It Exploits the well-documented “Turn of Month” effect, a calendar anomaly that institutions have quietly profited from for decades. You can use options or stock for this one and it adds a whole new element to our system.
I’ll dig deeper into the Monthly Flip system later this week…you can read more about it here.
I’ve shown you the backtests. The crisis performance. The worst years.
The system is live. The signals are running. The only question is whether you’re following along.
If you have questions about the system, the stress tests, or anything else, just reply to this email.
Talk soon, Chris
P.S. – The next TrendLock signal goes out Sunday at 6PM ET. If you want to start following along, now’s the time.