I guess that sometimes the reason for a bull market is psychological rather than fundamental, and participating in the euphoria of a psychological move is itself the rationale for the trade. ~Colm O’Shea via “Hedge Fund Market Wizards”
Summary: Reflation, not recession, is coming, and despite persistent inflows into risk assets over the past two months, investors remain largely underinvested relative to the macro backdrop and price action. While in the short term, we may see some seasonal vol and chop. The primary trend remains firmly up, and dips should be viewed as buying opportunities. In fact, there’s an increasing likelihood we enter a 21’ redux environment where speculative assets go vertical. We share some details on how we’re trading this, plus more…
***The MO port is up +41% ytd, and we’re not seeing a shortage of great opportunities in this market. If you’d like to join me, the MO team, and our Collective of sharp, supportive investors and traders as we navigate these markets, then click the link below. I look forward to seeing you in the group.***
Join The Collective
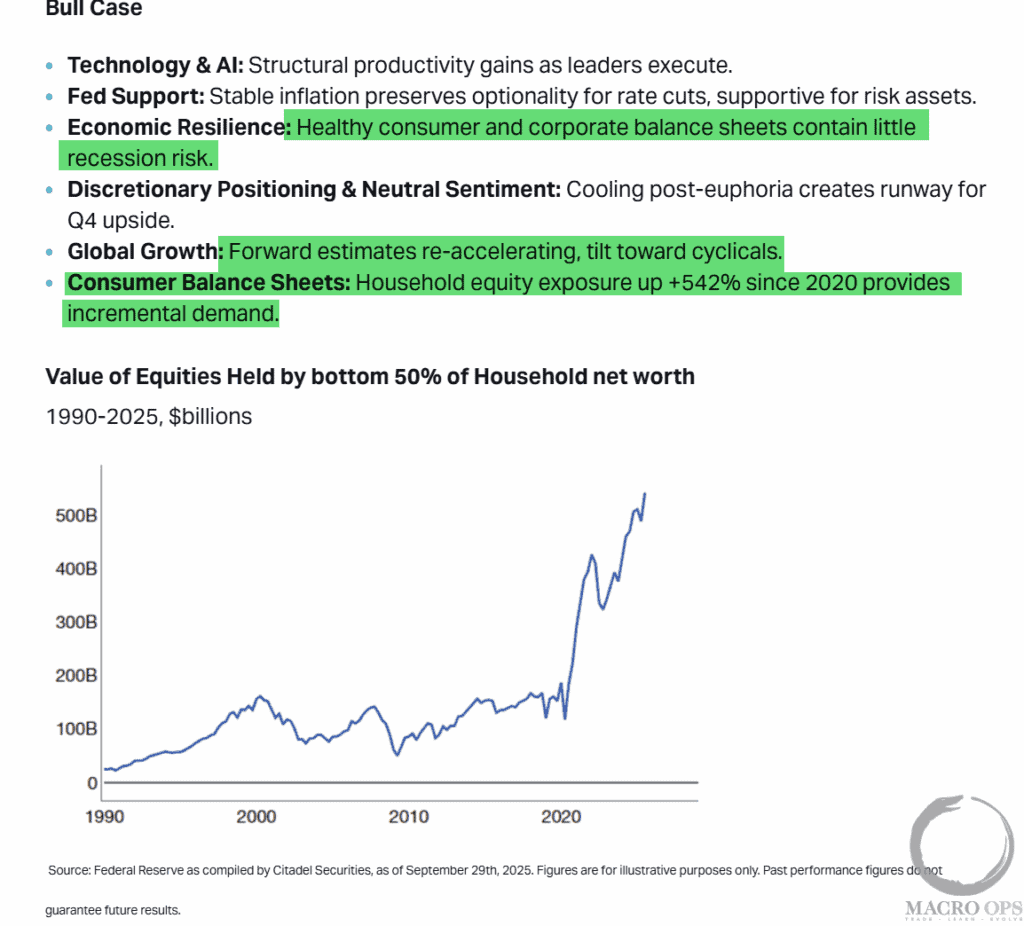
1. Citadel published a research piece last week that contains some noteworthy data (link here). Below is their bull case, which we at MO agree with. Pro-tip: it’s tough to have a recession when the fiscal deficit is large and growing (which it is) and household/private sector balance sheets are in good shape (which they are).
The “weak” labor market data is lagging and being distorted by immigration, data quirks, and trade war uncertainty. We’re in a reflation regime, not a recessionary one.
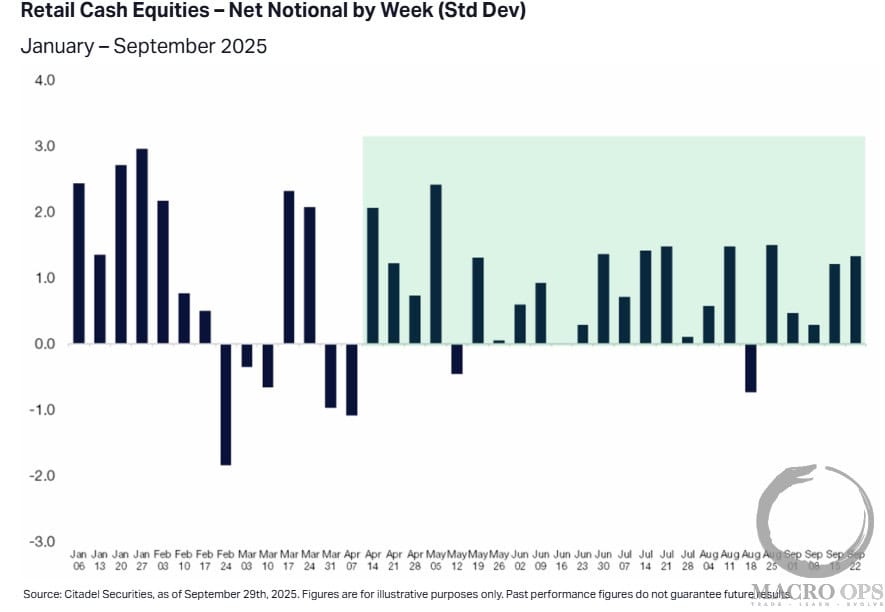
2. The short-to-intermediate bull call is tougher now than it has been over the past five months, with positioning and sentiment slowly starting to catch up to price action. Citadel points out that their retail clients have been “Net buyers in 21 of the last 24 weeks, rebounding after April weakness.”
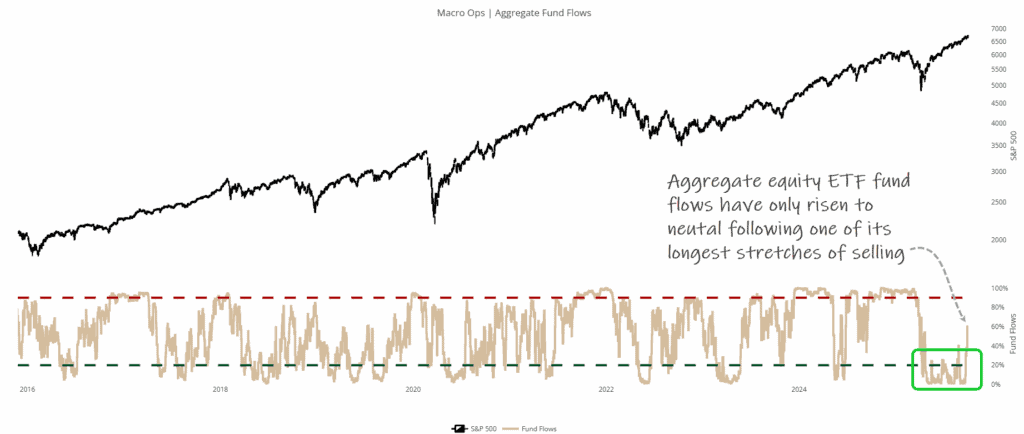
3. But… this is coming off a very low base. Below is our aggregate equity ETF fund flows oscillator. It’s only now that it has just climbed to neutral. This follows one of the most persistently bearish periods in our data, characterized by significant outflows.
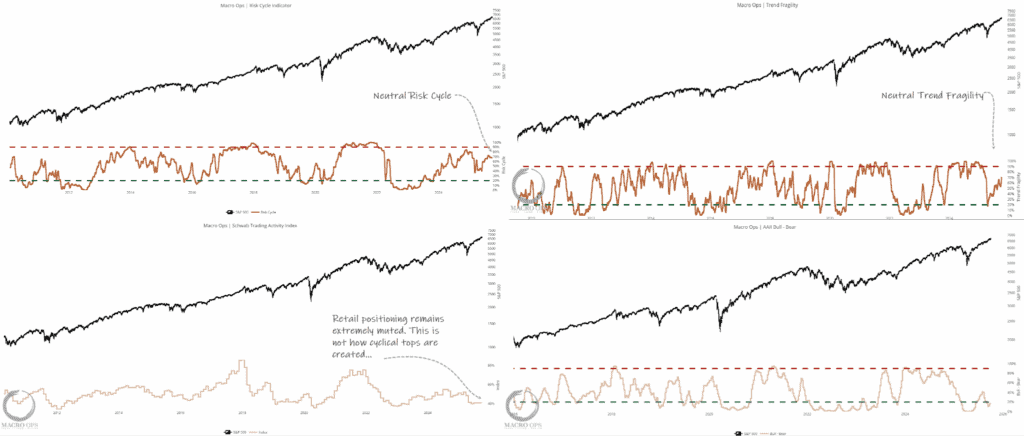
4. Additionally, our Risk Cycle indicator (a long-term composite of positioning/sentiment), Trend Fragility (short-term positioning composite), Scwhabb’s STAXX (the best indicator of actual retail positioning), and AAII Bull-Bears oscillator are all at either neutral or depressed levels. This is not what tops are made of.
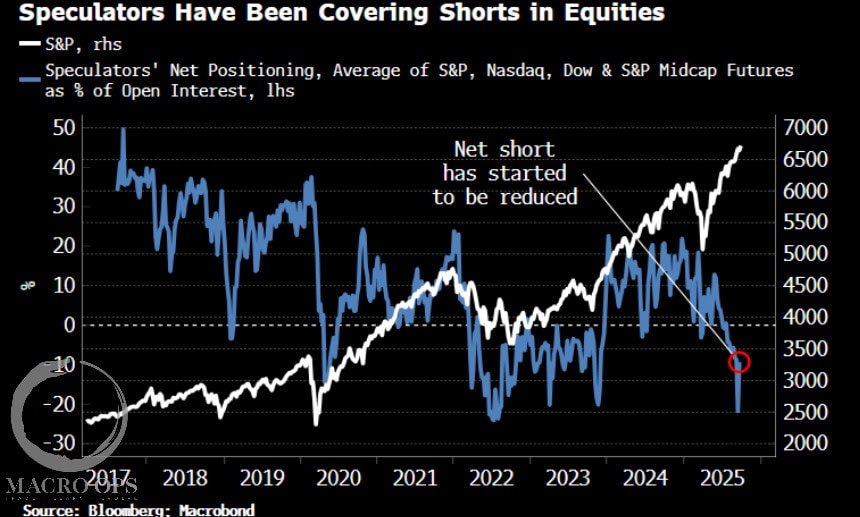
5. To further drive the point home, here’s this from BBG’s Simon White: “Then there’s fund managers, who look underinvested. Bank of America’s Global Fund Manager Survey has a net 28% who say they are overweight global stocks, lower than previous times when the market has been at all-time highs. Speculators, too, had been getting shorter stocks as the market has rallied. Their average net long as a percentage of open interest dipped to near a low last reached at the market bottom in 2022. As the chart below shows, their net short has started to be covered.”
So, yeah, only a bit of a tougher call to be long here, though not that tough…
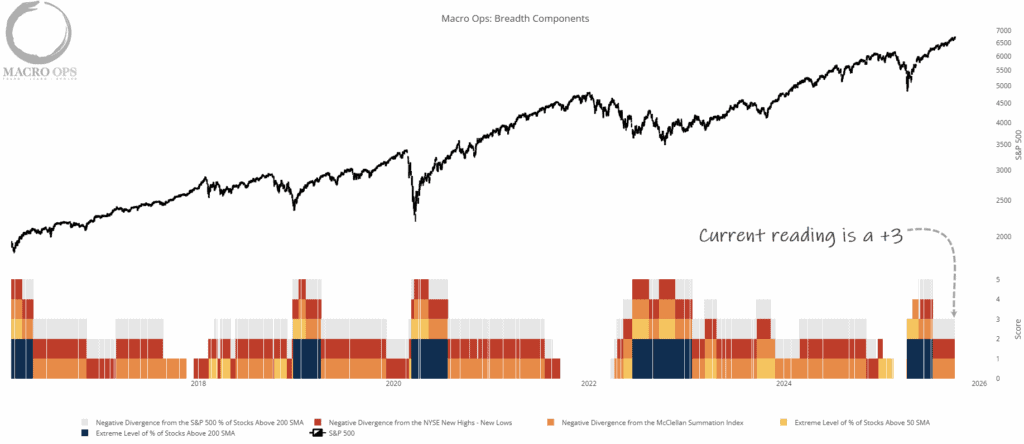
6. Our Breadth Aggregator is still solid at a +3. Significant corrections only occur when this falls to 1 or below. So this supports the primary trend. In the short term, we have the McClellan Summation index, which is positive but trending lower. This suggests we could see chop and vol over the coming weeks, which fits with October seasonals. But any dips should be viewed as buying opps.
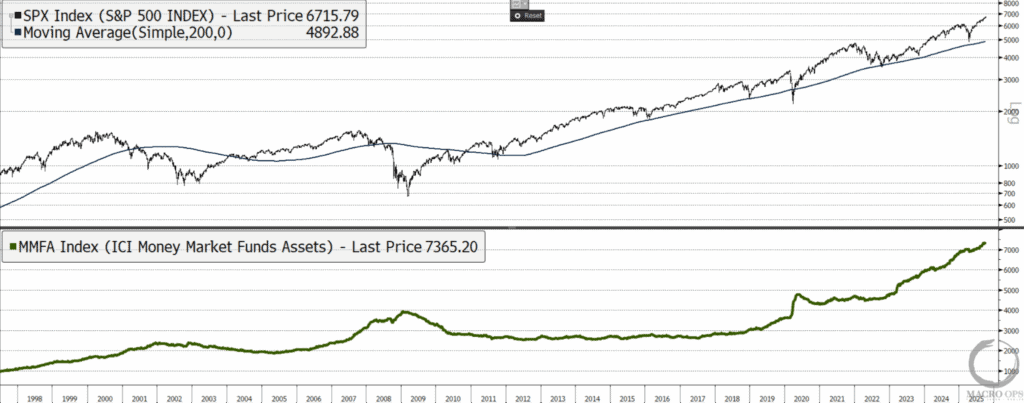
7. We at MO are increasingly of the belief that the market is entering a 21’ redux. I’ll be expanding on this idea in a later note, but we currently have roughly $ 7.5 trillion sitting in money market funds.
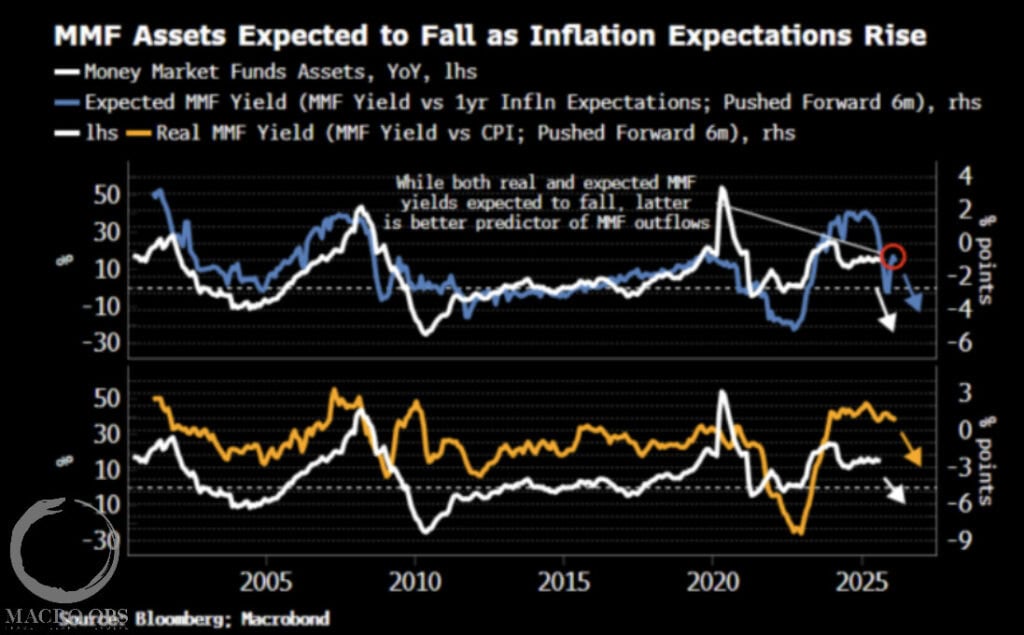
8. BBG’s Simon White shows that the real MMF yield (MMF yield vs 1yr inflation expectations, adv 6m) is a good lead on the trend in MMF assets. With the Fed cutting rates and inflation expected to tick up in the quarters ahead, we will likely start to see some of this substantial wave of cash begin to flow into risk assets.
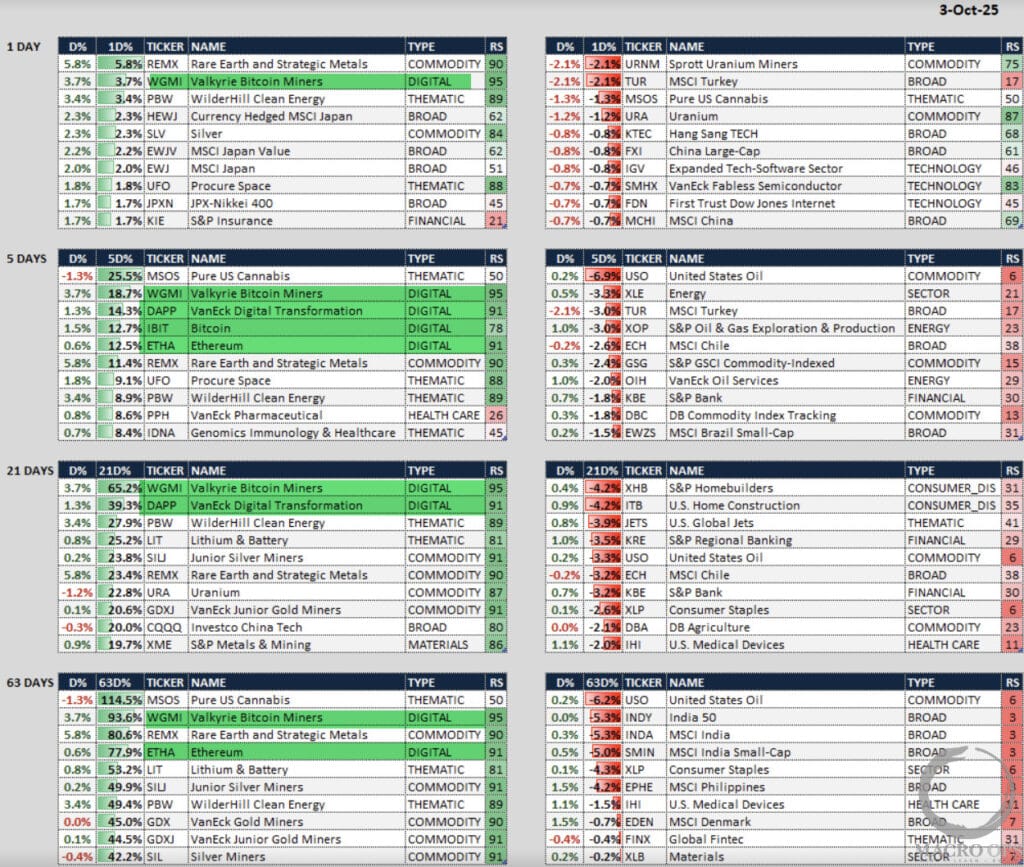
9. We track composite momentum measures across timeframes for various assets. Here’s the latest table compiled by fellow Collective member ChrisM. We’ve been long the crypto majors for months, and there’s growing evidence that we’re about to see a new bull leg. One of these is the rise of crypto miners to the top of our Momo screen. Miner participation is a necessary requisite for a proper crypto bull.
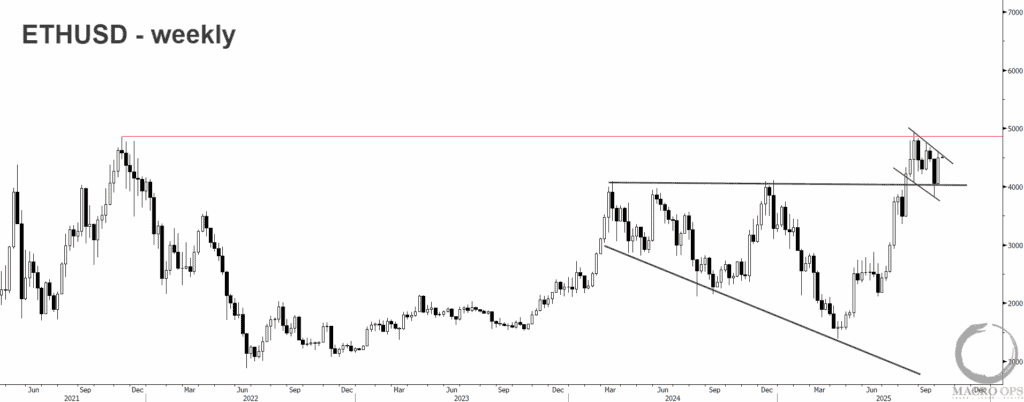
10. Here’s a weekly of ETHUSD. The price has retested its breakout and put in a strong reversal bar last week. If we see a move above last week’s high, then I think ETH will be off to the races and quickly take out its 21’ ATH.
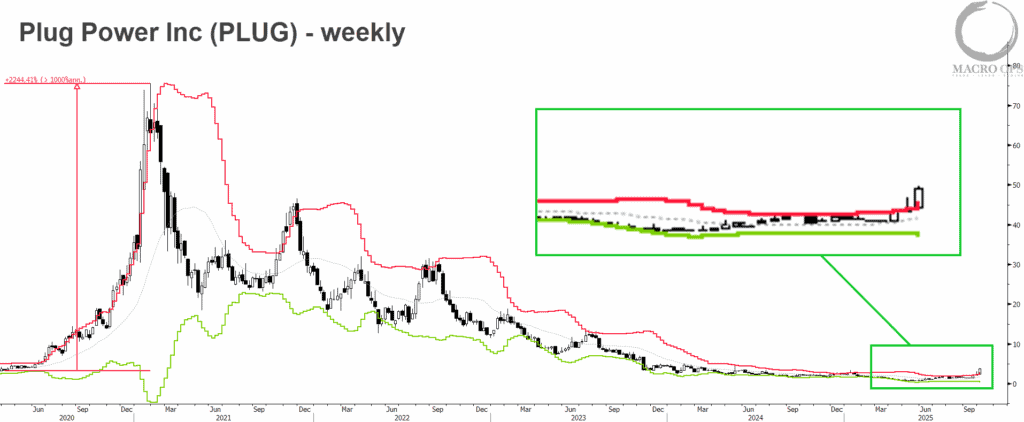
11. Another indication we’re in the very early stages of a speculative frenzy is the breakout to new 12m highs in PLUG last week. PLUG is a staple of the speculative bull market. In 21’ it ran up over 2,200%+ in under 12 months. It put up similar numbers in 99-00’. Let’s see if it can repeat.
We got long last week.
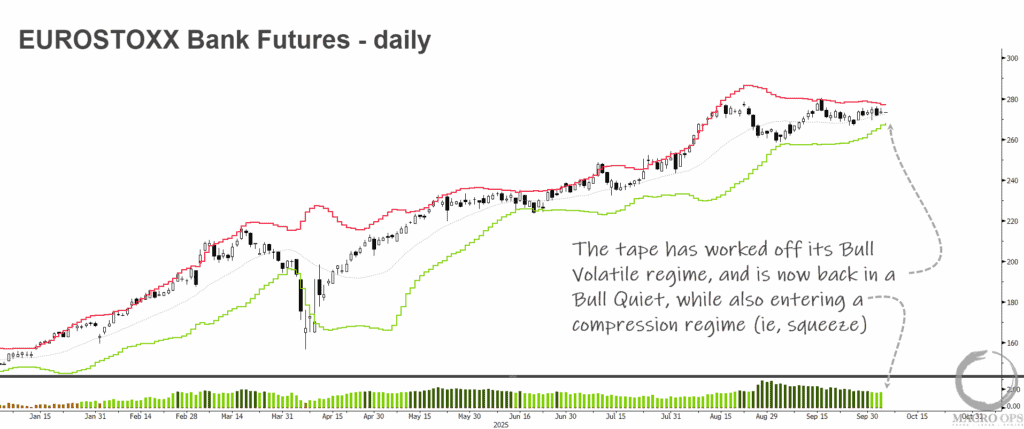
12. We recently went long EUROSTOXX50 futures on a breakout above its 5-month consolidation pattern. A similar setup we’re eyeing is in EUROSTOXX Bank Futures. The macro case for EU banks is straightforward; expanding EU fiscal policy and sticky global inflation will continue to drive up rates and widen bank net interest margins.
The tape has worked off its Bull Volatile regime and is back in Bull Quiet, while also entering a compression regime (ie,squeeze).
Join The Collective
Thanks for reading.