Currently, the Macro Ops portfolio is up over 24% year to date, compared to the S&P 500 which is only up + 9% year to date.
While we’re sitting at all-time highs, that seems easy in hindsight…just lever up!
But if you remember back in March and April of this year, the world was ending.
Tariffs were going to ruin the entire global economy.
The market was “crashing”.
Today, I’m going to show you the exact system we used to capture a good amount of those profits.
But first, let’s look at our performance and positioning as of this week.
Performance:
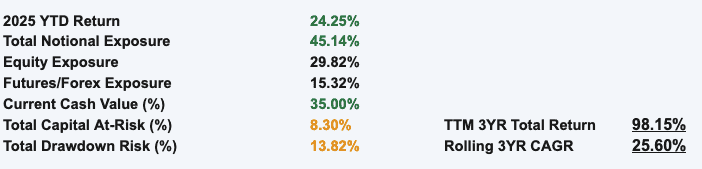
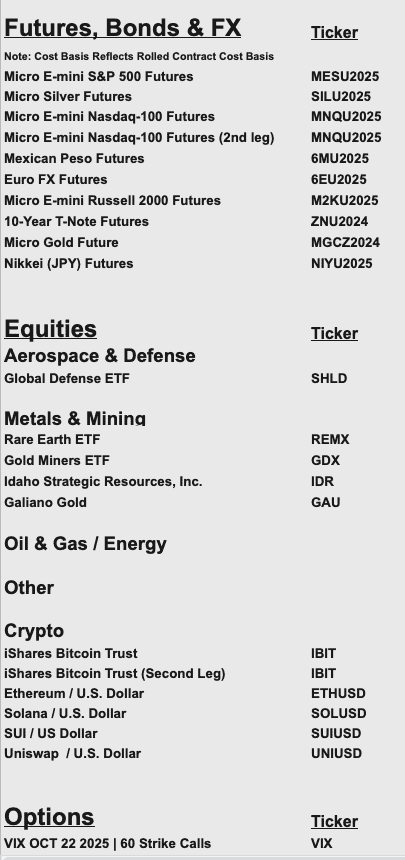
Positioning:
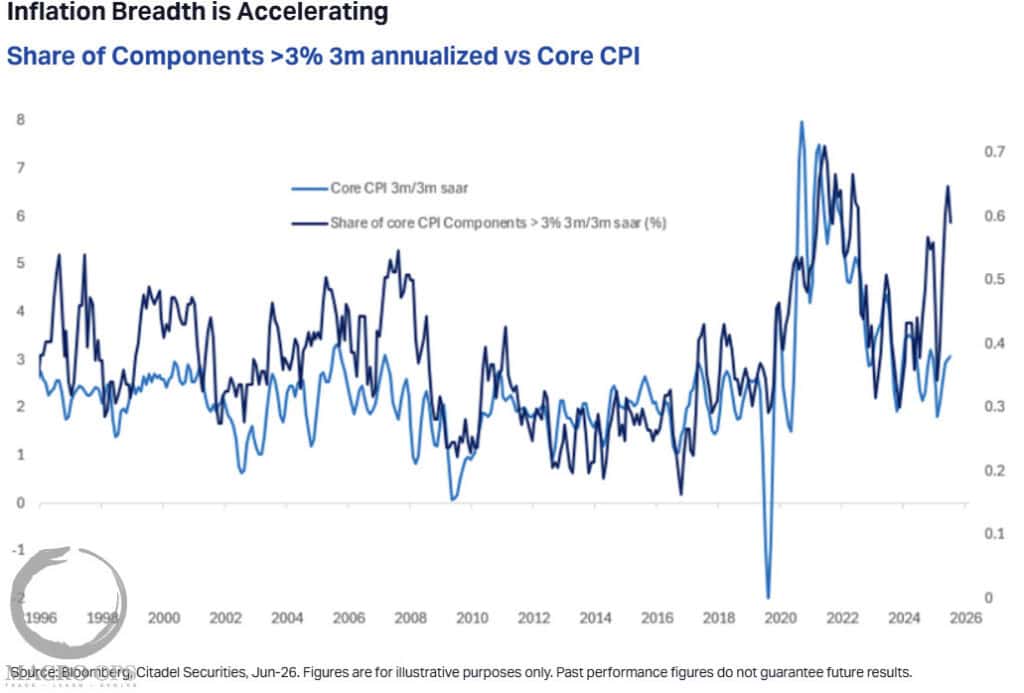
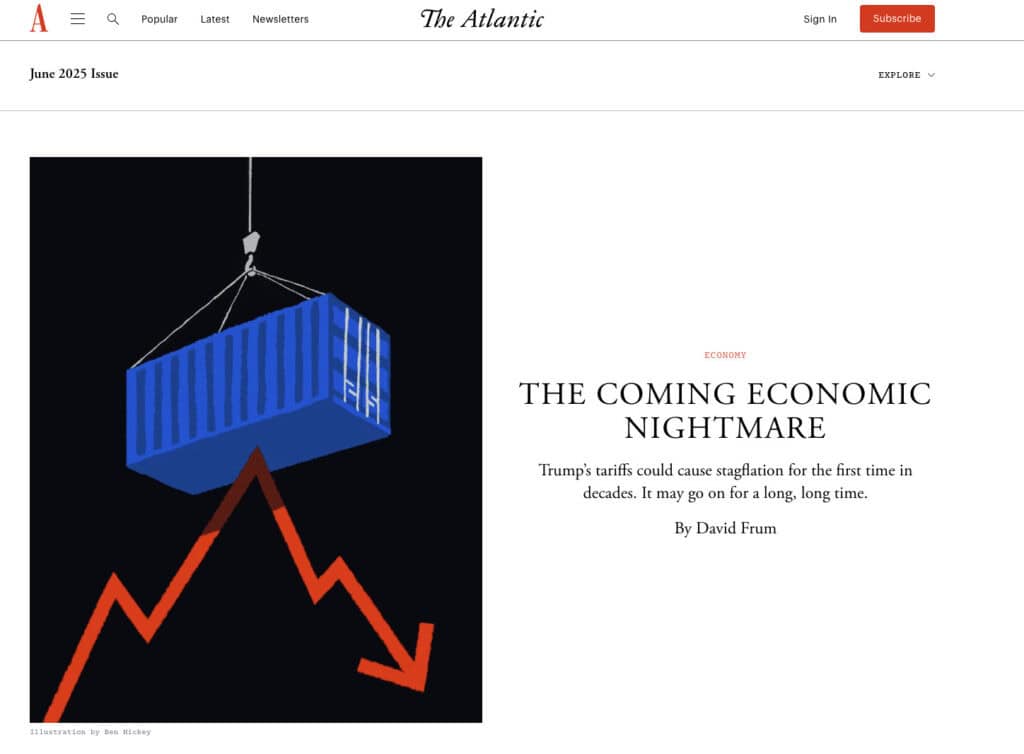
A lot of people were convinced that we were about to begin a hyperinflationary, low-growth, 1970’s 1970s-style stagflation economy…or worse (This headline was from June, months after).
The S&P 500 took about a -22% drawdown, which is considered a bear market, for what it’s worth.
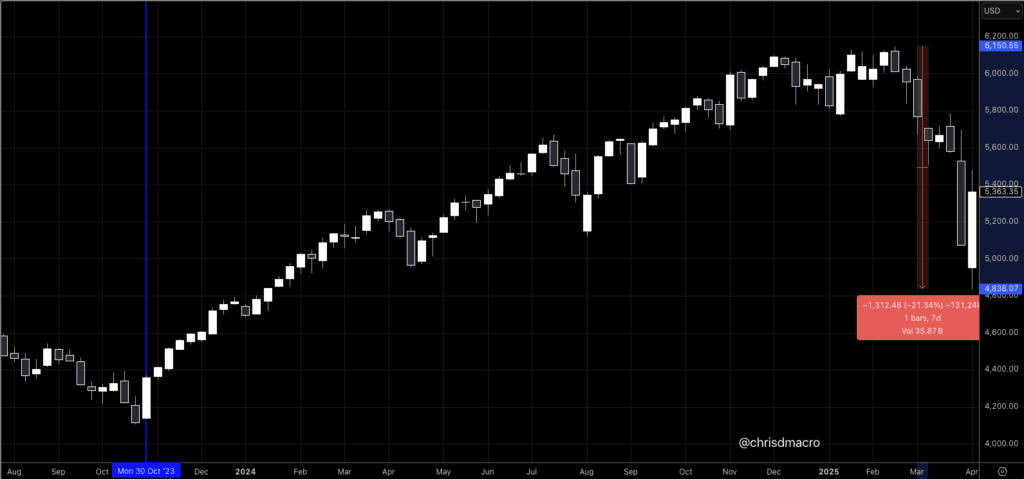
And we know what happened next. Despite everything all the experts told us, the S&P 500 did the opposite and is right back to putting in new all-time highs.
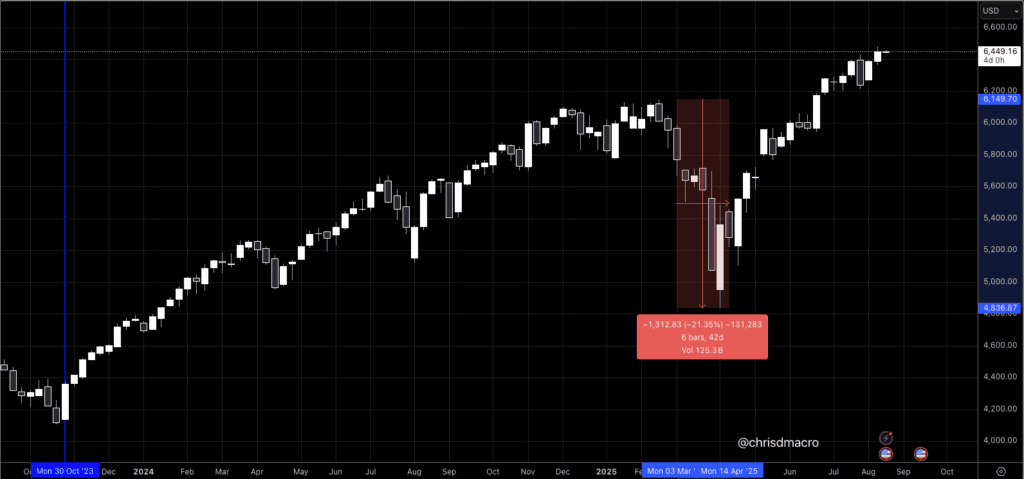
And it isn’t just the US markets, in fact, Bitcoin, the Korean KOSPI, and Japan NIKKEI are outperforming S&P 500 since the market bottomed Tuesday, April 8th, 2025.
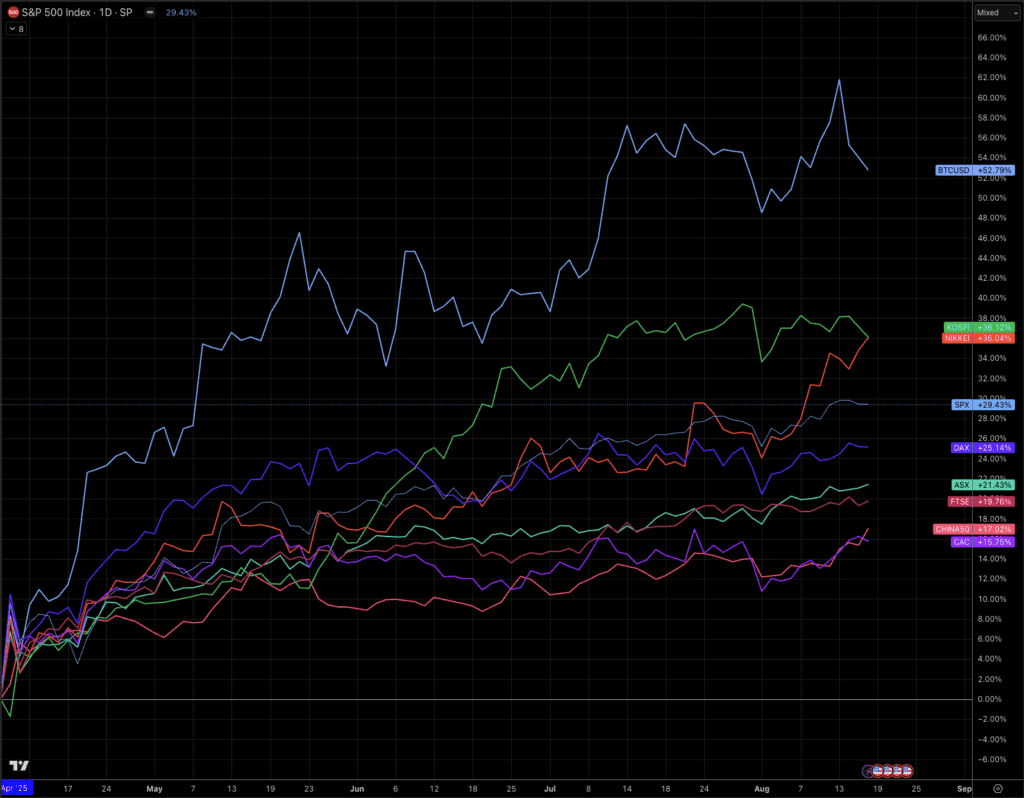
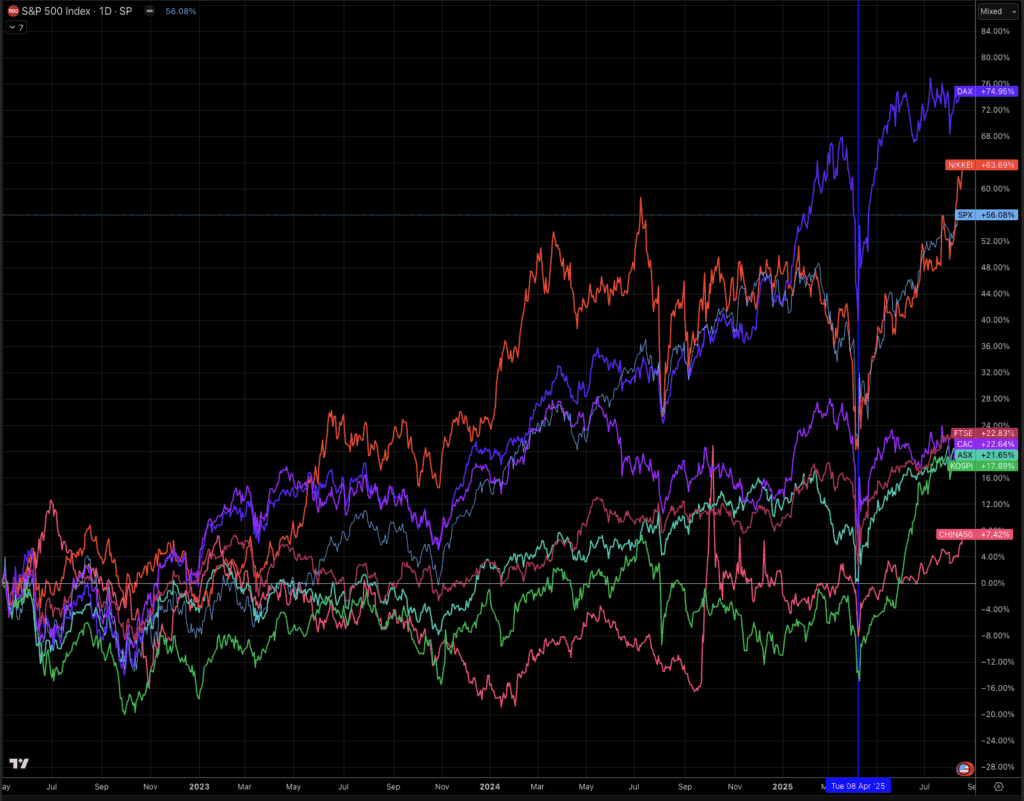
Broadly speaking, the major world indices are trading at all-time highs. I omitted Bitcoin on this one so you can see all the others combined.
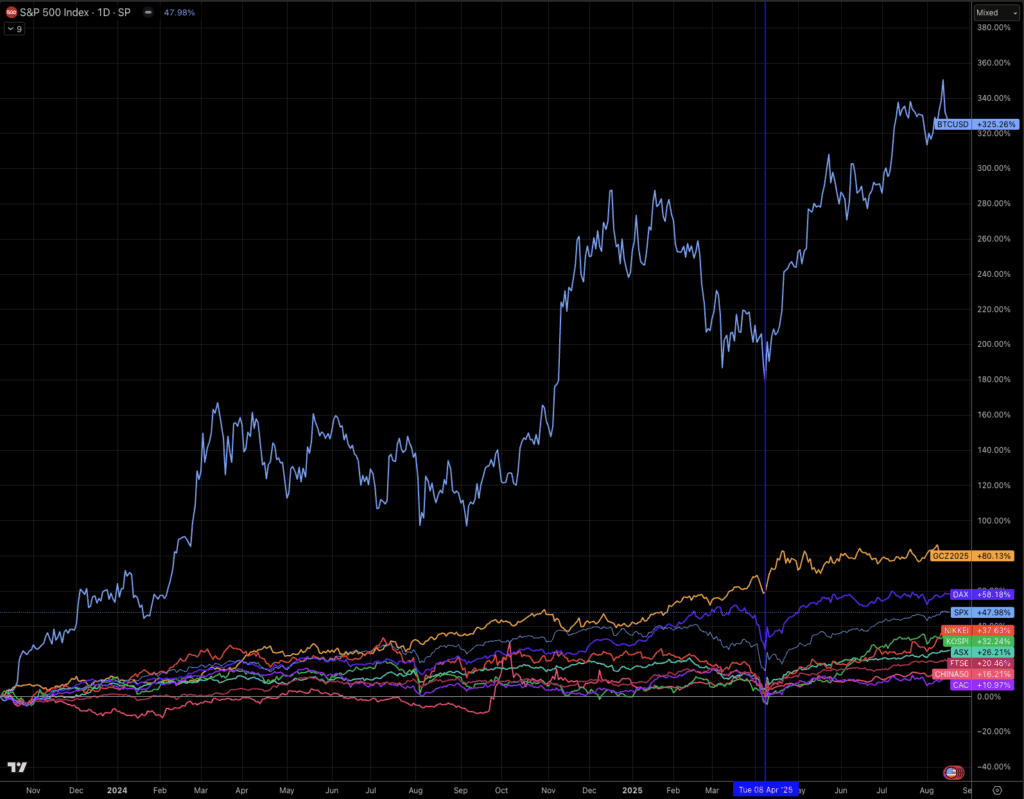
Here’s Bitcoin and Gold included for context.
Meanwhile, the Macro Ops portfolio was long S&P 500, Nasdaq, Euro, Mexican Peso, Crude Oil, Bitcoin, and Gold during the entire recovery.
This wasn’t hero trading or a “gut feeling” or buying when there’s blood in the streets.
This was purely systematic trading, no fear, no excess risk, just the same thing we do every day, week, month, and year.
We run multiple strategies:
- Fast Trend
- Slow Trend
- Fast Momentum
- Slow Momentum
- Fast Mean Reversion
- Slow Mean Reversion (this is the one we mostly used)
Today, we are going to talk about Mean Reversion strategies.
Mean reversion is based on the statistical concept that asset prices and historical returns eventually revert to their long-term mean or average level.
In swing trading, this principle is applied over shorter timeframes, typically holding positions for several days to a few weeks.
The core idea is that market movements are often driven by overreactions to news or events, causing a stock or asset to become temporarily “overbought” or “oversold.”
A mean reversion system aims to identify these moments of extreme price extension and take a trade on the “snap back” toward the average.
Think of it like a stretched rubber band; the further it’s pulled from its resting state, the more forceful its eventual return.
In practice, traders use a variety of tools to identify these overextended conditions.
We use technical indicators for this strategy.
For instance, an asset trading significantly outside its Bollinger Bands is statistically far from its recent moving average, signaling a potential reversion.
Similarly, the Relative Strength Index (RSI) moving into “oversold” territory (typically below 30) or “overbought” territory (above 70) suggests that the current momentum may be exhausted.
A trader would then enter a contrarian position, buying the oversold asset or shorting the overbought one, with a predefined profit target set near the moving average or a previous level of price consolidation.
The “edge” in mean reversion strategies comes from systematically exploiting market psychology and statistical probability.
Markets are not perfectly efficient; they are driven by human emotions of fear and greed, which consistently lead to overreactions.
By taking a contrarian position, a mean reversion trader is essentially betting against this emotional excess, buying when others are panic-selling and selling when others are buying euphorically.
This provides a statistical advantage because, over time, prices have a high probability of returning to a mean.
Furthermore, this strategy offers a clear framework for risk management.
The entry point is at an extreme, the profit target is the mean, and a stop-loss can be placed just beyond the point of entry, creating a well-defined and often favorable risk-to-reward ratio for each trade.
While no strategy is foolproof, as a temporary overextension can sometimes turn into a new long-term trend, mean reversion provides a durable, repeatable edge for disciplined traders who can capitalize on the market’s predictable rhythms of expansion and contraction.
Half of the mean reversion game is identifying the disconnect, the move to extreme edges.
But far more critical is the risk management, when to get in, when to get out, and how much to risk.
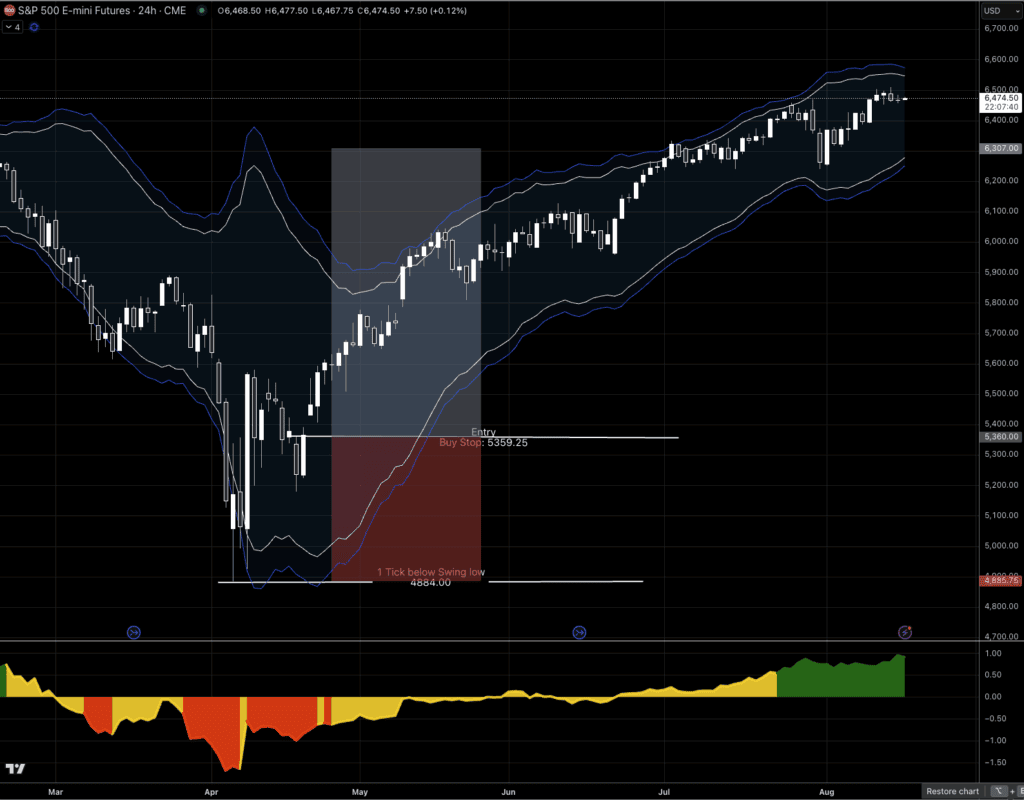
Now let me show you precisely what we did with the S&P 500 trade via the Emini Futures ($ES).
Below is the daily $ES chart with Keltner Channels.
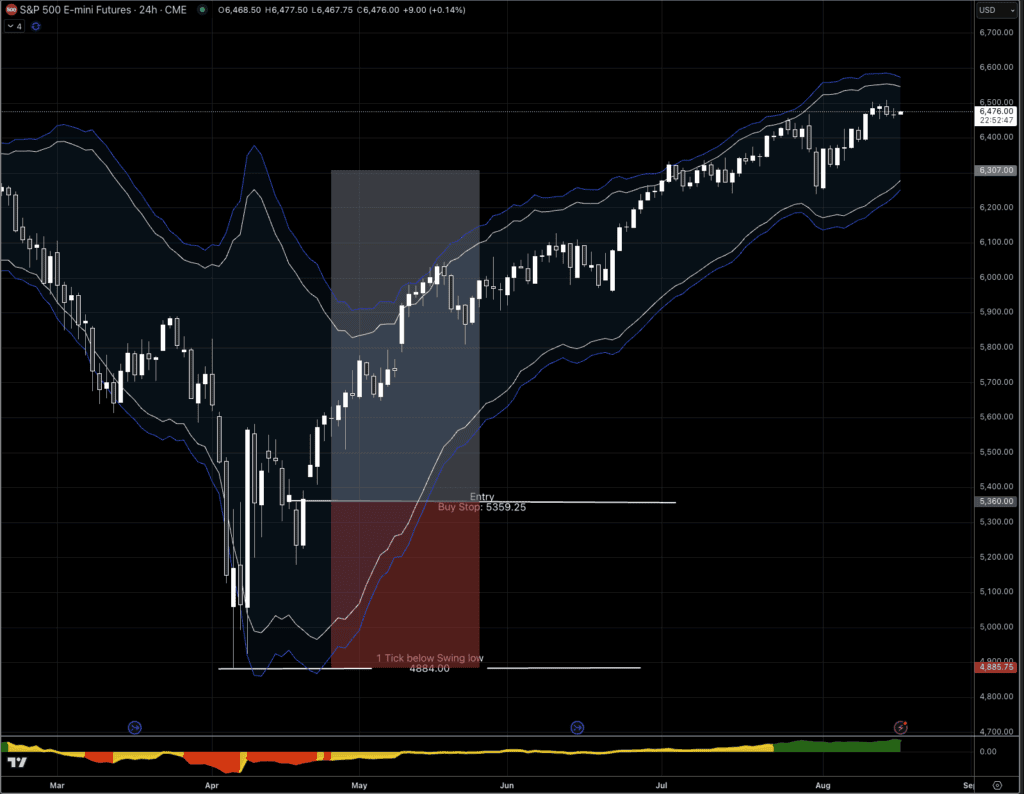
The setup is:
- Move down to an extreme (the Keltner channels are the extremes in this case)
- React up
- Move back down – this is an important part, as it is what gets everyone off sides
- Place a buy stop 1 tick above the high, and get pulled into the trade long
- Place stop loss 1 tick below the lowest swing low
Notice the range was nearly 500 ES points; that’s a massive risk range.
We size our trade based on the risk, 50 bps of risk in this case.
In other words, if we were wrong and got stopped out on this trade, we’d have lost 0.50% of our account balance.
That’s it.
When you look at it from that perspective, it really isn’t hard to put that trade on.
If you have been following Macro Ops for any period of time, you should be aware that we don’t just do trades because they look good.
We let the Market Regime tell us what environment we are in, so that we can find the appropriate system for that market regime.
The histogram I have at the bottom of this chart is called the SQN Indicator, and it is how we measure market regimes.
You can watch a video about it here.
And I go pretty deep on it here.
You can see it broken down more via an X post I did here and here.
The red part of the histogram indicates the bear quiet market regime.
The S&P 500 RARELY trades in the bear quiet market regime.
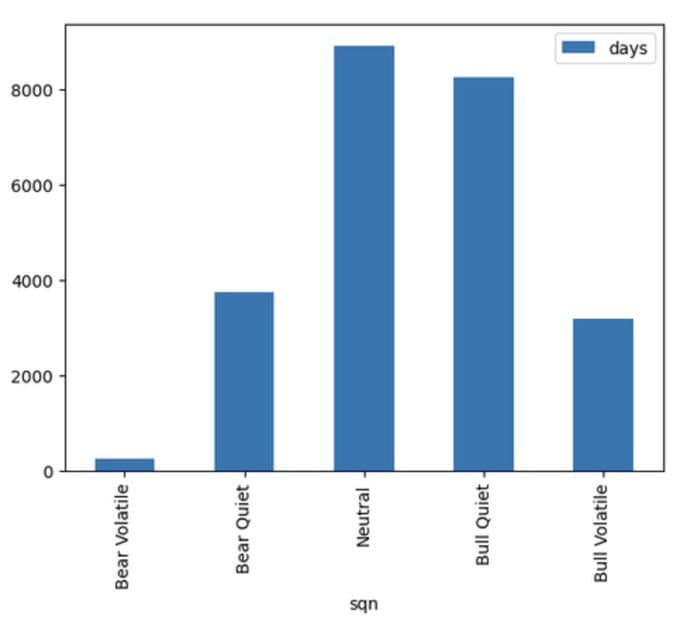
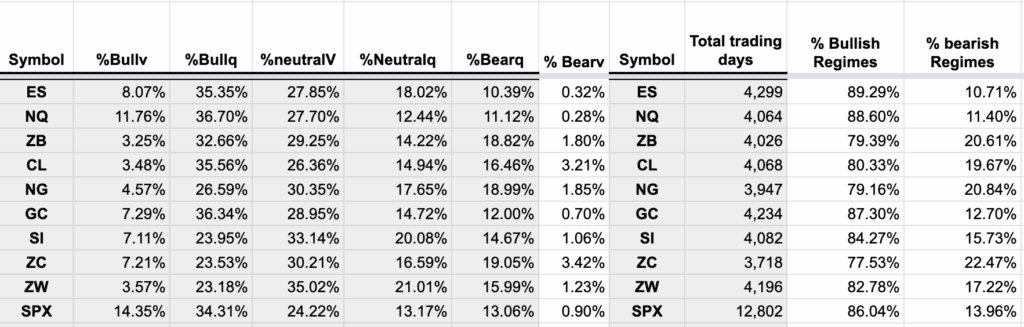
It trades in neutral, bull quiet, and bull volatile (blended bull) about 80% of the time.
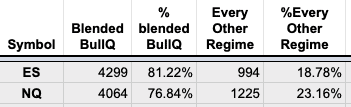
And for what it’s worth, here’s how a lot of other assets trade.
Now that we know how rare it is for the S&P 500 to be trading in the bear quiet market regime, and we have an extreme move, and most importantly, our risk management supports the trade, we can put it on.
Worst case, we’re wrong and take a 50 basis point loss, but if we’re right, we catch a heck of a low-risk entry that we can build upon for quite some time.
And that’s what we did. We added to our long position, repeatedly, using our trend systems (I’ll go into those in another email).
Now let’s bring it up to date with a trade we just entered, less of an extreme in pricing, but a current example of the slow mean reversion trade in action.
Last week we went long the Russell 2000 Index, with a dip down to the bottom of the Keltner Channels in a neutral market regime.
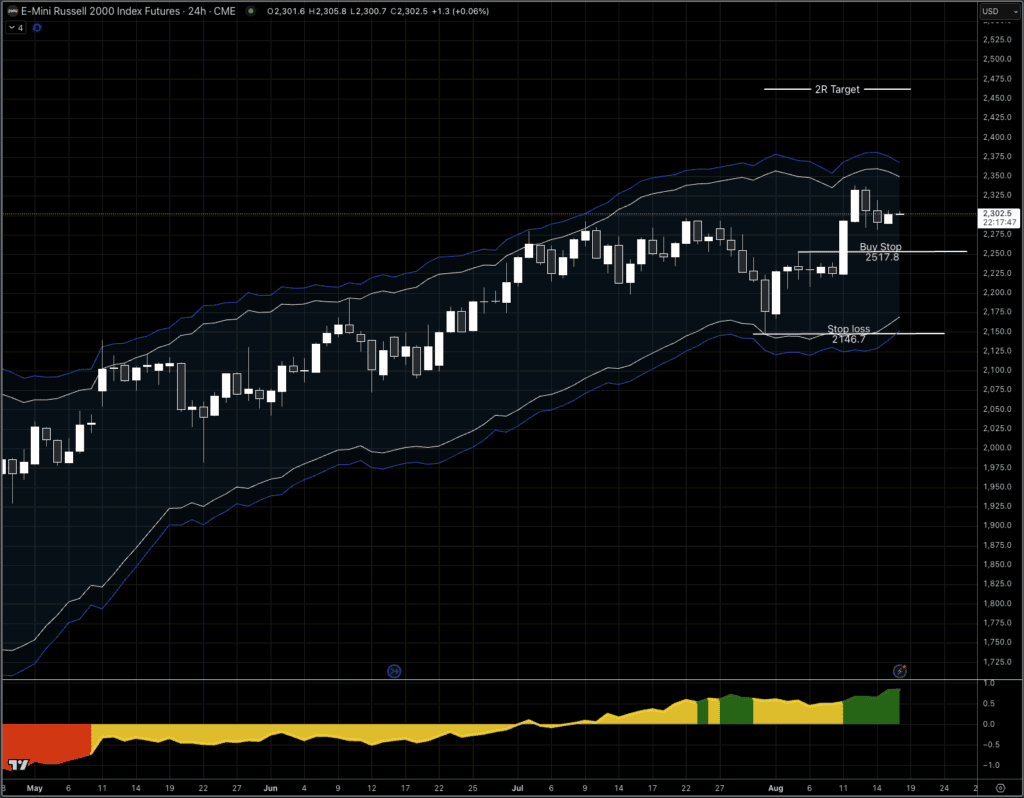
Again, 50 basis points of risk is all we are using here; if wrong, we get stopped out.
For the most part, our trading here at Macro Ops is quite boring. But sometimes, we are given an opportunity that makes us look brilliant…to those without a systematic approach, that is.
This week we are mostly sitting and watching $TSLA, $AAPL, and Crypto, as we are well positioned in everything else.
If you are interested in the strategies that I use.
And you can work with me on building out your trading business in the Trading Thunderdome.