MACRO OPS PORTFOLIO HOLDINGS – (Futures, Bonds & FX)
- Long Bitcoin – we added to a full 100 bps of risk now
- Long 3 Month SOFR Futures 50 bps of risk
- Long S&P 500 Futures 50 bps of risk
- Long Nasdaq Futures 50 bps of risk
- Long Soybean Futures 50 bps of risk
- Short Gold Futures 50 bps of risk
- Long WTI Crude Oil 50 bps of risk
- Long Mexico Peso 50 bps of risk
This past week we increased our equity exposure by establishing long positions in Nasdaq futures, complementing our existing S&P 500 futures position which we entered at 5309. This move brings our equity long exposure to a complete 100 basis points (we doubled our long position) of risk and reflects our confidence in the current market trajectory.
I expect to continue to add to this position if the trend continues.
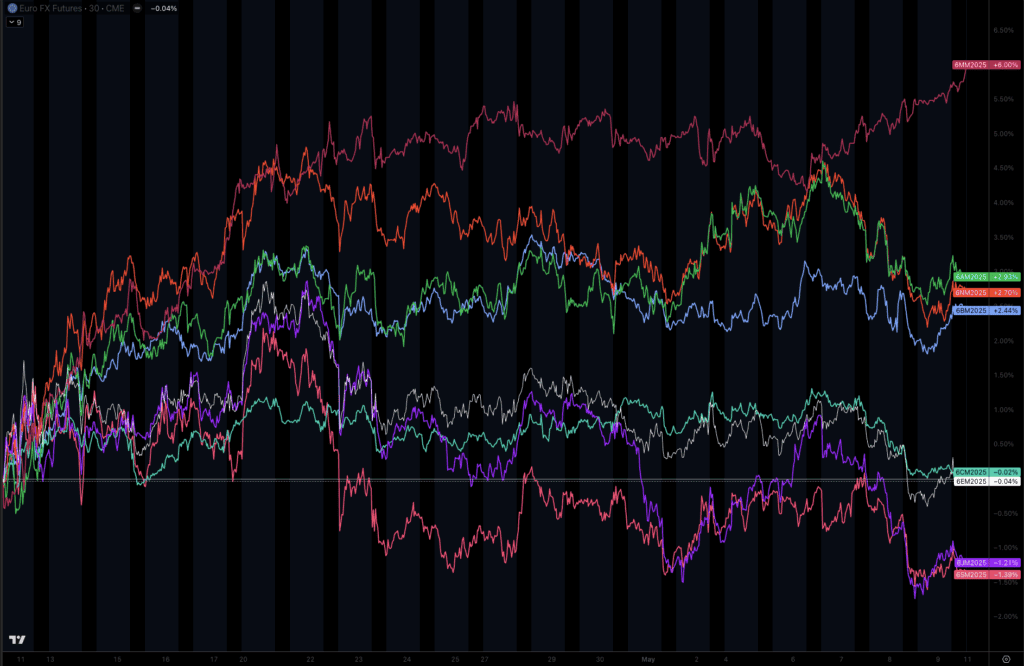
In currency markets, we’re observing an intriguing anomaly: the Mexican Peso has been showing surprising strength while other major currencies continue to weaken against the USD. This divergence merits close attention as it could signal important regional economic shifts or unique capital flows.
Since April 10th the Peso has nearly 2x’ed the performance of other top currencies we’re watching.
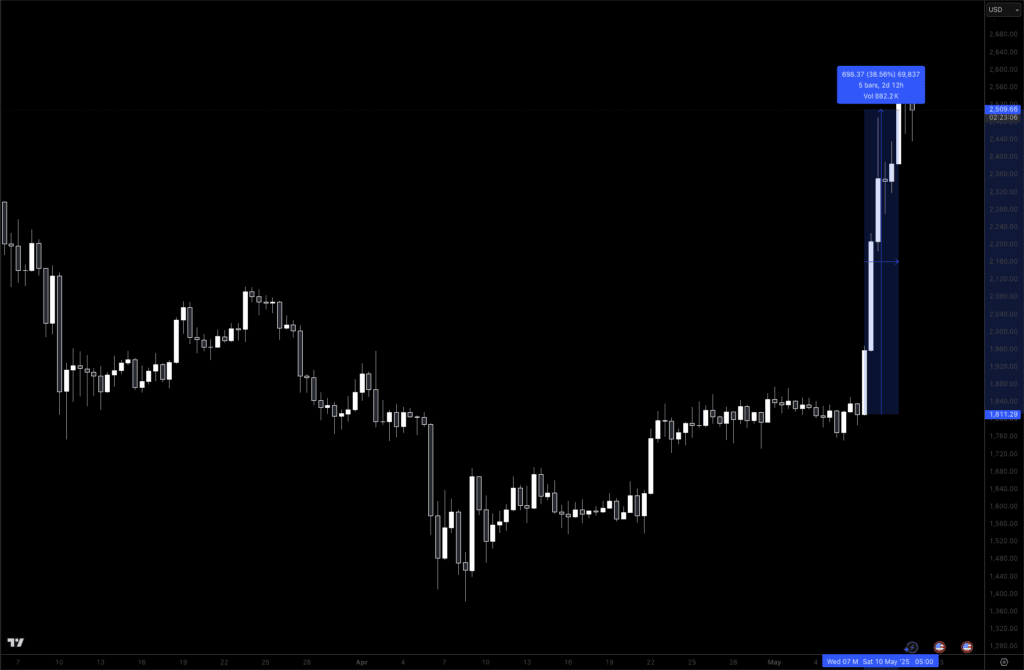
Meanwhile, our Crypto Momentum system has reactivated after a period of dormancy. The signals emerged approximately a week ago, with half of our select sectors now into the momentum window for long positions.
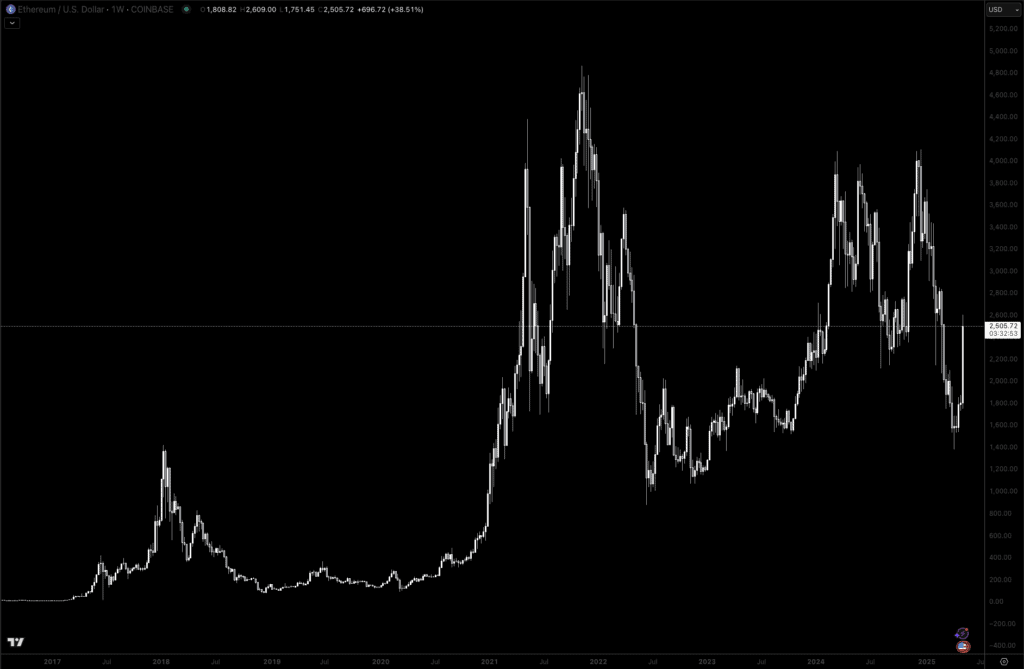
The most noted change is Ethereum up nearly 40% in a few days.
This system-driven approach allows us to participate in crypto market upside while maintaining our disciplined risk management framework.
YTD PERFORMANCE:
- Macro Ops Portfolio YTD Returns +8.40%
- S&P 500 YTD Returns -3.77%
Despite the extreme market volatility we’ve experienced recently, our Macro Ops portfolio has maintained its edge, consistently outperforming the S&P 500 while exhibiting remarkably low volatility.
This stability wasn’t accidental, it’s by design.
Our systematic approach prompted us to significantly reduce exposure before market conditions deteriorated. As a result, we successfully sidestepped the drawdowns that impacted many investors who remained fully invested.
The real advantage of our methodology became evident as volatility reached its peak. While others were frozen with uncertainty or selling at lows, our systems began methodically identifying re-entry points. This allowed us to gradually increase our market exposure through a disciplined, systematic process rather than emotional decision-making.
This measured rebuilding of positions continues to unfold according to our quantitative frameworks, demonstrating once again that systematic risk management doesn’t just protect capital, it positions us to capitalize on opportunities that emerge from market dislocations.
And keeping the volatility levels loooooow in our portfolio.
Why Did We Buy the Dip?
Approximately 60-75% of all U.S. equity trading volume is now generated through algorithmic trading systems. This represents a significant increase from earlier decades, showing how deeply automated trading has penetrated the market.
The prevalence varies somewhat by market segment:
- In major U.S. equity markets, algorithmic trading accounts for approximately 60-73% of all trading volume
- In foreign exchange (forex) markets, algorithmic systems handle an even higher percentage—studies from 2019 indicated around 92% of forex trading was algorithmic
- For futures markets, about 40% of options trading is executed algorithmically
Mean reversion trading is very much an algorithm.
As much as you might not want to believe it, dips get bought because there’s a large statistical edge and algorithms are going to exploit it.
Mean reversion trading represents one of the most powerful and enduring edges in financial markets. At its core, this strategy operates on the principle that asset prices tend to normalize around their historical averages over time.
When prices deviate significantly from these established means, whether through overreaction to news, temporary liquidity imbalances, or emotional market behavior.
They create high-probability opportunities for disciplined traders to profit as prices return to equilibrium.
The effectiveness of mean reversion strategies stems from fundamental market mechanics and human psychology. Markets frequently overextend in both directions due to emotional responses, institutional positioning requirements, and short-term capital flows that temporarily distort prices beyond sustainable levels.
When an asset trades 2-3 standard deviations from its statistical norm, the odds increasingly favor normalization rather than continued extremes. This statistical edge becomes particularly powerful when combined with volatility-based position sizing, allowing traders to deploy more capital precisely when mathematical probabilities are most favorable.
Unlike trend following, which can require substantial drawdowns before capturing major moves, mean reversion strategies typically offer tighter risk parameters with more frequent, moderate-sized wins.
An appealing characteristic for risk-conscious capital allocators seeking consistent performance without excessive volatility.
And that is why we “bought the dip” on S&P 500.
There was no, humming and hawing. I wasn’t watching the news harder than anyone, or had any special insight into what was happening in the world. Quite the opposite.
The mean reversion system, Curvy, had a buy signal. That’s it.
So we put our trade on. If we were wrong, we’d have lost -1R on the trade, just like we would on any other trade.
In the Collective this week, we’ll be doing a live session going over Mean Reversion and Failed Breakouts.
We’ll drop a link in Slack for it.
This Weeks Setup
The Crypto Momentum System has flashed its “risk-on” signal again, and we’re moving decisively with it. Unlike typical approaches, this system doesn’t mess around with dollar-cost averaging or buying arbitrary dips. It has one clear mission: capture uptrends when momentum is building and exit before major collapses.
This precision was on full display during the recent U.S. Presidential election cycle. The system positioned us long in late September, then pivoted us to safety by mid-December, right before alt coins experienced a brutal selloff.
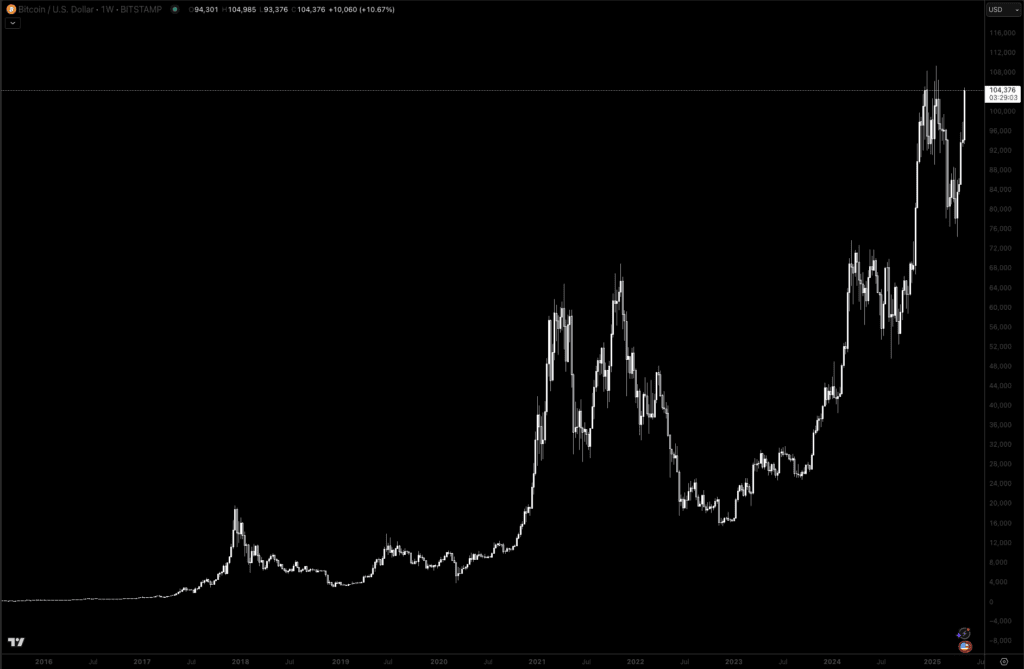
Most recently, we received signals to accumulate Bitcoin at $83K, with additional positions at $95K.
But where this system truly excels is identifying when alt coins are about to launch into those face-melting rallies they’re infamous for. Anyone who’s traded alts knows their incredible volatility.
While they can surge 200-400% in mere days, dramatically outperforming Bitcoin during bullish phases, they also crash harder when the inevitable correction comes.
And make no mistake, that correction always comes.
This time is not different.
Beyond proper risk management, perhaps the most crucial skill in any market is knowing exactly when to exit.
Currently, four of our eight tracked crypto sectors have entered the momentum window, allowing us to capture the earliest phase of this alt coin rally.
What’s particularly interesting about the 2024 crypto market is that most alt coins never reclaimed their 2021 highs.
Since mid-December, many have surrendered significant gains. This creates a perfect setup for risk capital to grow restless with Bitcoin and seek alternative opportunities.
Consider Ethereum, still trading 50% below its all-time high from 2021.
Meanwhile, Bitcoin spent most of 2024 consistently setting new records.
This isn’t necessarily a buy recommendation for Ethereum, but rather an observation that Bitcoin has dominated this cycle so far. Eventually, capital will grow impatient and chase momentum elsewhere, precisely where our system demonstrates its value.
Our approach bypasses the noise. We don’t:
- Chase headlines
- Jump into pump-and-dump schemes
- Hunt for obscure meme coins “in the trenches”
- Use leverage
Instead, we focus exclusively on high-cap leaders in the strongest sectors, executing our strategy through mainstream platforms like Coinbase.
No exotic high-leverage overseas exchanges required.
The results speak for themselves: consistently outperforming the market while, crucially, preserving those hard-earned profits when others are giving them back.
This is the beginning of the next leg, and the most profitable phase of the momentum cycle.
Using the historical analog of Bitcoin after the 4 year halving event, we have about 200 more days before the peak.
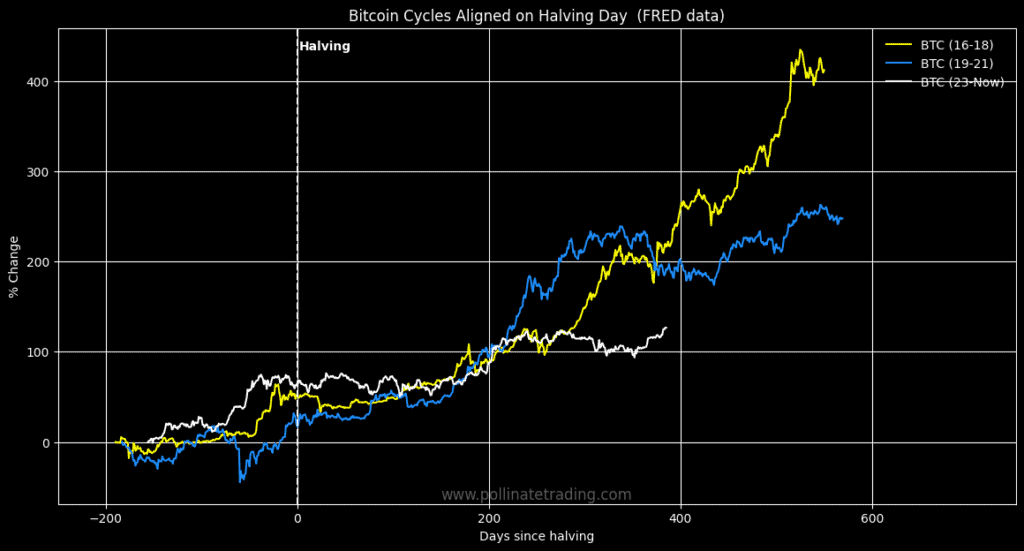
But remember this is a Bitcoin analog, which generally represents “the crypto market”.
When Bitcoin tops out, all that money spills out into alts and that’s when the big momentum moves happen.
We still have plenty of time.
But like I warned last week. You want to get setup before things get going.
We opened the system availability back up to 20 more traders (maximum). Crypto is thin; too many users dilute the edge. We still have some seats available, but you’ll want to get setup the market gets hot.
The thing about crypto is that everybody always waits until everyone is in a frenzy, which is usually the top.
When these seats are gone, the next cohort will pay more, if we reopen at all.
Click below, secure your access, and be trading tonight:
Claim My Seat in the Crypto Momentum System
You’ll receive instant access to the members’ portal, your templates, and a welcome email with Slack credentials. Set everything up, then let the system do the heavy lifting.
THUNDERDOME UPDATE
In the Thunderdome this month, digging deep into Generative AI, and using LLM’s.
We’ve already built live trading strategies.
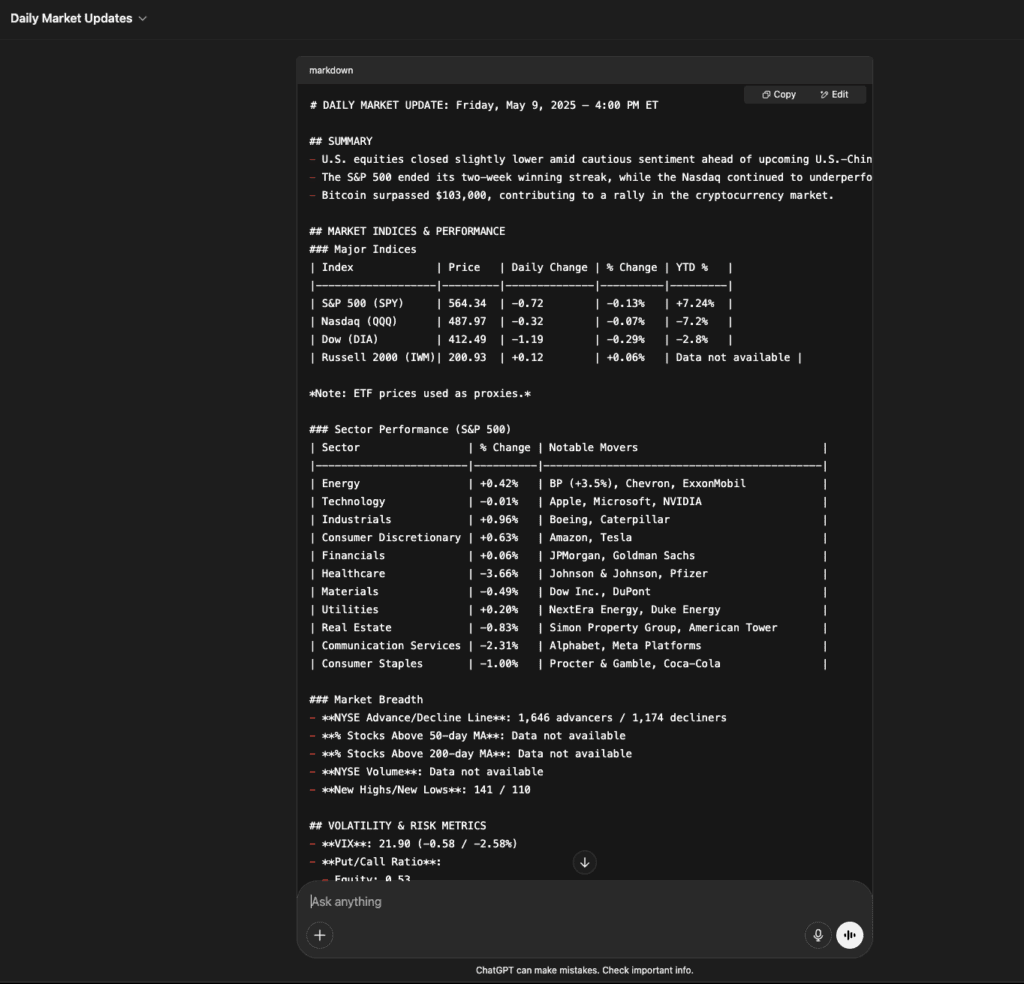
We built a custom GPT that generates a daily dashboard to go out and get us all the important information that we need for the trading day.
Here’s what it looks like:
This coming week we’ll be building our own custom GPT that builds trading algorithms right out of the best algorithmic trading books ever written. Without having to know how or do any coding!
We do two live sessions per week.
JOIN THE THUNDERDOME
That’s it for this week.
If you are interested in the strategies that I use.
And you can work with me on building out your trading business in the Trading Thunderdome (we’re starting a new cohort next week).