Over the weekend, I posted some data about the VBO (volatility breakout system), and while it was neat-o (at least to me), I received questions about it.
This is one of the foundational systems we run here at Macro Ops.
It’s all based on the idea that markets move from high volatility to low volatility.
But more importantly, when in very low-volatility (compressed) markets, they explode out and can go on massive runs with very little warning.
Here’s the trade setup…
In the past year, Gold has put in multiple massive moves higher starting out in February 2024 at about $2250, it’s currently trading at about $3250 /oz.
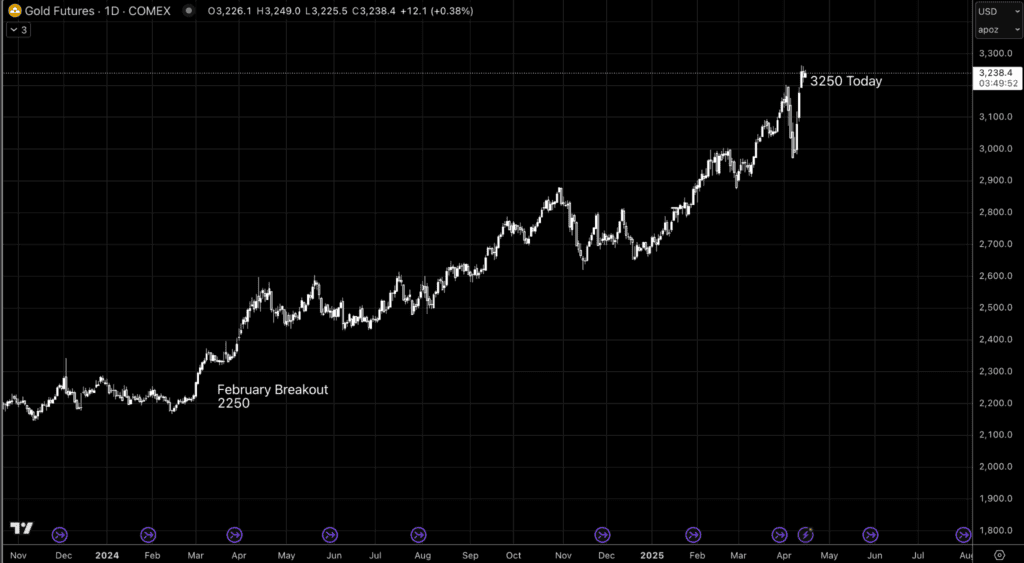
The VBO system caught a lot of that, not through good old buy-and-hold but by catching the breakout and then adding to positions along the way.
Here’s how we did that…
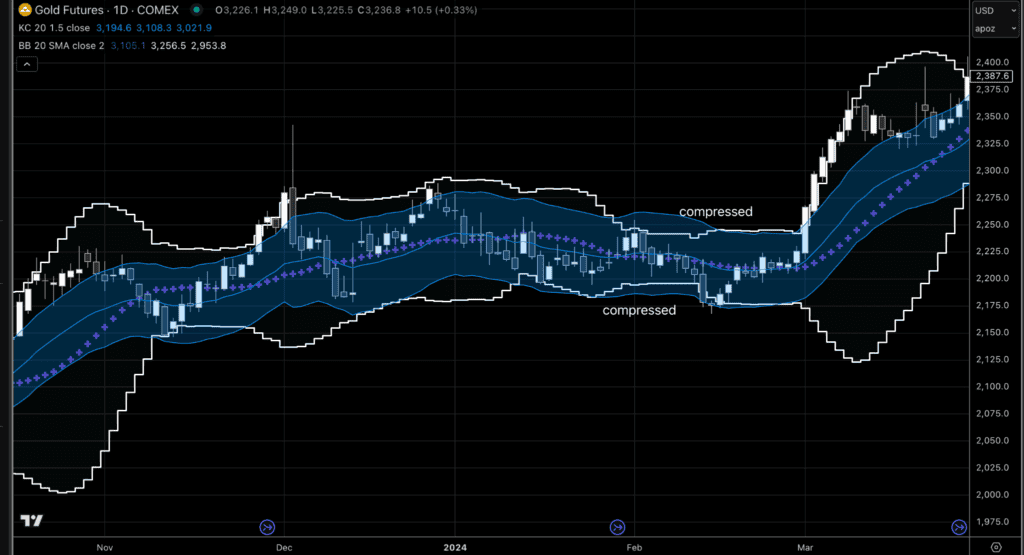
To start, we need to identify low (compressed) volatility. We do this with Bollinger Bands and Keltner Channels.
When the Bollinger Bands are inside the Keltner Channels, we have the compressed volatility we are looking for. When this happens, price is “coiled” and ready to explode from either side of the range.
In this chart, you can see that the price of Gold has been trading in a sideways range for nearly five months. Also, notice that at the beginning of the range, it was 150 points; by the time you get to the end, it is more like 40 points…Of course, the Bollinger Bands (white) were much narrower towards the end. That’s the low-volatility compression we are looking for.
It’s important not to try and anticipate the move or, worse, get out too soon.
This long-drawn-out sideways compressed volatility is caused by breakout traders early in the range piling in, convinced that the next powerful leg is upon us. Except at this point, they’ve all bought, and they are all anticipating the big breakout, so there’s no one left to buy.
The potential rally flames out, and prices dip back inside the range. This happens on the long and short sides, causing those wider ranges.
Eventually, breakout traders get exhausted and leave for more exciting markets.
This sideways range is a paradise for mean reversion traders, who buy dips and sell rips. As the range becomes more obvious, more mean reversion traders show up. This causes the ranges to continue to compress as they compete to get their orders in earlier and earlier.
Mean reversion tends to have a higher win rate but smaller wins.
This low-volatility range creates an environment of complacency.
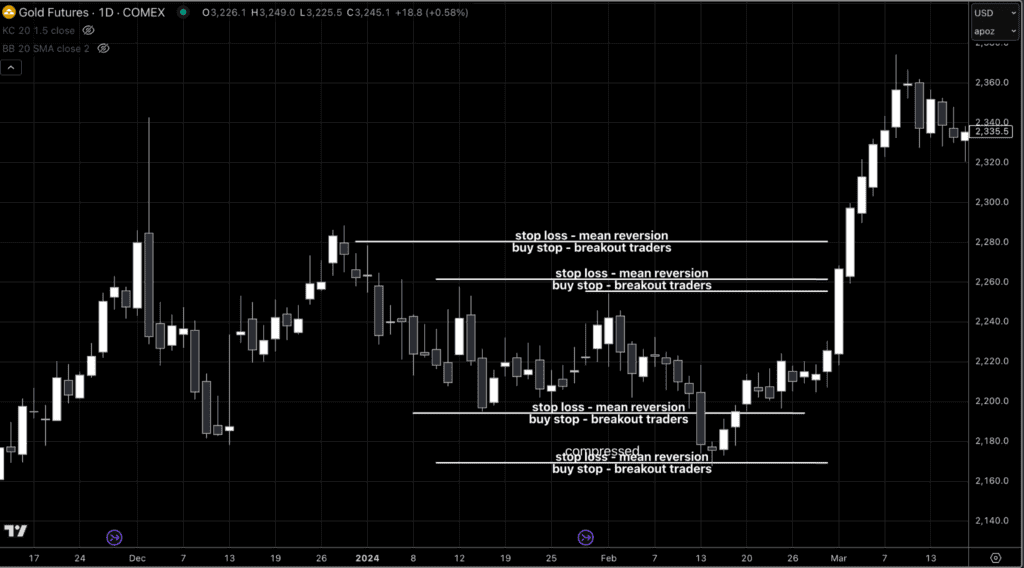
A clearly defined range draws in mean reversion traders, who become complacent because the win rates are high, and they can place stops very tactically at clearly defined (by the trading range) levels.
The stop-loss orders all pile up together from mean reversion traders.
Breakout traders see the long sideways trading range and will have buy stop orders above the top of the range in case the range is broken, to catch a breakout trade.
These orders are sitting and waiting, stacked up to look something like this.
A market that is moving in such a tight range is also a market that has no catalyst. All the news that is out is already absorbed in the price while it’s in a trading range. Even if new news is released, if it isn’t big enough to move the price outside of the compressed trading range, it really isn’t all that important.
These are all the building blocks to a Volatility Breakout Trade.
The trade signal is to wait for a bar to close outside the compressed Bollinger Bands and Keltner Channels, the arrow on the chart below.
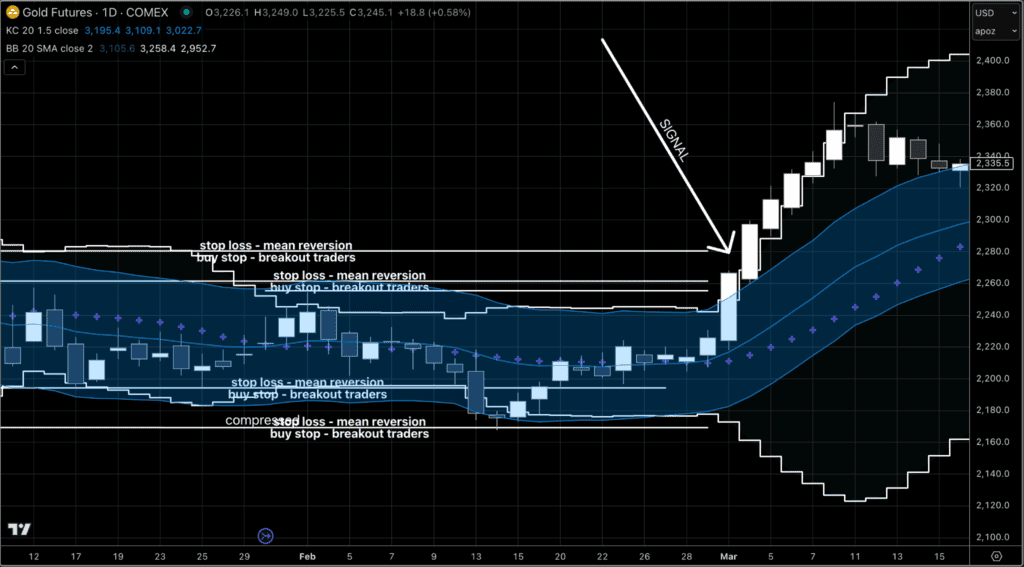
Here’s the entry setup.
Traders have recency bias, mean reversion traders will have exited their shorts getting stopped out, causing buy orders. This pushes prices higher, and the casual breakout traders with orders waiting, will also have their buy orders filled.
That can cause a move, of course, but usually, something more fundamental, like new information, has come in and brought in longer-term traders (bigger money) participants. They will be the bid in the market for a longer period of time, weeks perhaps.
Short-term traders will exit with quick profits or quick stopouts if they are short and watch as the trend takes off without them.
So, in addition to the longer-term traders (big money), shorter-term traders (small money) will constantly be in and out, providing a constant flow of orders.
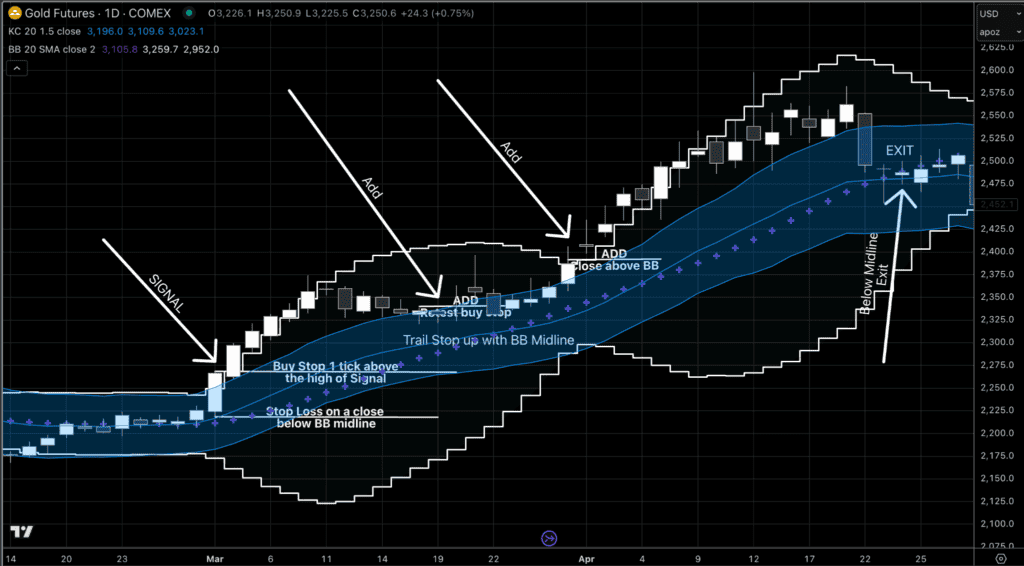
When the VBO system works like this, you can add, add, add to your position while raising your stop.
Here we made +4.1R on our first entry, +3.27R on our second entry and +1.93R on our third trade before eventually trailing stopping out, for a total of +9.3R on this trade.
This setup isn’t rocket science! In fact, you can find all sorts of info about vol breakout systems on the internet. But I put my own spin on them and manage the trades a little bit differently than most people. That’s how I up my performance from “okay” to outstanding.
I have extensively studied these volatility based setups and backtest the hell out of them to make sure that when I take a trade I have positive expected value.
There’s no reason to waste my financial capital or mental capital on any trades that don’t have a long-term edge, which is why I do so much research into these systems.
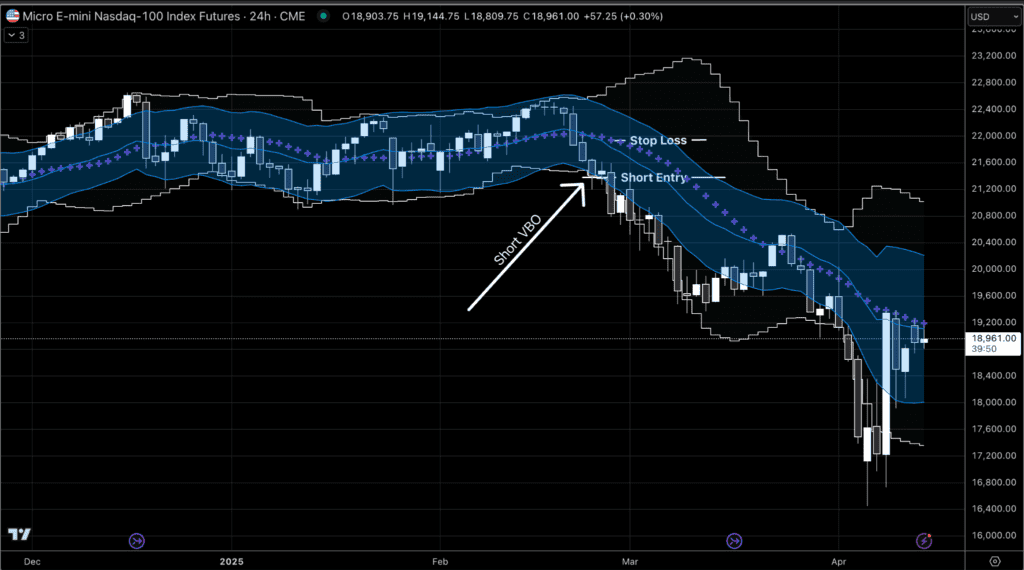
As we are looking at markets today we can see that the VBO setup was clearly there on Nasdaq Futures near the end of February.
- Compressed volatility? Check
- Breakout of range? Check
- Close outside of range? Check
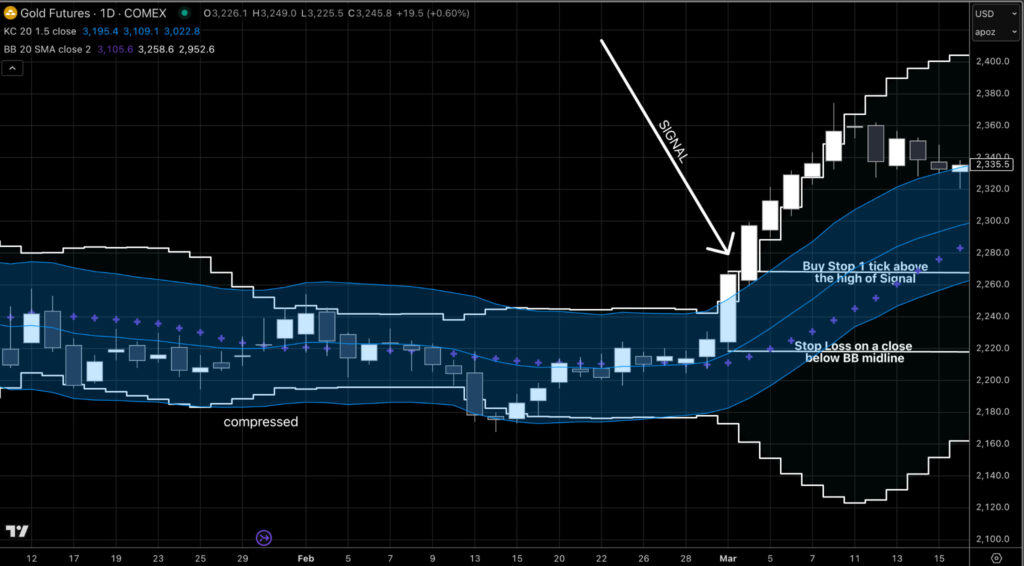
Sell stop one tick below the low with a stop loss on a close above the Bollinger Band midline.
After the massive volatility that we’ve had the past few weeks, it’s going to take some work for volatility to compress again. That’s to be expected.
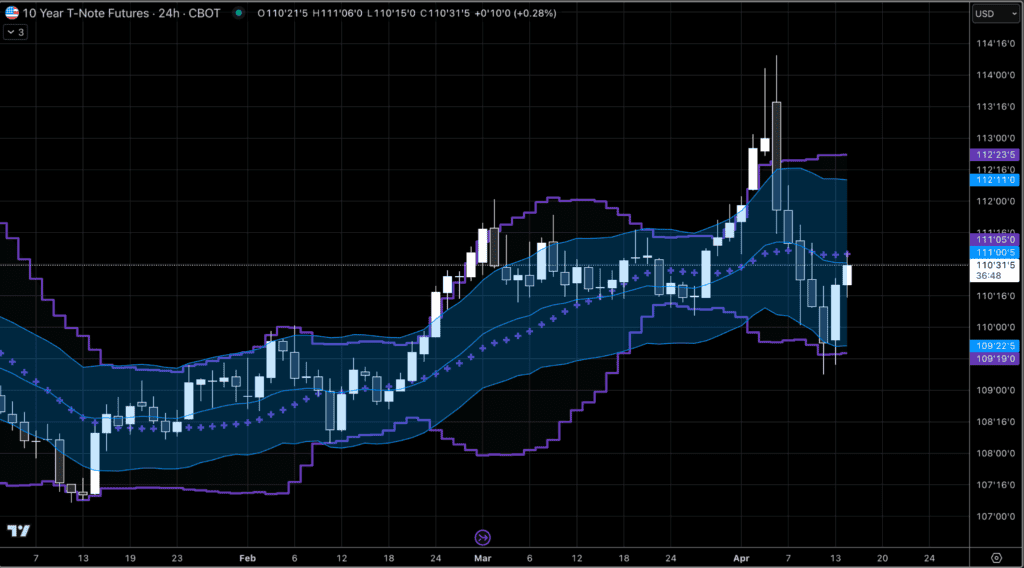
So, for now, I’m keeping an eye on a few markets to see if volatility can tighten up, get everyone really bored, and give us some opportunities.
I’m tracking the 10-Year Notes $ZN Futures.
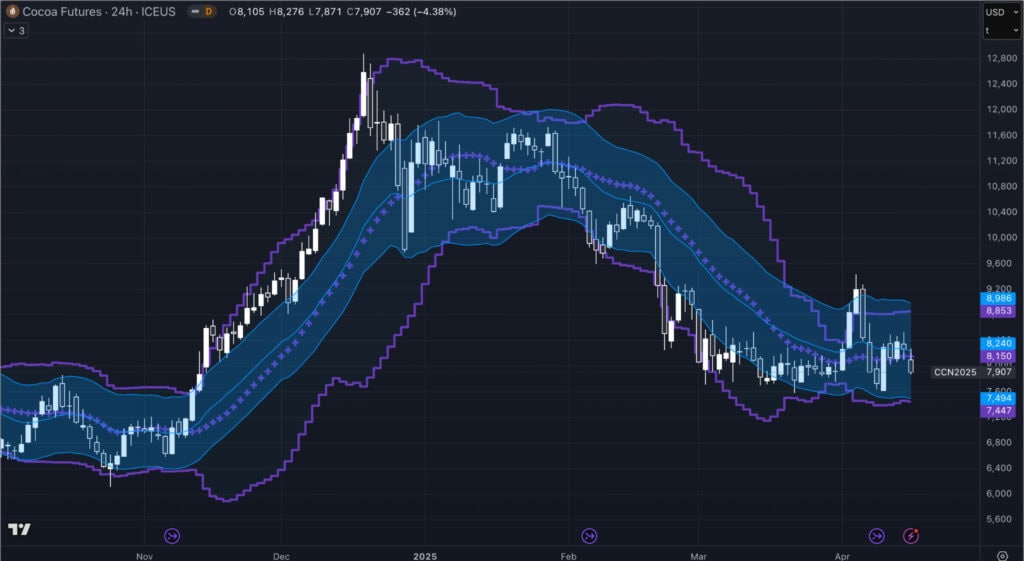
Cocoa Futures
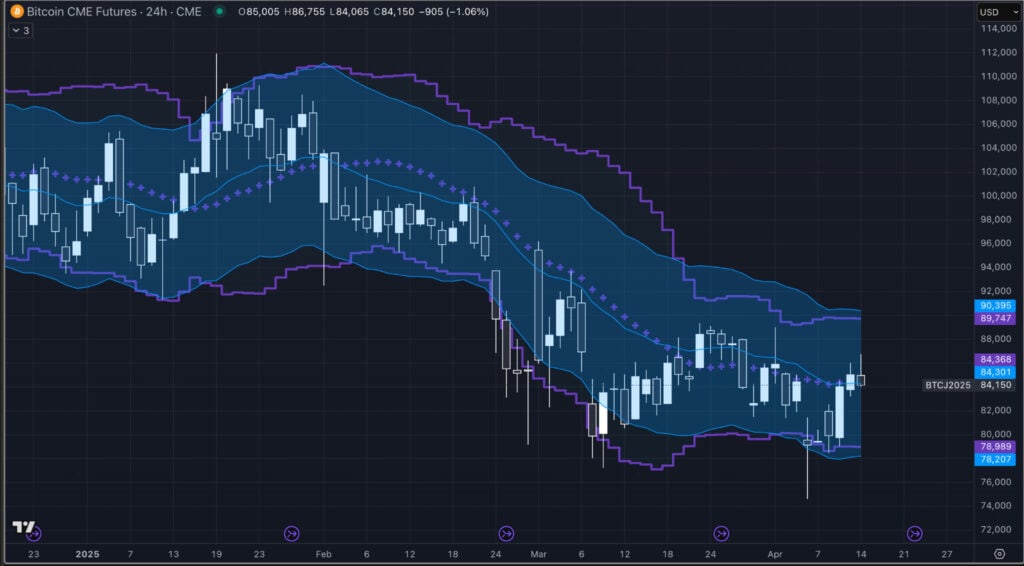
Bitcoin, which was completely quiet during all of this market chaos.
And Wheat.
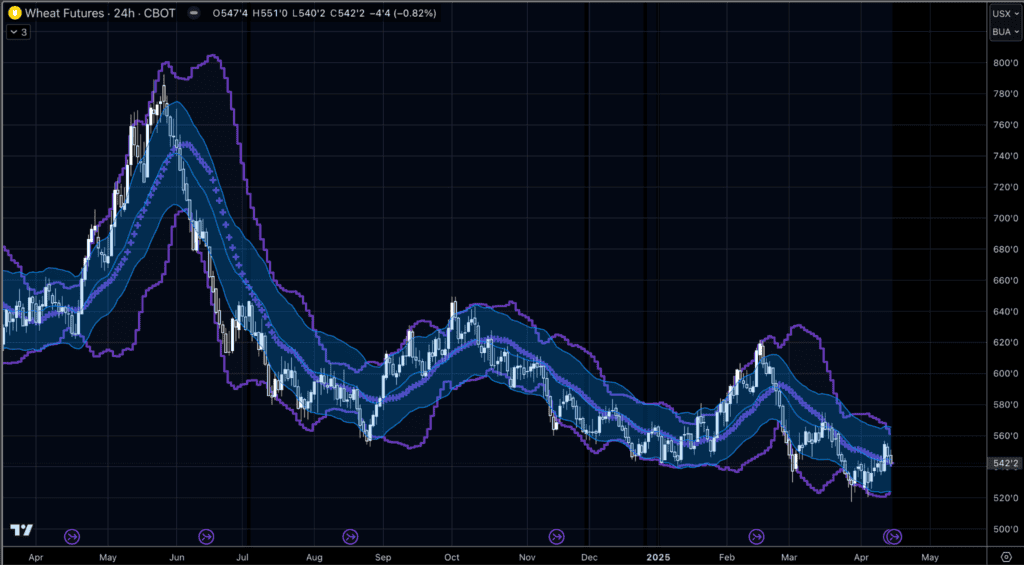
It very well could be that these assets in low volatility compression while the big markets were in extreme high volatility might make a nice little move outside of compressed volatility and give us some VBO’s
Stay tuned, I’ve got a lot more to share on these volatility-based systems.
One last thing.
I’ve decided to open up some time each week to consult with HFs or family offices to work on testing out and/or systematizing parts of their process. I’m keeping it limited to 3 spots for now, so I can spend a good amount of time with each client. If you’re interested, shoot me an email, and we’ll set up a call to see if we’d be a good fit.