“The oak fought the wind and was broken, the willow bent when it must and survived.” ~ Robert Jordan
Summary: We’re experiencing the largest geopolitical reorganization in over 75 years, one that will unleash numerous unforeseen second —and third-order shocks to the system, and meanwhile, retail punters are rushing to buy the dips… Yeah, I’ll pass. Buying conditions are still absent from this deeply oversold market. Trigger catalysts are absent as well. Will we get a rip of a bounce soon? Sure, we’ll probably see one this week. But unless we get the necessary conditions and technical triggers, any rip should be sold. Long cash, long bonds, and a short coffee setup, plus more…
***The MO Macro portfolio is up +7.5% on the year. The team and I will be publishing our quarterly review soon, where we’ll dissect our trades, our mistakes, and our blunders, as well as how we’re positioning for the quarter ahead. So keep an eye out for that. And if you’d like to join our Collective as we tackle 2025 head-on, just click here. ***
Alright, let’s get to it.
1. BofA in last week’s Flow Show: “Trump tariff announcement sends effective US tariff rate up to ~20% from 2.3% in 2024, highest level since 1911, equal to Smoot-Hawley protectionist level in 1930s (Chart 3); note combo of 1930 Smoot-Hawley, 1931 global financial architecture cracks (UK left Gold Standard Sept’31), Fed policy mistake (hiking in Oct’31 in response to global gold/FXcrises – Chart 5) triggered great equity bear (Chart 4), ended only with 1933 New Deal, 1934 Reciprocal Trade Agreements Act (ended US isolationism)… “markets stop panicking when policy makers start panicking”

2. From BBG: “Retail traders are viewing the recent US stock market decline as a buying opportunity, piling into their favorite assets such as Nvidia Corp. and the Vanguard S&P 500 ETF… Small investors are buying individual companies like Amazon, Apple, and Tesla, with some seeing two to eight times more buy orders than sell orders… Despite a bearish view on equities over the next six months among individual investors, many are adopting a ‘buy-the-dip’ mentality, believing that the market will inevitably go higher in the long term.”
THIS IS NOT WHAT YOU SEE AT MARKET BOTTOMS. Losers average losers – PTJ.

3. This chart from JPM shows that last week saw the largest weekly inflow on record and the largest weekly inflow into single stocks (h/t @Maverick_Equity).
This is the type of blind buy-the-dip conditioning you see at major market tops. This Pavlovian-induced leveraging creates the conditions for a significant top to occur.

4. So, we have the largest geopolitical shock of our lifetime + retail aggressively yoloing into the dip + valuations near all-time record highs + market concentration at record highs + household equity allocations at all-time highs… Chart via TS Lombard.

5. Net Indice Specs have yet to go properly short (chart via BBG’s Simon White).

6. Actual positioning still has a long way to go before it catches up to AAII sentiment (chart via BBG’s Simon White).

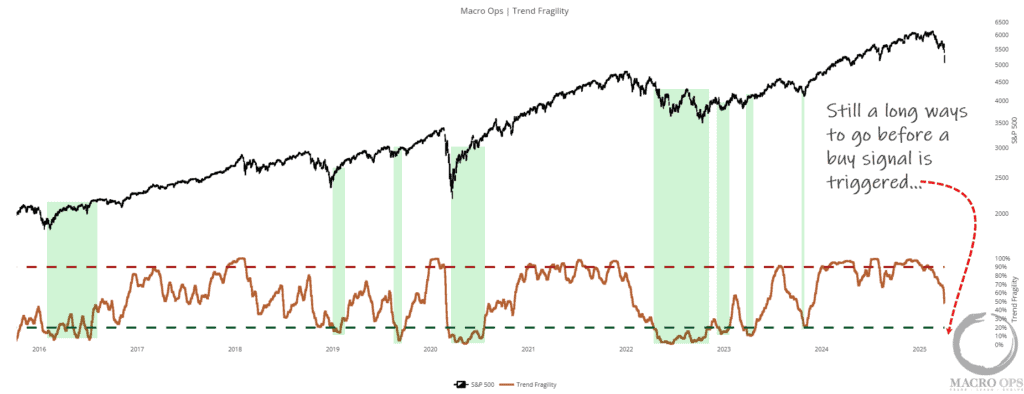
7. Okay, so what would get us here at MO actually interested in building up longs again? One, we need to see the subcomponents of our Trifecta Lens indicator set the conditions for buying. Here, Trend Fragilty shows it still has a ways to go before it triggers a buy signal.
8. Our Aggregate Call/Put Ratio also needs some work before a buy signal is triggered.

9. Our Pairwise Correlation indicator also has a ways to go before the conditions are set for a valid buy signal.

10. See a trend here? Yes, certain oversold indicators are very overesold. But nothing is stopping them from becoming more so. We need more pain and real capitulation for actual buying conditions to be set. And once we have the right conditions, we still need the technical catalyst in the form of Aggregate Buy Thrusts, signaling a durable bottom is in. Without this, we should expect any reversal to be temporary.

11. Outside of holding lots of cash, long bonds, and a little gold, there’s not much we’re actively interested in. Maybe USD longs soon if this turns into a major liquidity event. But last week, I shared the relative coffee/cotton chart showing the unusually wide performance spread between the two, arguing for a potential long setup in Cotton. That trade was stopped on the tariff news, but shorting coffee is an equally interesting setup.
Large Spec positioning, sentiment, and relative valuations are all above the 90th percentile.

12. It’s breaking down from a multi-month compression zone within a Bull Volatile regime, which is where major tops occur. If the tape stays weak, we’ll be going short this week.

Join The Collective
Thanks for reading.