Brandon here.
Today we’ve got a guest post from Srivatsan “Sri” Prakash. Sri is the 18-year-old Host of the Market Champions podcast dedicated to interviewing the best and the brightest in finance and economics, His thoughts can be found on Twitter @SrivatsPrakash.
Anyways, before dive into Sri’s piece, I want to let you know about the Macro Ops Collective.
The Collective is our full-kit soup-to-nuts service that provides research, theory, and a killer community that consists of dedicated traders, investors, and fund managers from around the world.
We’ve been told that there’s nothing else like it on the web. If you’d like to tackle markets with our group (whom, I should note, has been having a great year in markets), then just click the button below and sign up. And, as always, don’t hesitate to shoot me any Qs!
![]()
Alright, onto Sri’s post …
———————————————
When it comes to looking at the world (and especially markets), the idea of observing it through the lens of complexity science and chaos theory allows us to think through a different framework of non-linearity, and understanding how systems function as a “sum-of-their-parts”.
The other important thing about complexity science and chaos is that it is an integral part of physics, and the ideas in physics provide various interesting insights into markets.
What is a Complex System?
Complex systems are all around us – and a complex system can be informally defined as a system that is more than the sum of its parts. The thing about complex systems is small changes can cause massive effects i.e. “disproportionate causation” – small changes cause big impacts.
You may be familiar with the famous butterfly effect. The butterfly effect is a simple metaphor that describes a tornado in Mexico being caused by a butterfly flapping its wings in Brazil several weeks earlier. This was postulated by the famous mathematician and meteorologist Edward Lorenz in 1972.
Where Lorenz’s work became very interesting was when he was experimenting with changes in initial conditions for his weather model. He noticed that when he put in a certain set of initial conditions, his model produced one prediction. Yet, when he put in the same set of initial conditions, but (seemingly inconsequentially) rounded his data (ie 49.2 -> 49), the output changed significantly.
Seemingly small changes can cause massive changes in the outcomes of models, and complex systems. The non-linear impacts of small changes is a key characteristic in what makes a complex system. Another very important idea is stability, instability and what “critical points” are.
Critical Points? Disequilibrium? WTF is that?
You may have heard of the famous “stability breeds instability” by Hyman Minsky, whose ideas around financial boom-bust cycles are very important.
Systems tend to move from a state of equilibrium to disequilibrium. Think of a stock getting overvalued, and think of its fair price as “equilibrium”. Stability can roughly be thought of as the potential for non-linear changes to take place – where stability implies those changes aren’t likely to happen, and vice versa with instability.
Let’s say this value is $100. We can broadly think of the stock’s price/valuation in 4 different “stages”:
- Stable equilibrium
- Unstable equilibrium
- Stable disequilibrium
- Unstable disequilibrium
When the stock is at $100, and trades around that price (say in a range of $90-$110), we don’t have much to do. We sit around and twiddle our thumbs. Now, let’s say the stock is all of a sudden for some reason is slowly gaining more attention. Perhaps it’s because the ESG trend is in town and the company makes lithium batteries. Or maybe it’s a tech company and we’re in a mania similar to the late 1990s. As this popularity starts to pick up, we can think of the stock to be in an unstable equilibrium. Let’s say the stock’s price rises to $120. If you believe the fad will persist, now the potential for a non linear change, driven by the fad is high. Manias are certainly the best examples of such non-linear changes, simply due to their long-lasting effects (we still talk about the dotcom mania, or heck, the tulip mania from the 1600s!)
And as a result the stock may rise up several fold, even though it has very little fundamental backing. Now a lot of money ends up being lost when the stock is making a transition from an equilibrium price level to a disequilibrium price level. The issue is one, the “stock is overvalued” argument can be made when it’s at $400 just as well as it could be when it’s at $900 (and shorting it at $400 could lead to a >100% loss).
The second, and most important realization is the stock can be in a state of disequilibrium for a very long period of time – and these disequilibrium don’t have to be unstable.
The collapse of various states like the Soviet Union were in stable disequilibrium for a very long period of time. Think of the period post-Stalin and pre-Gorbachev. Under Stalin, many workers worked not under love for the country, but under fear. But they worked hard relative to what was to come. The Soviet economy was arguably fragmenting in the 1970s itself, yet it remained in that state of disequilibrium, held together by force till 1991 – when the USSR broke apart.
Similarly with the economic idea of pegging currencies – and pegs may or may not last, as a currency may be priced well above what it’s actually “worth”. This leads many people to short the peg (partly to try and be Soros 2.0), but mainly because there is always an argument to be made for why pegs are in an unstable situation (take Kyle Bass and his views on the Hong Kong Dollar).
Yet, shorting the HKD has been a widow-maker trade, even though people have tried shorting it every now and then – just because these disequilibrium can persist in a stable situation for a very long period of time. The time TO bet against a disequilibrium is as it enters a state of instability- where the potential for a non-linear outcome is large.
Remember that if Soros tried shorting the pound in a time when the British economy was doing well would have simply led to capital sitting around doing nothing – he needed a situation where there was something that was breeding instability (mismatched interest rates between Britain and Germany).
Another great example of instability would be watching what happened to energy markets (especially in Europe) over the last 12-18 months. Small changes in demand can cause massive changes in commodity prices, when production is constrained.
According to the IEA, demand for electricity went up ~6% in 2021 compared to 2020, and a smaller change in 2022, yet looking at how constrained the supply chains of natural gas and energy markets are, the price of electricity has risen 9-fold in places like Germany:
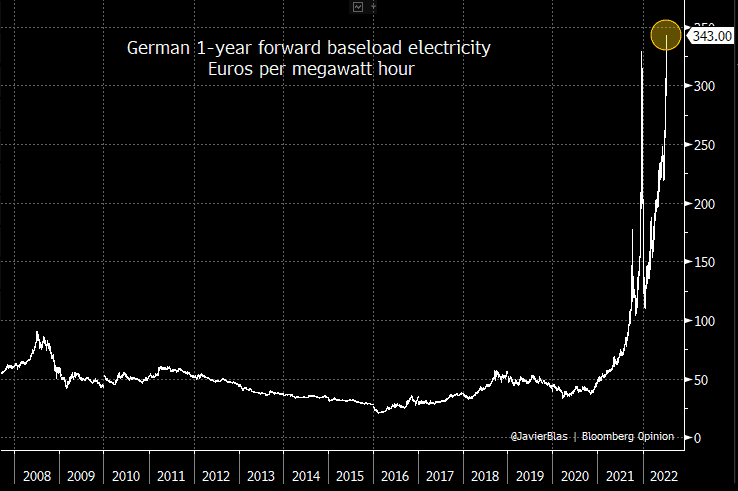 (from Javier Blas)
Feedback Loops
Feedback loops are another key aspect of complex systems. You’ve probably seen Soros’ idea of self-reinforcing feedback loops, where one thing leads to another – and we have self-defeating feedback loops as well.
A great example of a (relatively linear) feedback loop would be the thermostat in your house. Let’s say you set the thermostat to 20 degrees.It takes the temperature of the house from time to time. Every time the temperature increases above 20 degrees, the thermostat will cool the air coming out of the vent. It keeps measuring the temperature till it comes back to 20 degrees. Similarly, if the temperature goes below 20 degrees, it will naturally switch off, or it may release slightly warmer air. This is a self-normalizing system, and uses a feedback loop to not move away from the equilibrium level of temperature.
However, there are plenty of positive feedback mechanisms as well. Positive feedback mechanisms amplify changes in a non-linear fashion. Let’s look at the Earth’s atmosphere. When heat from the sun comes into our atmosphere, some of it is trapped within our atmosphere through the greenhouse effect. This causes the temperature to rise, and water evaporates from the surface of the earth to form water vapor. The increase in water vapor concentration traps even more heat, and amplifies the greenhouse effect, which in turn increases the evaporation of water! If this system got out of control, the earth’s temperature would rise drastically quick! Thankfully, the planet’s temperature is influenced by many other factors and not just this one feedback loop.
The interdependence of complex systems is what makes them very interesting to study (and very difficult to model). Typically we have the dependent variable y be some function of an independent x (denoted as f(x)). And any change in the value of x usually has an impact on the change in y – this is the basis for a lot of modern statistics.
But a lot of the world simply doesn’t work that way! This makes it very hard to model a complex system.
Fractals and Stock Markets
Benoit Mandelbrot’s famous book The (Mis)behaviour of Markets is a classic. The idea of fractals is a very interesting and important one. Fractals are basically complex patterns, and regardless of how you zoom in or out, the pattern broadly holds.
This is the famous Mandelbrot fractal:

(If you want to have some fun zooming in and out of fractals, check this awesome link out!)
But back to the idea of a fractal in markets – Mandelbrot had many very interesting discoveries including the ideas surrounding volatility clustering (markets would see more volatility in the first and last 15 minutes of the day, than intraday).
Similarly, the idea that forms the basis for technical analysis is the fractality of financial market prices. If you look at stock prices with no x-axis (no sense of what the timeframe is), it’s impossible to tell on what time horizon the stock prices are.
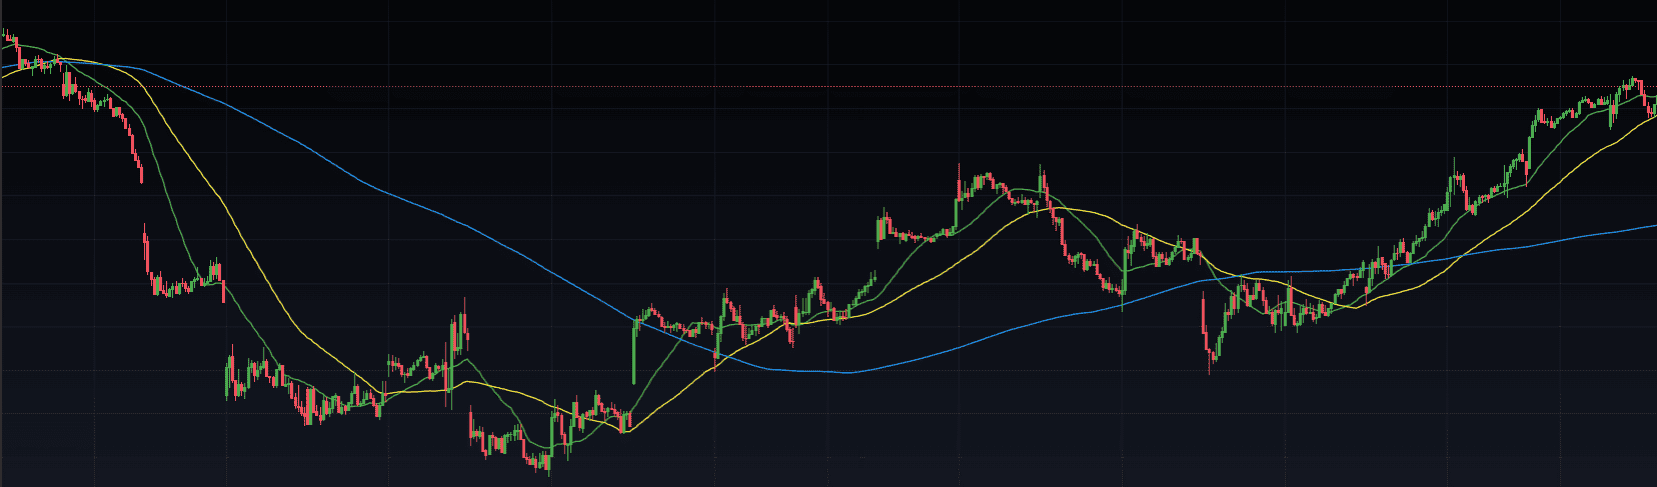
If this was the only chart you had, you really cannot tell what timeframe it’s on. Similarly, various price-action patterns (like the head-and-shoulders or the idea of a “breakout”) exist on 15-min chart just the way they do on weekly and monthly charts. If market microstructure wasn’t fractal, there would be no way to “cross-apply” technical analysis techniques.
Bifurcations, and non-Gaussian outcomes
While the word “bifurcation” sounds fancy (and it’s not the word that gets you girls at college parties- trust me, I’ve tried), it is simply the division of one thing into two paths. Let’s take a coin flip. If I flip a coin now, there are two possible outcomes – heads or tails. If on the first try I get heads, and I flip it again, there’s once again two possible outcomes. Similarly if I get tails, there are two possible outcomes. So as a whole, one coin flip has two outcomes – H and T, two coin flips have 4 outcomes – HH, HT, TH, TT, and three coin flips have 8 outcomes – HHH, HHT, HTH, HTT, THT, TTH, THH, and TTT.
With n coin flips, your total possible outcomes are 2n. With 10 coin flips, there are 1024 different “paths” your coin could’ve taken. Where this gets interesting is the wide variety of the number of outcomes, and then thinking through the probability of what those outcomes are.
There’s a famous Bruce Kovner quote:
“One of the jobs of a good trader is to imagine alternative scenarios. I try to form many different mental pictures of what the world should be like and wait for one of them to be confirmed. You keep trying them on one at a time. Inevitably, most of these pictures will turn out to be wrong — that is, only a few elements of the picture may prove correct. But then, all of a sudden, you will find that in one picture, nine out of ten elements click. That scenario then becomes your image of the world reality.”
This is important, because the outcomes can be drastically different. Here is bifurcation diagram xn+1=rxn(1−xn) (an example of a recursive, interdependent system and r is any number).
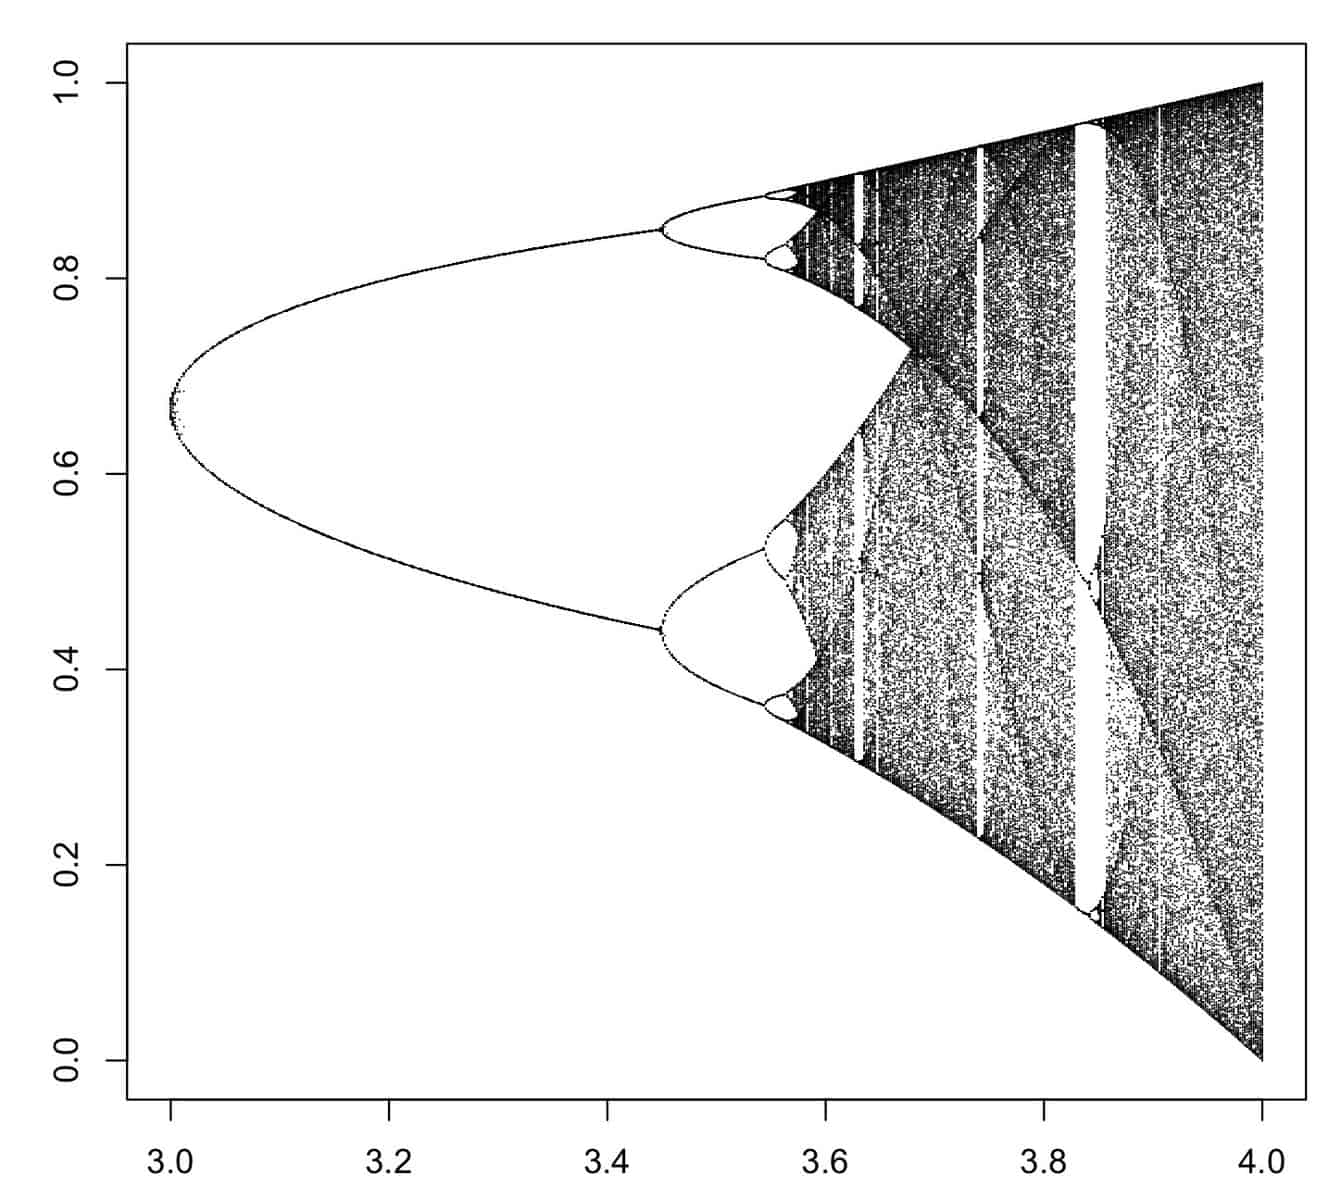
The results vary all the way from 0.0 to 1.0, and one can notice how bifurcations can collectively cause the results to change so drastically.
This is where Mandelbrot comes back in where in his early work, he discovered that financial markets did not move in a normal or Gaussian distribution. Nassim Taleb’s work on ideas around what are now called “Black Swan” events are similar to the extent they argue that stock market returns aren’t normally distributed.
Instead, the argument is that the true probability of so-called low probability events is actually a lot higher than what is initially thought. This leads to tail risk hedging being cheaper (and a whole host of HFs have dedicated themselves to hedging tail risk). This is characteristic of complex systems, where transitions from states of stability to instability happen infrequently, those tend to produce far-from-mean outcomes.
If returns were normally distributed, then ~0.3% would be beyond 3 standard deviations, but you see these >3 standard deviation (or sigma) events becoming more and more common.
Power Laws and Scaling Effects
If you haven’t read Scale by Geoffrey West, I highly, highly recommend you do. It’s a fantastic read on how the world is interconnected through “power laws”. Power laws is a relationship between two quantities where an increase in one quantity results in an exponential increase in the second.
Take the area of a square. If the side’s length is 2, the area is 2×2=4 sq units. Yet, if we double the side length from 2 to 4, the area is 4×4=16 sq units. The area QUADRUPLES while the side length simply doubles.
Power laws are very powerful and have broad applications in many areas of science.
If a cat weighed 100 kilos, and a mouse weighed just 1 kilo, how much more energy would the cat consume over the same timespan than the mouse? (Answer comes later!)
Kleiber’s law states that an animal’s metabolic rate is roughly M3/4 where M is the mass of the animal. How is this powerful? It helps us think in non-linear terms. A cat that weighs 100 times what a mouse weighs will consume 1003/4 = 31.62 times the energy that the mouse uses (which is significantly lower than the expected 100 times!)
While the rule is not set in stone, it’s a good example of how power laws are non linear in nature (and how many variables have non linear relationships that we may not even realize). Our buddy Mandelbrot returns again – he in 1963, found scaling in cotton prices. Since then, various research papers have found various scaling effects in financial markets – you can find a database of them here.
Non-linearity in Financial Markets
Financial markets are certainly non-linear in nature, and various processes amplify that. In 2021, Xavier Gabaix and Ralph Koijen wrote a paper titled In Search of the Origins of Financial Fluctuations: The Inelastic Markets Hypothesis where they made some very important discoveries.
Most importantly, “we find that investing $1 in the stock market increases the market’s aggregate value by about $5”. 5 times! Flows certainly have a non linear impact on markets, and that is just for starters.
When you think through behavioral dynamics (which are harder to quantitatively model), you notice that a behavioral change can cause not only market microstructure to change (increased interest in call options boosting dealer hedging), but more importantly can cause non linear changes in prices through bubbles, manias, etc.
Similarly, compounding is a non-linear process, causing exponential growth or decay rates on wealth. If you start at 1 and you get 1% better everyday for a year, that is 1.01365 = 37.78. Yet, when you start at 1 and get 1% worse everyday for a year, that is 0.99 raised to the power 365, which is equal to 0.0255! The drastic difference between both show how quickly compounding AND decay can work.
I hope this article gave you some insight into the world of complex systems, systems thinking and chaos theory and how you can apply some of that thinking to financial markets!
**Note: Enrollment into our Collective kicks off today and will be running into the end of the week.
The Collective is our full-kit soup-to-nuts service that provides research, theory, and a killer community that consists of dedicated traders, investors, and fund managers from around the world.
We’ve been told that there’s nothing else like it on the web. If you’d like to tackle markets with our group (whom, I should note, has been having a great year in markets), then just click the button below and sign up. And, as always, don’t hesitate to shoot me any Qs!***
![]()